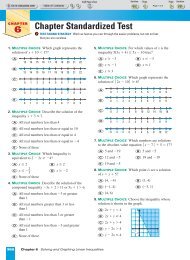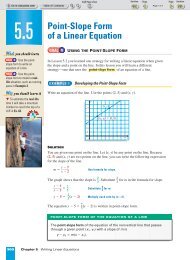
Alg 1 5.4 pg 296
Alg 1 5.4 pg 296
Alg 1 5.4 pg 296

Create successful ePaper yourself
Turn your PDF publications into a flip-book with our unique Google optimized e-Paper software.
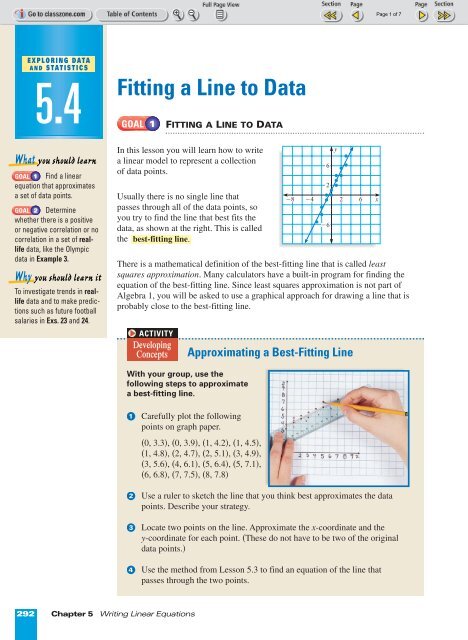
FOCUS ONAPPLICATIONSEXAMPLE 2Approximating a Best-Fitting LineDISCUS EVENTThe discus throw isone of the original Olympicevents. New records for thedistance an athlete canthrow the discus continue tobe set.REALLIFEDISCUS THROWS The winning Olympic discusthrows from 1908 to 1996 are shown in the table.After graphing these data points, draw a line thatcorresponds closely to the data. Write an equationof your line.SOLUTIONLet x represent the years since 1900. Let yrepresent the winning throw. To begin, plot thepoints given by the ordered pairs. Then sketchthe line that appears to best fit the points.Distance (ft)240220200180160140120yWinning Discus Throws(8, 138)(96, 230)Olympic Winningyear throw1908 134.1 ft1912 148.3 ft1920 146.6 ft1924 151.4 ft1928 155.3 ft1932 162.4 ft1936 165.6 ft1948 173.2 ft1952 180.5 ft1956 184.9 ft1960 194.2 ft1964 200.1 ft1968 212.5 ft1972 211.3 ft1976 221.5 ft1980 218.7 ft1984 218.5 ft1988 225.8 ft1992 213.7 ft1996 227.7 ft100008 16 24 32 40 48 56 64 72 80 88 96 xYears since 1900DATA UPDATE ofInformation Please Almanacat www.mcdougallittell.comINTERNETNext, find two points that lie on the line, such as (8, 138) and (96, 230). Find theslope of the line through these points.y 2 º y 1m = = 23 0 º 13896º 8= 9 2 8 ≈ 1.05x2 º x 18To find the y-intercept of the line, substitute the values m = 1.05, x = 8, andy = 138 in the slope-intercept form.y = mx + bWrite slope-intercept form.138 = (1.05)(8) + b Substitute 1.05 for m, 8 for x, and 138 for y.138 = 8.4 + b Simplify.129.6 = b Solve for b. An approximate equation of the best-fitting line is y = 1.05x + 129.6. In mostyears, the winner of the discus throw was able to throw the discus farther thanthe previous winner.294 Chapter 5 Writing Linear Equations
GOAL 2DETERMINING THE CORRELATION OF X AND YCorrelation is a number r satisfying º1 ≤ r ≤ 1 that indicates how well aparticular set of data can be approximated by a straight line. The Activity onpage 299 shows how to find an r-value using a calculator. In this course you willdescribe a correlation without actually finding r-values, as described below.When the points on a scatter plot can be approximated by a line with positiveslope, x and y have a positive correlation. When the points can be approximatedby a line with negative slope, x and y have a negative correlation. When thepoints cannot be well approximated by a straight line, we say that there isrelatively no correlation.yyyxxxPositive correlation Negative correlation Relatively no correlationEXAMPLE 3Using CorrelationIn swimming events, performance is positively correlated with time.a. The two graphs show the winning 100-meter women’s freestyle swimmingtimes and the winning women’s long jump distances for the Olympics from1948 through 1996. Which is which? Explain your reasoning.b. Describe the correlation of each set of data.FOCUS ONAPPLICATIONS1948195619641972Year1980198819961948195619641972Year198019881996 Source: Information Please Almanac Source: Information Please AlmanacFREESTYLESWIMMING In afreestyle swimming event,the swimmer can choosethe stroke. Usually, theswimmer chooses theAustralian Crawl.APPLICATION LINKwww.mcdougallittell.comREALINTERNETLIFESOLUTIONa. The first graph must represent the long jump distances because the winnershave tended to jump farther with each Olympic year. The second graph mustrepresent the swimming times because the winners have tended to swimfaster with each Olympic year, so their times have been decreasing.b. The first graph shows a positive correlation between the year and the winningdistance. The second graph shows a negative correlation between the yearand the winning time.<strong>5.4</strong> Fitting a Line to Data 295
GUIDED PRACTICEVocabulary Check ✓Concept Check ✓Skill Check ✓1. The line that most closely fits a set of data is called the ? .Draw a scatter plot of data that have the given correlation.2. Positive 3. Negative 4. Relatively no5. DISCUS THROWS Predict the distance of the winning throw in theyear 2005 from the data in Example 2. Explain your reasoning.Draw a scatter plot of the data. State whether x and y have a positivecorrelation, a negative correlation, or relatively no correlation. If possible,draw a line that closely fits the data and write an equation of the line.6. x y 7. x y 8. x y 9.1 2º3 81.1 5.12 9º2 61.7 5.53 8º1 52.2 5.94 10 32.6 6.35 41 23.3 7.56 82 03.5 7.6x y5.5 0.46.2 1.07.7 2.58.1 2.99.2 4.39.7 5.5PRACTICE AND APPLICATIONSSTUDENT HELPExtra Practiceto help you masterskills is on p. 801.FITTING LINES Copy the graph and draw a line that corresponds closely tothe data. Write an equation of your line.10. y11. y 12.y3111113 x31131 x1 1 3 x1FITTING LINES Draw a scatter plot of the data. Draw a line thatcorresponds closely to the data and write an equation of the line.STUDENT HELPHOMEWORK HELPExample 1: Exs. 10–16,23Example 2: Exs. 10–16,23Example 3: Exs. 17–2213. x y 14. x y 15. x y 16.1.0 3.8 3.0 7.1 3.0 9.91.5 4.2 3.4 8.1 3.5 9.71.7 5.3 4.0 8.5 3.7 8.62.0 5.8 4.1 8.9 4.0 8.12.0 5.5 4.8 9.6 4.0 8.41.5 6.7 5.2 9.8 4.5 7.4x y5.0 6.8<strong>5.4</strong> 5.86.0 5.66.1 5.26.8 4.37.2 3.5<strong>296</strong> Chapter 5 Writing Linear Equations
GRAPHICAL REASONING State whether x and y have a positive correlation,a negative correlation, or relatively no correlation.17. y18. y19.y2222 x222 x2222xSTUDENT HELP20. y21. y22.yHOMEWORK HELPVisit our Web sitewww.mcdougallittell.comfor help with Exs. 23 and24.INTERNET11 x11 x11 xFOOTBALL SALARIESIn Exercises 23 and 24, usethe following information.The median base salary forplayers in the NationalFootball League from 1983 to1997 is shown in the scatterplot at the right. In the scatterplot, y represents the salaryand x represents the numberof years since 1980.23. Find an equation ofthe line that you thinkclosely fits the data.Base salary(thousands of dollars)y5001000024. Use the equation from Exercise 23 to approximate the median base salaryin the year 2010.BIOLOGY CONNECTION In Exercises 25–27,use the following information.As people grow older, the size of their pupilstends to get smaller. The average diameter (inmillimeters) of one person’s pupils is given inthe table.25. Draw a scatter plot of the day diametersand another of the night diameters. Let xrepresent the person’s age and let yrepresent pupil diameters.26. Find an equation of the line that closely fitsthe day and the night sets of data forpupil diameters.Median Base Salary in Football4 8 12 16Years since 198027. CRITICAL THINKING Do the two lines have the same slope? Explain youranswer in the context of the real-life data.400300200 Source: National Football League Players AssociationxSample Pupil DiametersAge (years) Day Night20 4.7 8.030 4.3 7.040 3.9 6.050 3.5 5.060 3.1 4.170 2.7 3.280 2.3 2.5<strong>5.4</strong> Fitting a Line to Data 297
TestPreparationMULTI-STEP PROBLEM In Exercises 28–31, use the scatter plots. They showa library’s annual book budget B and the average price P of a book.Library Book BudgetBook PricesBook budget(thousands of dollars)B201816141210002 4 6 8 10 12Years after 1990tAverage price per book(dollars)P403632282420002 4 6 8 10 12Years after 1990t★ ChallengeEXTRA CHALLENGEwww.mcdougallittell.com28. Find an equation of the line that you think best represents the library’s budgetfor purchasing books.29. Find an equation of the line that you think best represents the average priceof a new book purchased by the library.30. Interpret the slopes of the two lines in the context of the problem.31. CRITICAL THINKING Suppose that you want to ask town officials to increasethe library’s annual book budget. Use your results and the information aboveto write a letter that explains why the library budget should be increased.ANALYZING DATA In Exercises 32–34, use the Book Prices scatter plot above.32. Explain why you would not want to choose the points for the years 1992 and1997 to write an equation that represents the data.33. Will choosing the two points that are the farthest apart always give you theclosest line? Explain why or why not. If not, sketch a counterexample.34. Explain how to choose a good pair of points to find a line that is probablyclose to the best-fitting line.MIXED REVIEWHORIZONTAL AND VERTICAL LINES Decide whether the line is horizontal orvertical. Then graph the line. (Review 4.2)35. y = º2 36. y = 3 37. x = 4 38. x = º5VISUAL REASONING Without calculating, state whether the slope of theline through the points is positive, negative, zero, or undefined. (Review 4.4)39. (1, 4), (3, 5) 40. (2, 5), (4, 1) 41. (6, 1), (3, 1) 42. (5, 2), (4, 3)WRITING EQUATIONS OF LINES Write an equation of the line that passesthrough the points. (Review 5.3 for 5.5)43. (2, 5), (6, 4) 44. (1, 4), (3, 7) 45. (3, 7), (7, 3) 46. (5, 2), (4, 3)47. (º3, 1), (4, º2) 48. (º2, º3), (0, 4) 49. (5, 1), (3, º6) 50. (0, º6), (º1, 7)298 Chapter 5 Writing Linear Equations