Rice (Oryza sativa. L) genetic diversity for early vigor and drought ...
Rice (Oryza sativa. L) genetic diversity for early vigor and drought ...
Rice (Oryza sativa. L) genetic diversity for early vigor and drought ...
- No tags were found...

You also want an ePaper? Increase the reach of your titles
YUMPU automatically turns print PDFs into web optimized ePapers that Google loves.
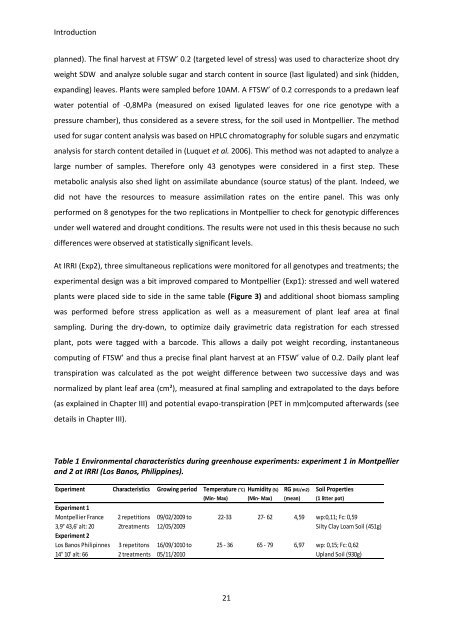
Introductionplanned). The final harvest at FTSW’ 0.2 (targeted level of stress) was used to characterize shoot dryweight SDW <strong>and</strong> analyze soluble sugar <strong>and</strong> starch content in source (last ligulated) <strong>and</strong> sink (hidden,exp<strong>and</strong>ing) leaves. Plants were sampled be<strong>for</strong>e 10AM. A FTSW’ of 0.2 corresponds to a predawn leafwater potential of -0,8MPa (measured on exised ligulated leaves <strong>for</strong> one rice genotype with apressure chamber), thus considered as a severe stress, <strong>for</strong> the soil used in Montpellier. The methodused <strong>for</strong> sugar content analysis was based on HPLC chromatography <strong>for</strong> soluble sugars <strong>and</strong> enzymaticanalysis <strong>for</strong> starch content detailed in (Luquet et al. 2006). This method was not adapted to analyze alarge number of samples. There<strong>for</strong>e only 43 genotypes were considered in a first step. Thesemetabolic analysis also shed light on assimilate abundance (source status) of the plant. Indeed, wedid not have the resources to measure assimilation rates on the entire panel. This was onlyper<strong>for</strong>med on 8 genotypes <strong>for</strong> the two replications in Montpellier to check <strong>for</strong> genotypic differencesunder well watered <strong>and</strong> <strong>drought</strong> conditions. The results were not used in this thesis because no suchdifferences were observed at statistically significant levels.At IRRI (Exp2), three simultaneous replications were monitored <strong>for</strong> all genotypes <strong>and</strong> treatments; theexperimental design was a bit improved compared to Montpellier (Exp1): stressed <strong>and</strong> well wateredplants were placed side to side in the same table (Figure 3) <strong>and</strong> additional shoot biomass samplingwas per<strong>for</strong>med be<strong>for</strong>e stress application as well as a measurement of plant leaf area at finalsampling. During the dry-down, to optimize daily gravimetric data registration <strong>for</strong> each stressedplant, pots were tagged with a barcode. This allows a daily pot weight recording, instantaneouscomputing of FTSW’ <strong>and</strong> thus a precise final plant harvest at an FTSW’ value of 0.2. Daily plant leaftranspiration was calculated as the pot weight difference between two successive days <strong>and</strong> wasnormalized by plant leaf area (cm²), measured at final sampling <strong>and</strong> extrapolated to the days be<strong>for</strong>e(as explained in Chapter III) <strong>and</strong> potential evapo-transpiration (PET in mm)computed afterwards (seedetails in Chapter III).Table 1 Environmental characteristics during greenhouse experiments: experiment 1 in Montpellier<strong>and</strong> 2 at IRRI (Los Banos, Philippines).Experiment Characteristics Growing period Temperature (°C) Humidity (%) RG (MJ/m2) Soil Properties(Min- Max) (Min- Max) (mean) (1 litter pot)Experiment 1Montpellier France 2 repetitions 09/02/2009 to 22-33 27- 62 4,59 wp:0,11; Fc: 0,593,9° 43,6' alt: 20 2treatments 12/05/2009 Silty Clay Loam Soil (451g)Experiment 2Los Banos Philipinnes 3 repetitons 16/09/1010 to 25 - 36 65 - 79 6,97 wp: 0,15; Fc: 0,6214° 10' alt: 66 2 treatments 05/11/2010 Upl<strong>and</strong> Soil (930g)21