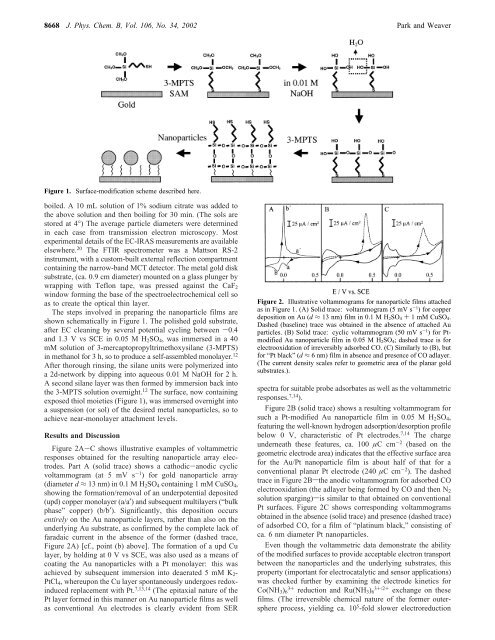
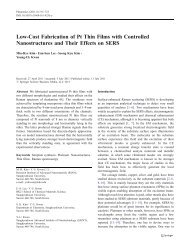
8668 J. Phys. Chem. B, Vol. 106, No. 34, 2002 Park and WeaverFigure 1. <strong>Surface</strong>-modification scheme described here.boiled. A 10 mL solution of 1% sodium citrate was added tothe above solution and then boiling <strong>for</strong> 30 min. (The sols arestored at 4°) The average particle diameters were determinedin each case from transmission electron microscopy. Mostexperimental details of the EC-IRAS measurements are availableelsewhere. 20 The FTIR spectrometer was a Mattson RS-2instrument, with a custom-built external reflection compartmentcontaining the narrow-band MCT detector. The metal gold disksubstrate, (ca. 0.9 cm diameter) mounted on a glass plunger bywrapping with Teflon tape, was pressed against the CaF 2window <strong>for</strong>ming the base of the spectroelectrochemical cell soas to create the optical thin layer.The steps involved in preparing the nanoparticle films areshown schematically in Figure 1. The polished gold substrate,after EC cleaning by several potential cycling between -0.4and 1.3 V vs SCE in 0.05 M H 2 SO 4 , was immersed in a 40mM solution of 3-mercaptopropyltrimethoxysilane (3-MPTS)in methanol <strong>for</strong> 3 h, so to produce a self-assembled monolayer. 12After thorough rinsing, the silane units were polymerized intoa 2d-network by dipping into aqueous 0.01 M NaOH <strong>for</strong> 2 h.A second silane layer was then <strong>for</strong>med by immersion back intothe 3-MPTS solution overnight. 12 The surface, now containingexposed thiol moieties (Figure 1), was immersed overnight intoa suspension (or sol) of the desired metal nanoparticles, so toachieve near-monolayer attachment levels.Results and DiscussionFigure 2A-C shows illustrative examples of voltammetricresponses obtained <strong>for</strong> the resulting nanoparticle array electrodes.Part A (solid trace) shows a cathodic-anodic cyclicvoltammogram (at 5 mV s -1 ) <strong>for</strong> gold nanoparticle array(diameter d ≈ 13 nm) in 0.1 M H 2 SO 4 containing 1 mM CuSO 4 ,showing the <strong>for</strong>mation/removal of an underpotential deposited(upd) copper monolayer (a/a′) and subsequent multilayers (“bulkphase” copper) (b/b′). Significantly, this deposition occursentirely on the Au nanoparticle layers, rather than also on theunderlying Au substrate, as confirmed by the complete lack offaradaic current in the absence of the <strong>for</strong>mer (dashed trace,Figure 2A) [cf., point (b) above]. The <strong>for</strong>mation of a upd Culayer, by holding at 0VvsSCE, was also used as a means ofcoating the Au nanoparticles with a Pt monolayer: this wasachieved by subsequent immersion into deaerated 5 mM K 2 -PtCl 4 , whereupon the Cu layer spontaneously undergoes redoxinducedreplacement with Pt. 7,13,14 (The epitaxial nature of thePt layer <strong>for</strong>med in this manner on Au nanoparticle films as wellas conventional Au electrodes is clearly evident from SERFigure 2. Illustrative voltammograms <strong>for</strong> nanoparticle films attachedas in Figure 1. (A) Solid trace: voltammogram (5 mV s -1 ) <strong>for</strong> copperdeposition on Au (d ≈ 13 nm) film in 0.1 M H 2SO 4 + 1 mM CuSO 4.Dashed (baseline) trace was obtained in the absence of attached Auparticles. (B) Solid trace: cyclic voltammogram (50 mV s -1 ) <strong>for</strong> PtmodifiedAu nanoparticle film in 0.05 M H 2SO 4; dashed trace is <strong>for</strong>electrooxidation of irreversibly adsorbed CO. (C) Similarly to (B), but<strong>for</strong> “Pt black” (d ≈ 6 nm) film in absence and presence of CO adlayer.(The current density scales refer to geometric area of the planar goldsubstrates.).spectra <strong>for</strong> suitable probe adsorbates as well as the voltammetricresponses. 7,14 ).Figure 2B (solid trace) shows a resulting voltammogram <strong>for</strong>such a Pt-modified Au nanoparticle film in 0.05 M H 2 SO 4 ,featuring the well-known hydrogen adsorption/desorption profilebelow 0 V, characteristic of Pt electrodes. 7,14 The chargeunderneath these features, ca. 100 µC cm -2 (based on thegeometric electrode area) indicates that the effective surface area<strong>for</strong> the Au/Pt nanoparticle film is about half of that <strong>for</strong> aconventional planar Pt electrode (240 µC cm -2 ). The dashedtrace in Figure 2Bsthe anodic voltammogram <strong>for</strong> adsorbed COelectrooxidation (the adlayer being <strong>for</strong>med by CO and then N 2solution sparging)sis similar to that obtained on conventionalPt surfaces. Figure 2C shows corresponding voltammogramsobtained in the absence (solid trace) and presence (dashed trace)of adsorbed CO, <strong>for</strong> a film of “platinum black,” consisting ofca. 6 nm diameter Pt nanoparticles.Even though the voltammetric data demonstrate the abilityof the modified surfaces to provide acceptable electron transportbetween the nanoparticles and the underlying substrates, thisproperty (important <strong>for</strong> electrocatalytic and sensor applications)was checked further by examining the electrode kinetics <strong>for</strong>Co(NH 3 )3+ 6 reduction and Ru(NH 3 )3+/2+ 6 exchange on thesefilms. (The irreversible chemical nature of the <strong>for</strong>mer outersphereprocess, yielding ca. 10 5 -fold slower electroreduction
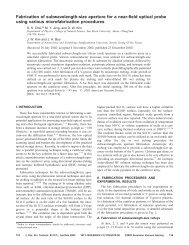
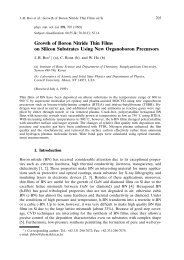
<strong>Attaching</strong> <strong>Metal</strong> Nanoparticles onto Gold J. Phys. Chem. B, Vol. 106, No. 34, 2002 8669Figure 3. (A) Typical electrochemical IRAS spectra (in ν CO region)at -0.25 V vs SCE in 0.05 M H 2SO 4 <strong>for</strong> saturated CO adlayers <strong>for</strong>medon Pt-coated Au, Pt black, and 1:1 Pt/Ru alloy (d ≈ 2.5 nm) filmsattached to gold as in Figure 1. (B) Comparison of IRAS spectra (at-0.25 V) <strong>for</strong> C/Pt (d ≈ 8.8 nm) film physically adsorbed on bare Ausubstrate, and attached by using present MPTS film.rates than <strong>for</strong> the latter reversible reaction, 15 enables unambiguousmeasurement of electrode kinetics even when using slowlinear sweep voltammetry. 15-17 ) Briefly, the Ru(NH 3 )3+/2+ 6couple (<strong>for</strong>mal potential -0.18 V vs SCE) exhibited essentiallyreversible voltammetric behavior, at least <strong>for</strong> scan rates below1Vs -1 , on the 3-MPTS modified surface both in the absenceand presence of the nanoparticles. The irreversible voltammetricwave <strong>for</strong> Co(NH 3 )3+ 6 reduction was shifted to higher overpotentials,from ca. -0.2 to -0.4 V vs SCE, in the presence ofthe 3-MPTS film, indicating a substantial (ca. 10 3 fold)attenuation of the electron-transfer rates, essentially in accordancewith the electron-transmission properties of relatedalkanethiol films on gold electrodes. 18.19 However, the additionof Au nanoparticles decreased the overpotential by ca. 0.1 V(i.e., increased the rate by 10-fold or so). Overall, thesecharacteristics are sufficiently favorable to endow the nanoparticlefilms with reasonable electroactivity <strong>for</strong> electrocatalyticpurposes.Of central interest here are the in-situ IRAS properties ofadsorbates on these and other nanoparticle electrode films.Figure 3A,B shows typical spectra obtained <strong>for</strong> saturated COadlayers <strong>for</strong>med on various Pt nanoparticles. Each spectrumrefers to -0.25Vin0.05MH 2 SO 4 (with CO removed fromsolution prior to the measurement). The reference spectrum(obtained to subtract out solution and other spectral interferences)was acquired after stepping to 0.65 V to electrooxidativelyremove the adsorbate. 20 Figure 3A compares spectra inthe C-O stretching (ν CO ) region <strong>for</strong> Pt-coated Au, Pt black (videsupra), and 1:1 Pt/Ru alloy particles (d ≈ 2.5 nm), as noted. Ineach case, a well-defined atop ν CO feature is evident at 2035-2060 cm -1 . (The ν CO redshift observed <strong>for</strong> the Pt/Ru particle isconsistent with the presence of a surface alloy. 21 ) The dependenceof the ν CO frequency on the electrode potential E (theso-called Stark-tuning slope, dν CO /dE), typically 30-35 cm -1V -1 , is essentially the same as obtained <strong>for</strong> conventional Ptelectrodes. 6 Significantly, this confirms that the electrodepotential of the nanoparticles varies in tandem with that <strong>for</strong> theunderlying metal substrate, further supporting the occurrenceof electronic equilibration [point (a) above].Figure 3B shows a comparison between the ν CO spectraobtained <strong>for</strong> a C/Pt film deposited physically onto a bare goldelectrode (as in refs 6,8) with that <strong>for</strong> the same material attachedonto the MPTS-modified gold surface (upper, lower spectra,respectively). The ν CO peak absorbance and band shape towardFigure 4. Comparison of potential-difference infrared spectra obtained<strong>for</strong> saturated CO adlayers on planar (polycrystalline) Pt, C/Pt nanoparticlefilm physically deposited on bare Au, and C/Pt film attachedto MPTS-modified Au, with intensity (absorbance) scales adjusted soto yield the same 2345 cm -1 band intensity (arising from CO 2electrooxidation).lower wavenumbers are very similar on the two substrates.However, an important difference is that the “anomalous”negative-going ν CO peak observed on the high-wavenumber sideof the top spectrum is entirely absent <strong>for</strong> the nanoparticles boundon the 3-MPTS modified surface. As already mentioned, such“anti-absorbance” ν CO band components are often observed inaggregated metal nanoparticle films, 8,11 associated with theircomplex dielectric behavior, which can obfuscate the IRAS datainterpretation.Another welcome property of the present nanoparticle filmsurfaces is the observation of infrared cross sections <strong>for</strong>chemisorbates that are significantly (10-fold or more) larger thanon chemically similar, yet macroscopically planar, metalsubstrates. The measurement of such infrared “enhancementfactors”, EF, is readily undertaken <strong>for</strong> irreversibly adsorbed COon electrodes by comparing the integrated absorbance <strong>for</strong> theν CO band(s), A(CO), with that <strong>for</strong> the corresponding 2345 cm -1band <strong>for</strong> CO 2 , A(CO 2 ), <strong>for</strong>med upon CO electrooxidation. 6[Since A(CO 2 ) is proportional to the number of adsorbedmolecules (<strong>for</strong> a given spectral thin-layer configuration),comparison of the A(CO)/A(CO 2 ) ratios <strong>for</strong> nanoparticle filmelectrodes with that <strong>for</strong> a “reference planar” surface enables EFestimates to be determined <strong>for</strong> the <strong>for</strong>mer.] Potential-differencespectra illustrating this procedure are shown in Figure 4, wherethe intensity scale is adjusted so that the 2345 cm -1 bandamplitude is identical: the ν CO band intensities then yielddirectly the relative EF values. The IRAS data in Figure 4 are<strong>for</strong> saturated CO adlayers <strong>for</strong>med on three surfaces: planar(polycrystalline) Pt, a multilayer C/Pt film on bare gold (cf.,ref 8), and a monolayer-level C/Pt film on MPTS-modified gold.The marked infrared enhancement (EF ≈ 15) <strong>for</strong> the last filmwith respect to planar Pt is clearly evident, as is the larger EFvalue in comparison with that <strong>for</strong> the C/Pt film on unmodifiedgold. Evidently, then the present procedure yields IRAS datadisplaying high analytical sensitivity (i.e., substantial EF values)as well as lack of anomalous “anti-absorbance” features.Concluding RemarksOverall, the use of MPTS-modified gold surfaces provides aversatile route <strong>for</strong> preparing monolayer-level films of metalnanoparticles exhibiting near-ideal IRAS as well as electrochemicalproperties. This strategy should also prove useful <strong>for</strong>