Low-Cost Fabrication of Pt Thin Films with ... - IngentaConnect
Low-Cost Fabrication of Pt Thin Films with ... - IngentaConnect
Low-Cost Fabrication of Pt Thin Films with ... - IngentaConnect

You also want an ePaper? Increase the reach of your titles
YUMPU automatically turns print PDFs into web optimized ePapers that Google loves.
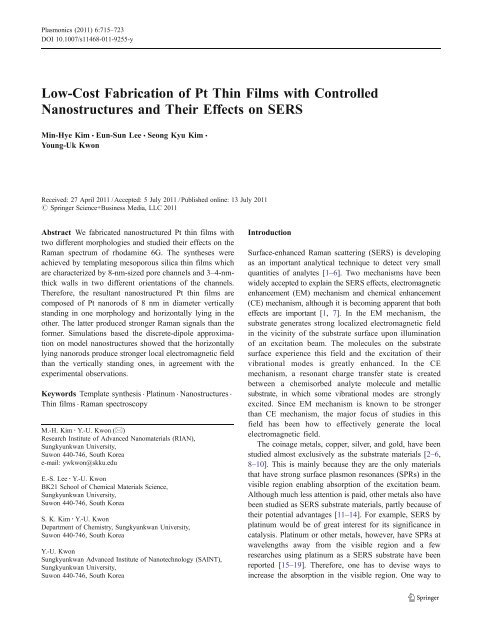
Plasmonics (2011) 6:715–723DOI 10.1007/s11468-011-9255-y<strong>Low</strong>-<strong>Cost</strong> <strong>Fabrication</strong> <strong>of</strong> <strong>Pt</strong> <strong>Thin</strong> <strong>Films</strong> <strong>with</strong> ControlledNanostructures and Their Effects on SERSMin-Hye Kim & Eun-Sun Lee & Seong Kyu Kim &Young-Uk KwonReceived: 27 April 2011 /Accepted: 5 July 2011 /Published online: 13 July 2011# Springer Science+Business Media, LLC 2011Abstract We fabricated nanostructured <strong>Pt</strong> thin films <strong>with</strong>two different morphologies and studied their effects on theRaman spectrum <strong>of</strong> rhodamine 6G. The syntheses wereachieved by templating mesoporous silica thin films whichare characterized by 8-nm-sized pore channels and 3–4-nmthickwalls in two different orientations <strong>of</strong> the channels.Therefore, the resultant nanostructured <strong>Pt</strong> thin films arecomposed <strong>of</strong> <strong>Pt</strong> nanorods <strong>of</strong> 8 nm in diameter verticallystanding in one morphology and horizontally lying in theother. The latter produced stronger Raman signals than theformer. Simulations based the discrete-dipole approximationon model nanostructures showed that the horizontallylying nanorods produce stronger local electromagnetic fieldthan the vertically standing ones, in agreement <strong>with</strong> theexperimental observations.Keywords Template synthesis . Platinum . Nanostructures .<strong>Thin</strong> films . Raman spectroscopyM.-H. Kim : Y.-U. Kwon (*)Research Institute <strong>of</strong> Advanced Nanomaterials (RIAN),Sungkyunkwan University,Suwon 440-746, South Koreae-mail: ywkwon@skku.eduE.-S. Lee : Y.-U. KwonBK21 School <strong>of</strong> Chemical Materials Science,Sungkyunkwan University,Suwon 440-746, South KoreaS. K. Kim : Y.-U. KwonDepartment <strong>of</strong> Chemistry, Sungkyunkwan University,Suwon 440-746, South KoreaY.-U. KwonSungkyunkwan Advanced Institute <strong>of</strong> Nanotechnology (SAINT),Sungkyunkwan University,Suwon 440-746, South KoreaIntroductionSurface-enhanced Raman scattering (SERS) is developingas an important analytical technique to detect very smallquantities <strong>of</strong> analytes [1–6]. Two mechanisms have beenwidely accepted to explain the SERS effects, electromagneticenhancement (EM) mechanism and chemical enhancement(CE) mechanism, although it is becoming apparent that botheffects are important [1, 7]. In the EM mechanism, thesubstrate generates strong localized electromagnetic fieldin the vicinity <strong>of</strong> the substrate surface upon illumination<strong>of</strong> an excitation beam. The molecules on the substratesurface experience this field and the excitation <strong>of</strong> theirvibrational modes is greatly enhanced. In the CEmechanism, a resonant charge transfer state is createdbetween a chemisorbed analyte molecule and metallicsubstrate, in which some vibrational modes are stronglyexcited. Since EM mechanism is known to be strongerthan CE mechanism, the major focus <strong>of</strong> studies in thisfield has been how to effectively generate the localelectromagnetic field.The coinage metals, copper, silver, and gold, have beenstudied almost exclusively as the substrate materials [2–6,8–10]. This is mainly because they are the only materialsthat have strong surface plasmon resonances (SPRs) in thevisible region enabling absorption <strong>of</strong> the excitation beam.Although much less attention is paid, other metals also havebeen studied as SERS substrate materials, partly because <strong>of</strong>their potential advantages [11–14]. For example, SERS byplatinum would be <strong>of</strong> great interest for its significance incatalysis. Platinum or other metals, however, have SPRs atwavelengths away from the visible region and a fewresearches using platinum as a SERS substrate have beenreported [15–19]. Therefore, one has to devise ways toincrease the absorption in the visible region. One way to
716 Plasmonics (2011) 6:715–723achieve this is to construct nanostructured films <strong>with</strong>controlled morphologies. For example, Abdelsalam et al.fabricated <strong>Pt</strong> films by replicating close-packed polymerspheres to produce regular patterns <strong>with</strong> repeating distances<strong>of</strong> a few hundreds <strong>of</strong> nanometers, and showed some <strong>of</strong>them have good matching <strong>with</strong> visible light enabling SERSon them [14]. The other possibility is to form regularnanostructured films in which constituting nanoparticlesand/or nanorods interact to broaden the SPR peak and shiftthe SPR band to longer wavelengths. This method also mayhave the advantage <strong>of</strong> producing narrow gaps betweennanoparticles or nanorods <strong>with</strong> strongly localized electromagneticfields, which are believed to serve as hot spots forSERS effects. However, there has been quite a few worksdone in this direction.In fact, the importance <strong>of</strong> the morphology control <strong>of</strong>nanostructured films is not limited to <strong>Pt</strong>. The morphologyeffects <strong>of</strong> coinage metals have been widely studied. Typically,electron beam lithography [20–22] andLangmuir–Blodgett(LB) technique <strong>of</strong> colloidal nanoparticles [23–27] have beenexplored toward this end. These methods have beensuccessful in increasing the SERS effects, but also revealsome limitations. As for the electron beam lithography, thefabrication is time-consuming and expensive, prohibitingsubstrates in large areas [28]. Although the LB techniquecan produce nanostructured films <strong>with</strong> large areas atmuch lower cost, it is difficult to make films <strong>with</strong> highdensities and regular inter-particle distances.Template-assisted synthesis can produce thin films <strong>with</strong>regularly ordered nanostructures over large areas at lowcost [29]. However, such possibilities have been exploredfor SERS only in a few cases. Although there have been anumber <strong>of</strong> cases in which anodized aluminum oxidetemplates are used to synthesize nanorods, the main focushas been on the control <strong>of</strong> the shape and size <strong>of</strong> thenanorods, not on the formation <strong>of</strong> the array structure <strong>of</strong>nanorods [30–33]. In this regard, mesoporous thin filmtemplates appear to be advantageous because nanostructuredfilms <strong>with</strong> very fine features
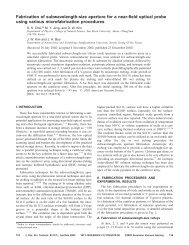
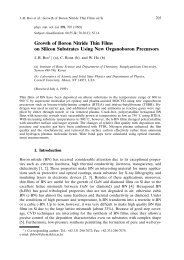
Plasmonics (2011) 6:715–723 717Fig. 1 Schematic drawing <strong>of</strong>the procedure to synthesizenanostructured <strong>Pt</strong> thin films byusing mesoporous silica thinfilms as templates. Thehorizontal channels <strong>of</strong> ~8 nmin diameter in SKU-5 areinterconnected by smallerchannels <strong>of</strong> ~1 nm in diameterenabling electrochemicaldepositionResults and DiscussionNanostructured <strong>Pt</strong> <strong>Films</strong>In this study, we used MSTFs as templates to fabricate <strong>Pt</strong>films <strong>with</strong> two different nanostructures and investigatedtheir effects on the SERS <strong>of</strong> Rh6G. The scheme <strong>of</strong> ourstudy is shown in Fig. 1. First, a MSTF is formed on asquare-cut <strong>Pt</strong>-coated Si wafer. The synthesis <strong>of</strong> MSTFs wasachieved by following the procedure our group hasdeveloped. By using precursor solutions <strong>with</strong> differentcompositions, the pore structure could be controlled. Thepore morphologies <strong>of</strong> the templates we used are arhombohedral derivative <strong>of</strong> the Im-3m cubic structure andthe P6mm 2D hexagonal structure, which are denoted asSKU-1 and -5 respectively, in our previous paper [34].Second, <strong>Pt</strong> was deposited into the pores <strong>of</strong> the MSTFtemplates by an electrochemical deposition technique. Theamount <strong>of</strong> deposited <strong>Pt</strong> was controlled by monitoring theamount <strong>of</strong> charge passed. We deposited 10, 20, 30, and40 mC for the two types <strong>of</strong> MSTF templates (the area <strong>of</strong>each <strong>Pt</strong> film was 1.0×1.0 cm 2 ). Finally, the MSTFtemplates were removed by etching <strong>with</strong> a HF solution toreveal the nanostructures <strong>of</strong> the <strong>Pt</strong> films.Figure 2 shows representative SEM images <strong>of</strong> the <strong>Pt</strong>nanostructured films so-obtained. As can be seen in theseFig. 2 SEM images <strong>of</strong> v-<strong>Pt</strong> andh-<strong>Pt</strong> films <strong>with</strong> differentamounts <strong>of</strong> <strong>Pt</strong>. The amount <strong>of</strong> <strong>Pt</strong>was controlled by measuring theamount <strong>of</strong> charge passed in theelectrochemical deposition. av-<strong>Pt</strong> <strong>with</strong> 10 mC/cm 2 , b v-<strong>Pt</strong><strong>with</strong> 40 mC/cm 2 , c h-<strong>Pt</strong> <strong>with</strong>10 mC/cm 2 , and d h-<strong>Pt</strong> <strong>with</strong>40 mC/cm 2 . Insets in b–d areenlarged views
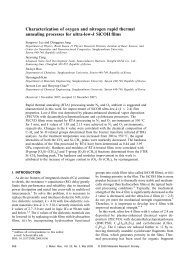
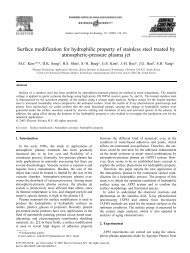
718 Plasmonics (2011) 6:715–723Fig. 3 Variation <strong>of</strong> the surfacearea <strong>of</strong> each type <strong>of</strong> nanostructured<strong>Pt</strong> films <strong>with</strong> the variation<strong>of</strong> the amount <strong>of</strong> deposited <strong>Pt</strong>images, our method is capable <strong>of</strong> forming nanostructuredfilms over a wide area and <strong>with</strong> a high degree <strong>of</strong> uniformity.Depending on the type <strong>of</strong> MSTF template, the nanorodshave different orientations. In case <strong>of</strong> using SKU-1 as thetemplate, the <strong>Pt</strong> nanorods are standing vertically to thesubstrate plane. When the amount <strong>of</strong> <strong>Pt</strong> is small, themorphology is best described as a nanodot array (Fig. 2a).Each nanodot has a diameter <strong>of</strong> 8 nm when viewed fromthe top and the dot-to-dot separation (the gap) is 3~4 nm.As the amount <strong>of</strong> <strong>Pt</strong> increases, the nanodots grow intovertically standing nanorods <strong>with</strong> the diameter and the gapsize practically unchanged (Fig. 2b). However, one can seethat long nanorods are bundled to some degree. In case <strong>of</strong>using SKU-5 as the template, long <strong>Pt</strong> nanorods are alignedhorizontally <strong>with</strong> respect to the substrate (Fig. 2c and d).The distance between the nanorods are 3~4 nm, the same asin the case <strong>of</strong> SKU-1 because the wall thicknesses <strong>of</strong> bothMSTF are the same. When the amount <strong>of</strong> <strong>Pt</strong> is small, many<strong>of</strong> the nanorods are segmented probably because theamount <strong>of</strong> <strong>Pt</strong> is not enough to fill up the first layer <strong>of</strong>pores <strong>of</strong> the SKU-5 template. As the amount <strong>of</strong> <strong>Pt</strong>increases, the pores <strong>of</strong> the template are filled up to producehorizontally aligned <strong>Pt</strong> nanorods. Hereafter, the <strong>Pt</strong> filmsfrom SKU-1 will be denoted as v-<strong>Pt</strong> (vertical <strong>Pt</strong>) and thosefrom SKU-5 as h-<strong>Pt</strong> (horizontal <strong>Pt</strong>).We measured the electrochemically active surfaceareas (EASs) <strong>of</strong> these <strong>Pt</strong> films by using an electrochemicalmethod. A cyclic voltammogram plot on a <strong>Pt</strong>electrode in an acidic aqueous solution shows peaks inthe potential range <strong>of</strong> −0.2~0.0 V (vs Ag/AgCl)associated <strong>with</strong> the H + adsorption and reduction. Theintegrated peak area has been used to estimate the EAS <strong>of</strong>the <strong>Pt</strong> electrode by using the reference value <strong>of</strong> 210 μC/cm 2 [40]. Figure 3 shows the variation <strong>of</strong> the EAS <strong>with</strong>ineach type <strong>of</strong> the nanostructures <strong>of</strong> <strong>Pt</strong> films <strong>with</strong> thevariation <strong>of</strong> the amount <strong>of</strong> deposited <strong>Pt</strong>. The ESAincreases proportionally <strong>with</strong> the amount <strong>of</strong> deposited <strong>Pt</strong>.The EASs are not strongly affected by the morphology<strong>with</strong>in the experimental errors.Raman SpectroscopyThe nanostructured <strong>Pt</strong> films were used to record SERS <strong>of</strong>Rh6G. We chose to use Rh6G because its SERS is knownFig. 4 The Raman spectra <strong>of</strong>Rh6G on v-<strong>Pt</strong> and h-<strong>Pt</strong> <strong>with</strong>various amounts <strong>of</strong> <strong>Pt</strong>. a v-<strong>Pt</strong>and b h-<strong>Pt</strong>. Note the scale in b isabout two times larger than thatin a
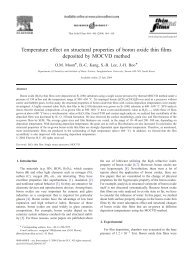
Plasmonics (2011) 6:715–723 719to have little contribution from CE mechanism [42].Therefore, any changes in SERS can be attributed to thestrength <strong>of</strong> the electromagnetic field <strong>of</strong> the substrate. Weused v-<strong>Pt</strong> and h-<strong>Pt</strong> films <strong>with</strong> various amounts <strong>of</strong> <strong>Pt</strong>. Theamount <strong>of</strong> Rh6G was controlled to be the same for eachmeasurement. The results are shown in Fig. 4. The spectraagree well <strong>with</strong> those in the literature on the SERS <strong>of</strong>Rh6G [43, 44].One can make two important observations from theSERS spectra: (1) <strong>with</strong>in a series <strong>of</strong> <strong>Pt</strong> morphology, theSERS intensity increases as the amount <strong>of</strong> <strong>Pt</strong> increases. (2)For a given amount <strong>of</strong> <strong>Pt</strong>, h-<strong>Pt</strong> produces a signal about twotimes stronger than v-<strong>Pt</strong>.The first observation appears to be related <strong>with</strong> the surfacearea <strong>of</strong> the <strong>Pt</strong> nanostructure. As the amount <strong>of</strong> <strong>Pt</strong> increases, thesurface area increases. The monolayer <strong>of</strong> Rh6G moleculesused in the SERS measurements would occupy about 0.3 cm 2 ,which is 3 to 30 times smaller than the EASs <strong>of</strong> the <strong>Pt</strong> films.Therefore, it seems plausible that the larger surface areas cangive better chances for the adsorbed molecules to be moreevenly spread to increase the SERS signals. This observationalso can be explained <strong>with</strong> the concept <strong>of</strong> hot spot. Becausethe nanorods are closely spaced <strong>with</strong> gaps <strong>of</strong> about 4 nm,one can expect that there are many hot spots in the gaps.Because the morphology does not change <strong>with</strong> the amount <strong>of</strong><strong>Pt</strong> deposited, the number <strong>of</strong> hot spots is expected to increase<strong>with</strong> the surface area, explaining the increase <strong>of</strong> the SERSintensity <strong>with</strong> the amount <strong>of</strong> <strong>Pt</strong> deposited.DDA SimulationsThe second observation <strong>of</strong> the effect <strong>of</strong> the nanostructure onthe SERS appears to be related <strong>with</strong> the orientation <strong>of</strong> thenanorods. In order to better explain this observation, weperformed simulation studies on the extinction spectra andelectromagnetic field distribution <strong>of</strong> various <strong>Pt</strong> nanostructuresrelated <strong>with</strong> the morphologies <strong>of</strong> v-<strong>Pt</strong> and h-<strong>Pt</strong> by using theDDA approximation. The excitation wavelength <strong>of</strong> 514 nmwas used. For the calculations, the propagation direction <strong>of</strong>excitation beam was set to be perpendicular to the substrates.The complex permittivity <strong>of</strong> <strong>Pt</strong> for the simulation wascalculated using the parameters in references [40, 41].Although the bulk values <strong>of</strong> permittivity may not beappropriate due to increased electron damping at the surface<strong>of</strong> particles <strong>with</strong> nano-size features [45], the DDA methodhas been reasonably successful in predicting their opticalspectra and local fields [46, 47]We first studied the effect <strong>of</strong> the array structure bycomparing a single <strong>Pt</strong> nanorod <strong>of</strong> 8 nm in diameter and60 nm in length and an array <strong>of</strong> such nanorods <strong>with</strong> 3 nmgaps between them. We considered two geometries related<strong>with</strong> the v-<strong>Pt</strong> and h-<strong>Pt</strong> morphologies. In the v-<strong>Pt</strong> relatedgeometry, the nanorods are vertically standing and theFig. 5 Simulated absorption spectra <strong>of</strong> a single <strong>Pt</strong> nanorod and anarray <strong>of</strong> <strong>Pt</strong> nanorods. a Vertically standing <strong>Pt</strong> nanorods, b horizontallylying <strong>Pt</strong> nanorods <strong>with</strong> transverse polarization, and c horizontallylying <strong>Pt</strong> nanorods <strong>with</strong> longitudinal polarization. The spectra in eachpanel are normalized to compare the spectral behaviors
720 Plasmonics (2011) 6:715–723Fig. 6 DDA results for v-<strong>Pt</strong> at514 nm (a, b, c) and model usedfor simulation (d). a is forY-polarized and b is Z-polarizedcase. The cut plane is X=0 for aand b, and c is XY plane <strong>of</strong> aexcitation beam direction is parallel to the long axis <strong>of</strong> thenanorod. In the other geometry, the nanorods are lyingparallel to the planes <strong>of</strong> view and the excitation beam isperpendicular to these planes.Fig. 7 DDA results for h-<strong>Pt</strong> at514 nm (a, b) and model usedfor simulation (c). a is forZ-polarized and b is Y-polarizedcases. The cut plane is located atthe center <strong>of</strong> cylinder
Plasmonics (2011) 6:715–723 721The SPR band <strong>of</strong> <strong>Pt</strong> is reported to be at 215 nm [48, 49].The simulated absorption spectrum <strong>of</strong> a single nanorod inthe vertical geometry reproduced such a behavior <strong>with</strong> anabsorption tail extended to the visible region (Fig. 5a). Thearray structure red-shifts the SPR band by about 50 nm.The SPR absorption <strong>of</strong> the horizontally aligned singlenanorod depends on the direction <strong>of</strong> polarization (Fig. 5band c). The absorption spectrum <strong>with</strong> the transversepolarization (where the electric field is perpendicular tothe rod axis) shows practically no difference from that <strong>of</strong>the vertically aligned single nanorod. In the longitudinalpolarization (where the electric field is parallel to the rodaxis) the single nanorod has a peak in the near IR regionat 800 nm. Interestingly, the array structure brings thepeak in the visible region <strong>with</strong> a peak at 540 nm whichwe believe is a higher order SPR mode. The visibleabsorption <strong>of</strong> the array structures are experimentallyverified in part by Kuroda’s group who observed thatan array <strong>of</strong> horizontally lying <strong>Pt</strong> nanowires has absorption inthe visible region [50].The simulated electromagnetic fields (|E| 2 ) <strong>with</strong> the514 nm excitation <strong>of</strong> the models for v-<strong>Pt</strong> and h-<strong>Pt</strong>nanostructures are shown in Figs. 6 and 7, respectively.As can be seen in these plots, the arrays <strong>of</strong> <strong>Pt</strong> nanorods cangenerate electromagnetic fields on visible excitation. On thecontrary, single <strong>Pt</strong> nanorods in the corresponding geometriesdo not show any field enhancement (data not shown).The two top view plots in the YZ-plane <strong>of</strong> v-<strong>Pt</strong>nanostructure in Figs. 6a and b are the distributions <strong>of</strong> |E| 2at the midpoint <strong>of</strong> the height <strong>of</strong> nanorods upon Y- and Z-polarizations. The maxima <strong>of</strong> |E| 2 appear at the edges <strong>of</strong> theplots, which are attributed to the artifacts arising from thesharp edges <strong>of</strong> the model nanorods. In order to avoid theartifacts, the local maxima near the centers <strong>of</strong> the plots aretaken as the representative values <strong>of</strong> maximum |E| 2 valueswhich are 20 and 15 for the Y- and Z-polarizations. Thesevalues indicate that the electromagnetic field enhancement<strong>of</strong> v-<strong>Pt</strong> is more or less constant regardless <strong>of</strong> thepolarization direction. The side view plot in Fig. 6c showsthe distribution <strong>of</strong> the electromagnetic field along thenanorods upon Z-polarization; the case <strong>of</strong> Y-polarization isnow shown because it is almost the same. Besides theartifact maximum |E| 2 <strong>of</strong> 28 at the ends <strong>of</strong> the nanorods, thedistribution is uniform along the length <strong>of</strong> nanorods.The distribution <strong>of</strong> |E| 2 <strong>of</strong> h-<strong>Pt</strong> is strongly dependent onthe polarization direction (Fig. 7). When the excitationbeam is polarized orthogonal to the direction <strong>of</strong> nanorods(Z-polarization), the distribution <strong>of</strong> |E| 2 is uniform along thelength <strong>of</strong> nanorods (Fig. 7a). The maximum |E| 2 is 23 and33 at around the center and at the ends <strong>of</strong> the nanorods,respectively. The latter may be due to the artifact <strong>of</strong> themodel. When the excitation beam is polarized along thedirection <strong>of</strong> nanorods (Y-polarization), electromagneticfields are accumulated at the edges and there is practicallyno field enhancement around the midpoints <strong>of</strong> the nanorods.The |E| 2 at the edges <strong>of</strong> the outermost nanorods is 72.This, however, may be due to the artifact. The nanorod inthe center shows maximum |E| 2 <strong>of</strong> 25 at the ends.Comparing the |E| 2 values <strong>of</strong> the two models, h-<strong>Pt</strong>produces stronger electromagnetic fields than v-<strong>Pt</strong> regardless<strong>of</strong> the polarization direction. Therefore, the strongerRaman intensity <strong>of</strong> Rh6G on h-<strong>Pt</strong> than v-<strong>Pt</strong> can beconcluded as the result <strong>of</strong> stronger electromagnetic fields<strong>of</strong> the former than the latter.ConclusionsIn this work, we synthesized nanostructured <strong>Pt</strong> thin films<strong>with</strong> two different morphologies and studied their effects onSERS <strong>of</strong> Rh6G. The synthesis method is cost efficient andthe resultant nanostructures have very fine features <strong>of</strong> 8 nmin diameter <strong>of</strong> nanorods and 3–4 nm in the gap sizebetween the nanorods, <strong>with</strong> which the <strong>Pt</strong> films can produceenhanced local electromagnetic fields. The SERS intensitywas larger <strong>with</strong> the horizontally lying <strong>Pt</strong> nanorods than thevertically standing ones. Simulations based on DDA showthat the array structures <strong>of</strong> <strong>Pt</strong> nanorods have red-shiftedSPR bands from those <strong>of</strong> single <strong>Pt</strong> nanorods for bothhorizontal and vertical geometries. The simulated electromagneticfield <strong>of</strong> the horizontally lying <strong>Pt</strong> nanorods isstronger than that <strong>of</strong> the vertically standing <strong>Pt</strong> nanorodsin good agreement <strong>with</strong> the observations. Because themesoporous thin films can have diverse features including thepore structure and the pore dimension (in the range <strong>of</strong> 2–10 nm), the template-assisted synthesis method in this studyhold many possibilities to be explored in the field <strong>of</strong> SERS.Acknowledgments This work was supported by grants NRF-20090081018 (Basic Science Research Program), NRF-2010-0060482 (Mid-career Researcher Program), NRF-2010-0029698(Priority Research Center Program), NRF-2010-0029699 (PriorityResearch Center Program), and NRF-2011-0006268 (Basic ScienceResearch Program). We thank KBSI and CCRF for the SEM andRaman data.References1. Aroca R (2006) Surface enhanced vibrational spectroscopy. Wiley,New York2. Qian X, Peng X-H, Ansari DO, Yin-Goen Q, Chen GZ, Shin DM,Yang L, Young AN, Wang MD, Nie S (2008) In vivo tumortargeting and spectroscopic detection <strong>with</strong> surface-enhancedRaman nanoparticle tags. Nat Biotechnol 26:83–903. Manimaran M, Jana NR (2007) Detection <strong>of</strong> protein molecules bysurface-enhanced Raman spectroscopy-based immunoassay using2–5 nm gold nanoparticle lables. Jn Raman Spectrosc 38:1326–1331
722 Plasmonics (2011) 6:715–7234. Dieringer JA, Wustholz KL, Masiello DJ, Camden JP, KleinmanSL, Schatz GC, Van Duyne RP (2009) Surface-enhanced Ramanexcitation spectroscopy <strong>of</strong> a single rhodamine 6G molecule. JnAm Chem Soc 131:849–8545. Sarkar S, Pande S, Jana S, Sinha AK, Pradhan M, Basu M, SahaS, Yusuf SM, Pal T (2009) Room temperature ferromagnetic Ninanocrystals: an efficient transition metal platform for manifestation<strong>of</strong> surface-enhanced Raman scattering. Jn Phys Chem C113:6022–60326. Roca M, Haes AJ (2008) Silica–void–gold nanoparticles: temporallystable surface-enhanced Raman scattering substrates. Jn AmChem Soc 130:14273–142797. Lombardi JR, Birke RL (2008) A unified approach to surfaceenhancedRaman spectroscopy. Jn Phys Chem C 112:5605–56178. Chang RK, Furtak TE (1982) Surface enhanced Raman scattering.Plenum, New York9. Campion A, Kambhampati P (1998) Surface-enhanced Ramanscattering. Chem Soc Rev 27:241–25010. Jiang J, Bosnick K, Maillard M, Brus L (2003) Single moleculeRaman spectroscopy at the junctions <strong>of</strong> large Ag nanocrystals. JnPhys Chem B 107:9964–997211. Leung L-H, Weaver MJ (1987) Extending surface-enhancedRaman spectroscopy to transition-metal surfaces: carbon monoxideadsorption and electrooxidation on platinum- and palladium-coatedgold electrodes. Jn Am Chem Soc 109:5113–511912. Park S, Yang P, Corredor P, Weaver MJ (2002) Transition metalcoatednanoparticle films: vibrational characterization <strong>with</strong>surface-enhanced Raman scattering. Jn Am Chem Soc124:2428–242913. Tian Z-Q, Ren B, Wu D-Y (2002) Surface-enhanced Ramanscattering: from noble to transition metals and from roughsurfaces to ordered nanostructures. J Phys Chem B 106:9463–948314. Abdelsalam ME, Mahajan S, Bartlett PN, Baumberg JJ, RussellAE (2007) SERS at structured palladium and platinum surfaces. JAm Chem Soc 129:7399–740615. Ikeda K, Sato J, Fujimoto N, Hayazawa N, Kawata S, Uosaki K(2009) Plasmonic enhancement <strong>of</strong> Raman scattering on non-SERS-active platinum substrates. J Phys Chem C 113:11816–1182116. Kim K, Kim KL, Lee HB, Shin KS (2010) Surface-enhancedRaman scattering on aggregates <strong>of</strong> platinum nanoparticles <strong>with</strong>definite size. J Phys Chem C 114:18679–1868517. Mahima S, Vijayamohana KP (2008) Shape-dependent electrocatalyticactivity <strong>of</strong> platinum nanostructures. J Mater Chem18:5858–587018. Chen A, Holt-Hindle P (2010) Platinum-based nanostructuredmaterials: synthesis, properties, and applications. Chem Rev110:3767–380419. Guerrini L, Lopez-Tobar E, Garcia-Ramos JV, Domingo C,Sanchez-Cortes S (2011) New insights on the Au core /<strong>Pt</strong> shellnanoparticle structure in the sub-monolayer range: SERS as asurface analyzing tool. Chem Commun 47:3174–317620. Marquestaut N, Martin A, Talaga D, Servant L, Ravaine S,Reculusa S, Bassani DM, Gillies E, Lagugne’-Labarthet F(2008) Raman enhancement <strong>of</strong> azobenzene monolayers onsubstrates prepared by Langmuir–Blodgett deposition andelectron-beam lithography techniques. Langmuir 24:11313–1132121. Kahl M, Voges E, Kostrewa S, Viets C, Hill W (1998) Periodicallystructured metallic substrates for SERS. Sensor Actuat B 51:285–29122. Gopinath A, Boriskina VS, Premasiri WR, Ziegler L, ReinhardMB, Dal Negro L (2009) Plasmonic nanogalaxies: multiscaleaperiodic arrays for surface-enhanced raman sensing. Nano Lett9:3922–392923. Tao A, Kim F, Hess C, Goldberger J, He R, Sun Y, Xia Y, Yang P(2003) Langmuir–Blodgett silver nanowire monolayers formolecular sensing using surface-enhanced Raman spectroscopy.Nano Lett 3:1229–123324. Mahmoud MA, Tabor CE, El-Sayed MA (2009) Surface-enhancedRaman scattering enhancement by aggregated silver nanocubemonolayers assembled by the Langmuir–Blodgett technique atdifferent surface pressures. Jn Phys Chem C 113:5493–550125. Jung HY, Park Y-K, Park S, Kim SK (2007) Surface enhancedRaman scattering from layered assemblies <strong>of</strong> close-packed goldnanoparticles. Anal Chim Acta 602:236–24326. Yun S, Oh MK, Kim SK, Park S (2009) Linker-molecule-free goldnanorod films: effect <strong>of</strong> nanorod size on surface enhanced Ramanscattering. Jn Phys Chem C 113:13551–1355727. Oh MK, Yun S, Kim SK, Park S (2009) Effect <strong>of</strong> layer structures<strong>of</strong> gold nanoparticle films on surface enhanced Raman scattering.Anal Chim Acta 649:111–11628. Lu Y, Amit L (2010) Vacuum-free self-powered parallel electronlithography <strong>with</strong> sub-35-nm resolution. Nano Lett 10:2197–220129. Lee K-R, Kwon Y-U (2010) Hard templates for fabrication <strong>of</strong>nanostructured films. NANO 5:75–87, references therein30. Sauer G, Brehm G, Schneider S, Graener H, Seifert G, Nielsch K,Choi J, Göring P, Gösele U, Miclea P, Wehrspohn RB (2006)Surface-enhanced Raman spectroscopy employing monodispersenickel nanowire arrays. Appl Phys Lett 88:02310631. Yao J-L, Tang J, Wu D-Y, Sun D-M, Xue K-H, Ren B, Mao B-W,Tian Z-Q (2002) Surface enhanced Raman scattering fromtransition metal nano-wire array and the theoretical consideration.Surf Sci 514:108–11632. Ruan C, Eres G, Wang W, Zhang Z, Gu B (2007) Controlledfabrication <strong>of</strong> nanopillar arrays as active substrates for surfaceenhancedRaman spectroscopy. Langmuir 23:5757–576033. Luo Z, Peng A, Fu H, Ma Y, Yao J, Loo BH (2008) Anapplication <strong>of</strong> AAO template: orderly assembled organicmolecules for surface-enhanced Raman scattering. Jn MaterChem 18:133–13834. U-H Lee, J-H Yang, H-J Lee, J-Y Park, K-R Lee, Y-U Kwon(2008) Facile and adaptable synthesis method <strong>of</strong> mesostructuredsilica thin films. J Mater Chem 18:1881–188835. U-H Lee, Lee JH, D-Y Jung, Y-U Kwon (2006) High densityarrays <strong>of</strong> platinum nanostructures and their hierarchical patterns.Adv Mater 18:2825–282836. Fukuoka A, Araki H, J-i Kimura, Sakamoto Y, Higuchi T,Sugimoto N, Inagaki S, Ichikawa M (2004) Template synthesis<strong>of</strong> nanoparticle arrays <strong>of</strong> gold, platinum and palladium inmesoporous silica films and powders. J Mater Chem 14:752–75637. H-J Lee, U-H Lee, J-Y Park, S-H Yoo, Park S, Y-U Kwon (2009)Platinum films <strong>with</strong> controlled 3-dimensional nanoscopicmorphologies and their effects on surface enhanced Ramanscattering. Chem-An Asian Jn 4:1284–128838. Draine BT, Flatau PJ (1994) Discrete dipole approximation forscattering calculations. Jn Opt Soc Am A 11:1491–149939. B. T. Draine, and P. J. Flatau, (2010), User guide to the discretedipole approximation code DDSCAT 7.1, http://arXiv.org/abs/1002.1505v1.40. Ung B, Sheng Y (2007) Interference <strong>of</strong> surface waves in ametallic nanoslit. Opt Express 15:1182–119041. Rakic AD, Djurišic AB, Elazar JM, Majewski ML (1998) Opticalproperties <strong>of</strong> metallic films for vertical-cavity optoelectronicdevices. Appl Optics 37:5271–528342. Clavilier J (1999) In: Wieckowski A (ed) Interfacial electrochemistry.Marcel Dekker, New York43. Jiang J, Bosnick K, Maillard M, Brus L (2003) Single moleculeRaman spectroscopy at the junctions <strong>of</strong> large Ag nanocrystals. JPhys Chem B 107:9964–9972
Plasmonics (2011) 6:715–723 72344. Hildebrandt P, Stockburger M (1984) Surface-enhanced resonanceRaman spectroscopy <strong>of</strong> rhodamine 6G adsorbed on colloidalsilver. J Phys Chem 88:5935–594445. Kreibig U (1974) Electronic properties <strong>of</strong> small silver particles:the optical constants and their temperature dependence. J Phys F4:999–101446. Hao E, Schatz GC (2004) Electromagnetic fields around silvernanoparticles and dimers. J Chem Phys 120:357–36647. Pinchuk O, Schatz GC (2008) Collective surface plasmon resonancecoupling in silver nanoshell arrays. Appl Phys B 93:31–3848. Link S, El-Sayed MA (1999) Spectral properties and relaxationdynamics <strong>of</strong> surface plasmon electronic oscillations ingold and silver nanodots and nanorods. Jn Phys Chem B103:8410–842649. Yu Y-Y, Chang S-S, Lee C-L, Wang CRC (1997) Gold nanorods—electrochemical synthesis and optical properties. Jn Phys Chem B101:6661–666450. Suzuki T, Miyata H, Noma T, Kuroda K (2008) Platinum thin filmconsisting <strong>of</strong> well-aligned nanowires and its optical behavior. JnPhys Chem C 112:1831–1836