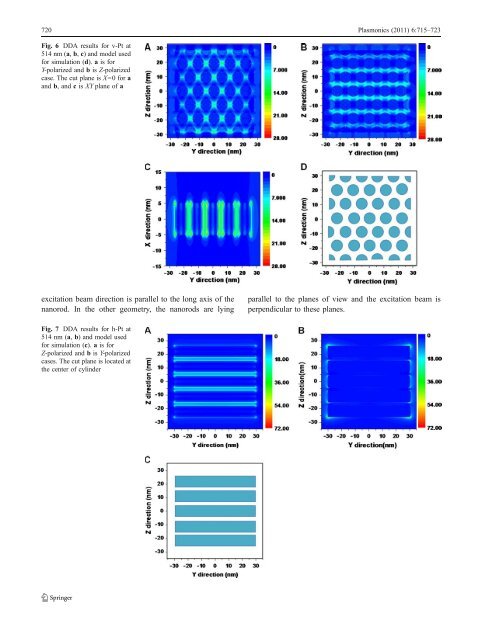
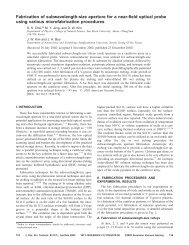
720 Plasmonics (2011) 6:715–723Fig. 6 DDA results for v-<strong>Pt</strong> at514 nm (a, b, c) and model usedfor simulation (d). a is forY-polarized and b is Z-polarizedcase. The cut plane is X=0 for aand b, and c is XY plane <strong>of</strong> aexcitation beam direction is parallel to the long axis <strong>of</strong> thenanorod. In the other geometry, the nanorods are lyingparallel to the planes <strong>of</strong> view and the excitation beam isperpendicular to these planes.Fig. 7 DDA results for h-<strong>Pt</strong> at514 nm (a, b) and model usedfor simulation (c). a is forZ-polarized and b is Y-polarizedcases. The cut plane is located atthe center <strong>of</strong> cylinder
Plasmonics (2011) 6:715–723 721The SPR band <strong>of</strong> <strong>Pt</strong> is reported to be at 215 nm [48, 49].The simulated absorption spectrum <strong>of</strong> a single nanorod inthe vertical geometry reproduced such a behavior <strong>with</strong> anabsorption tail extended to the visible region (Fig. 5a). Thearray structure red-shifts the SPR band by about 50 nm.The SPR absorption <strong>of</strong> the horizontally aligned singlenanorod depends on the direction <strong>of</strong> polarization (Fig. 5band c). The absorption spectrum <strong>with</strong> the transversepolarization (where the electric field is perpendicular tothe rod axis) shows practically no difference from that <strong>of</strong>the vertically aligned single nanorod. In the longitudinalpolarization (where the electric field is parallel to the rodaxis) the single nanorod has a peak in the near IR regionat 800 nm. Interestingly, the array structure brings thepeak in the visible region <strong>with</strong> a peak at 540 nm whichwe believe is a higher order SPR mode. The visibleabsorption <strong>of</strong> the array structures are experimentallyverified in part by Kuroda’s group who observed thatan array <strong>of</strong> horizontally lying <strong>Pt</strong> nanowires has absorption inthe visible region [50].The simulated electromagnetic fields (|E| 2 ) <strong>with</strong> the514 nm excitation <strong>of</strong> the models for v-<strong>Pt</strong> and h-<strong>Pt</strong>nanostructures are shown in Figs. 6 and 7, respectively.As can be seen in these plots, the arrays <strong>of</strong> <strong>Pt</strong> nanorods cangenerate electromagnetic fields on visible excitation. On thecontrary, single <strong>Pt</strong> nanorods in the corresponding geometriesdo not show any field enhancement (data not shown).The two top view plots in the YZ-plane <strong>of</strong> v-<strong>Pt</strong>nanostructure in Figs. 6a and b are the distributions <strong>of</strong> |E| 2at the midpoint <strong>of</strong> the height <strong>of</strong> nanorods upon Y- and Z-polarizations. The maxima <strong>of</strong> |E| 2 appear at the edges <strong>of</strong> theplots, which are attributed to the artifacts arising from thesharp edges <strong>of</strong> the model nanorods. In order to avoid theartifacts, the local maxima near the centers <strong>of</strong> the plots aretaken as the representative values <strong>of</strong> maximum |E| 2 valueswhich are 20 and 15 for the Y- and Z-polarizations. Thesevalues indicate that the electromagnetic field enhancement<strong>of</strong> v-<strong>Pt</strong> is more or less constant regardless <strong>of</strong> thepolarization direction. The side view plot in Fig. 6c showsthe distribution <strong>of</strong> the electromagnetic field along thenanorods upon Z-polarization; the case <strong>of</strong> Y-polarization isnow shown because it is almost the same. Besides theartifact maximum |E| 2 <strong>of</strong> 28 at the ends <strong>of</strong> the nanorods, thedistribution is uniform along the length <strong>of</strong> nanorods.The distribution <strong>of</strong> |E| 2 <strong>of</strong> h-<strong>Pt</strong> is strongly dependent onthe polarization direction (Fig. 7). When the excitationbeam is polarized orthogonal to the direction <strong>of</strong> nanorods(Z-polarization), the distribution <strong>of</strong> |E| 2 is uniform along thelength <strong>of</strong> nanorods (Fig. 7a). The maximum |E| 2 is 23 and33 at around the center and at the ends <strong>of</strong> the nanorods,respectively. The latter may be due to the artifact <strong>of</strong> themodel. When the excitation beam is polarized along thedirection <strong>of</strong> nanorods (Y-polarization), electromagneticfields are accumulated at the edges and there is practicallyno field enhancement around the midpoints <strong>of</strong> the nanorods.The |E| 2 at the edges <strong>of</strong> the outermost nanorods is 72.This, however, may be due to the artifact. The nanorod inthe center shows maximum |E| 2 <strong>of</strong> 25 at the ends.Comparing the |E| 2 values <strong>of</strong> the two models, h-<strong>Pt</strong>produces stronger electromagnetic fields than v-<strong>Pt</strong> regardless<strong>of</strong> the polarization direction. Therefore, the strongerRaman intensity <strong>of</strong> Rh6G on h-<strong>Pt</strong> than v-<strong>Pt</strong> can beconcluded as the result <strong>of</strong> stronger electromagnetic fields<strong>of</strong> the former than the latter.ConclusionsIn this work, we synthesized nanostructured <strong>Pt</strong> thin films<strong>with</strong> two different morphologies and studied their effects onSERS <strong>of</strong> Rh6G. The synthesis method is cost efficient andthe resultant nanostructures have very fine features <strong>of</strong> 8 nmin diameter <strong>of</strong> nanorods and 3–4 nm in the gap sizebetween the nanorods, <strong>with</strong> which the <strong>Pt</strong> films can produceenhanced local electromagnetic fields. The SERS intensitywas larger <strong>with</strong> the horizontally lying <strong>Pt</strong> nanorods than thevertically standing ones. Simulations based on DDA showthat the array structures <strong>of</strong> <strong>Pt</strong> nanorods have red-shiftedSPR bands from those <strong>of</strong> single <strong>Pt</strong> nanorods for bothhorizontal and vertical geometries. The simulated electromagneticfield <strong>of</strong> the horizontally lying <strong>Pt</strong> nanorods isstronger than that <strong>of</strong> the vertically standing <strong>Pt</strong> nanorodsin good agreement <strong>with</strong> the observations. Because themesoporous thin films can have diverse features including thepore structure and the pore dimension (in the range <strong>of</strong> 2–10 nm), the template-assisted synthesis method in this studyhold many possibilities to be explored in the field <strong>of</strong> SERS.Acknowledgments This work was supported by grants NRF-20090081018 (Basic Science Research Program), NRF-2010-0060482 (Mid-career Researcher Program), NRF-2010-0029698(Priority Research Center Program), NRF-2010-0029699 (PriorityResearch Center Program), and NRF-2011-0006268 (Basic ScienceResearch Program). We thank KBSI and CCRF for the SEM andRaman data.References1. Aroca R (2006) Surface enhanced vibrational spectroscopy. Wiley,New York2. Qian X, Peng X-H, Ansari DO, Yin-Goen Q, Chen GZ, Shin DM,Yang L, Young AN, Wang MD, Nie S (2008) In vivo tumortargeting and spectroscopic detection <strong>with</strong> surface-enhancedRaman nanoparticle tags. Nat Biotechnol 26:83–903. Manimaran M, Jana NR (2007) Detection <strong>of</strong> protein molecules bysurface-enhanced Raman spectroscopy-based immunoassay using2–5 nm gold nanoparticle lables. Jn Raman Spectrosc 38:1326–1331