improved fallow systems in the luang prabang area, lao pdr - Afaci
improved fallow systems in the luang prabang area, lao pdr - Afaci
improved fallow systems in the luang prabang area, lao pdr - Afaci

Create successful ePaper yourself
Turn your PDF publications into a flip-book with our unique Google optimized e-Paper software.
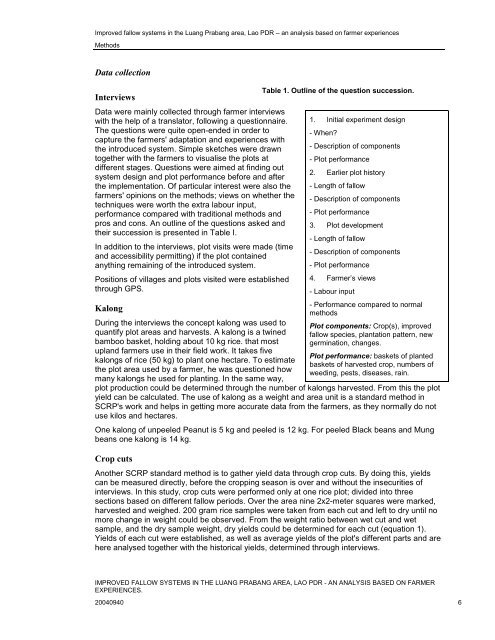
Improved <strong>fallow</strong> <strong>systems</strong> <strong>in</strong> <strong>the</strong> Luang Prabang <strong>area</strong>, Lao PDR – an analysis based on farmer experiencesMethodsData collectionInterviewsData were ma<strong>in</strong>ly collected through farmer <strong>in</strong>terviewswith <strong>the</strong> help of a translator, follow<strong>in</strong>g a questionnaire.The questions were quite open-ended <strong>in</strong> order tocapture <strong>the</strong> farmers' adaptation and experiences with<strong>the</strong> <strong>in</strong>troduced system. Simple sketches were drawntoge<strong>the</strong>r with <strong>the</strong> farmers to visualise <strong>the</strong> plots atdifferent stages. Questions were aimed at f<strong>in</strong>d<strong>in</strong>g outsystem design and plot performance before and after<strong>the</strong> implementation. Of particular <strong>in</strong>terest were also <strong>the</strong>farmers' op<strong>in</strong>ions on <strong>the</strong> methods; views on whe<strong>the</strong>r <strong>the</strong>techniques were worth <strong>the</strong> extra labour <strong>in</strong>put,performance compared with traditional methods andpros and cons. An outl<strong>in</strong>e of <strong>the</strong> questions asked and<strong>the</strong>ir succession is presented <strong>in</strong> Table I.In addition to <strong>the</strong> <strong>in</strong>terviews, plot visits were made (timeand accessibility permitt<strong>in</strong>g) if <strong>the</strong> plot conta<strong>in</strong>edanyth<strong>in</strong>g rema<strong>in</strong><strong>in</strong>g of <strong>the</strong> <strong>in</strong>troduced system.Positions of villages and plots visited were establishedthrough GPS.KalongDur<strong>in</strong>g <strong>the</strong> <strong>in</strong>terviews <strong>the</strong> concept kalong was used toquantify plot <strong>area</strong>s and harvests. A kalong is a tw<strong>in</strong>edbamboo basket, hold<strong>in</strong>g about 10 kg rice. that mostupland farmers use <strong>in</strong> <strong>the</strong>ir field work. It takes fivekalongs of rice (50 kg) to plant one hectare. To estimate<strong>the</strong> plot <strong>area</strong> used by a farmer, he was questioned howmany kalongs he used for plant<strong>in</strong>g. In <strong>the</strong> same way,plot production could be determ<strong>in</strong>ed through <strong>the</strong> number of kalongs harvested. From this <strong>the</strong> plotyield can be calculated. The use of kalong as a weight and <strong>area</strong> unit is a standard method <strong>in</strong>SCRP's work and helps <strong>in</strong> gett<strong>in</strong>g more accurate data from <strong>the</strong> farmers, as <strong>the</strong>y normally do notuse kilos and hectares.One kalong of unpeeled Peanut is 5 kg and peeled is 12 kg. For peeled Black beans and Mungbeans one kalong is 14 kg.Crop cutsTable 1. Outl<strong>in</strong>e of <strong>the</strong> question succession.1. Initial experiment design- When?- Description of components- Plot performance2. Earlier plot history- Length of <strong>fallow</strong>- Description of components- Plot performance3. Plot development- Length of <strong>fallow</strong>- Description of components- Plot performance4. Farmer’s views- Labour <strong>in</strong>put- Performance compared to normalmethodsPlot components: Crop(s), <strong>improved</strong><strong>fallow</strong> species, plantation pattern, newgerm<strong>in</strong>ation, changes.Plot performance: baskets of plantedbaskets of harvested crop, numbers ofweed<strong>in</strong>g, pests, diseases, ra<strong>in</strong>.Ano<strong>the</strong>r SCRP standard method is to ga<strong>the</strong>r yield data through crop cuts. By do<strong>in</strong>g this, yieldscan be measured directly, before <strong>the</strong> cropp<strong>in</strong>g season is over and without <strong>the</strong> <strong>in</strong>securities of<strong>in</strong>terviews. In this study, crop cuts were performed only at one rice plot; divided <strong>in</strong>to threesections based on different <strong>fallow</strong> periods. Over <strong>the</strong> <strong>area</strong> n<strong>in</strong>e 2x2-meter squares were marked,harvested and weighed. 200 gram rice samples were taken from each cut and left to dry until nomore change <strong>in</strong> weight could be observed. From <strong>the</strong> weight ratio between wet cut and wetsample, and <strong>the</strong> dry sample weight, dry yields could be determ<strong>in</strong>ed for each cut (equation 1).Yields of each cut were established, as well as average yields of <strong>the</strong> plot's different parts and arehere analysed toge<strong>the</strong>r with <strong>the</strong> historical yields, determ<strong>in</strong>ed through <strong>in</strong>terviews.IMPROVED FALLOW SYSTEMS IN THE LUANG PRABANG AREA, LAO PDR - AN ANALYSIS BASED ON FARMEREXPERIENCES.20040940 6