

World Journal of Radiology - World Journal of Gastroenterology
World Journal of Radiology - World Journal of Gastroenterology
World Journal of Radiology - World Journal of Gastroenterology

Create successful ePaper yourself
Turn your PDF publications into a flip-book with our unique Google optimized e-Paper software.
W J R<br />
<strong>World</strong> <strong>Journal</strong> <strong>of</strong><br />
<strong>Radiology</strong><br />
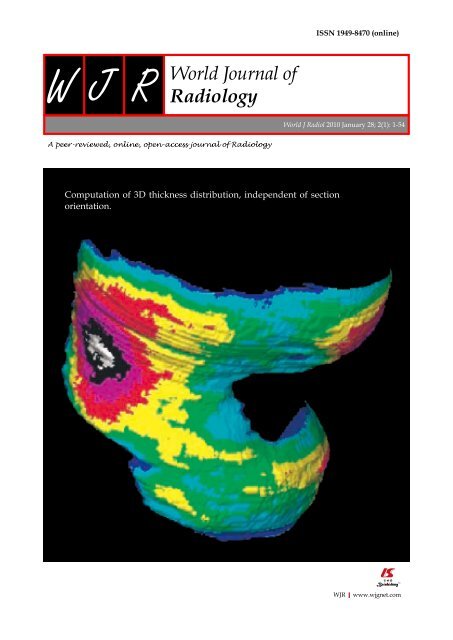
Computation <strong>of</strong> 3D thickness distribution, independent <strong>of</strong> section<br />
orientation.<br />
ISSN 1949-8470 (online)<br />
<strong>World</strong> J Radiol 2010 January 28; 2(1): 1-54<br />
WJR|www.wjgnet.com
W J R<br />
PRESIDENT AND EDITOR-IN-<br />
CHIEF<br />
Lian-Sheng Ma, Beijing<br />
STRATEGY ASSOCIATE<br />
EDITORS-IN-CHIEF<br />
Ritesh Agarwal, Chandigarh<br />
Kenneth Coenegrachts, Bruges<br />
Meng Law, Lost Angeles<br />
Ewald Moser, Vienna<br />
Aytekin Oto, Chicago<br />
AAK Abdel Razek, Mansoura<br />
Àlex Rovira, Barcelona<br />
Yi-Xiang Wang, Hong Kong<br />
Hui-Xiong Xu, Guangzhou<br />
GUEST EDITORIAL BOARD<br />
MEMBERS<br />
Wing P Chan, Taipei<br />
Wen-Chen Huang, Taipei<br />
Shi-Long Lian, Kaohsiung<br />
Chao-Bao Luo, Taipei<br />
Shu-Hang Ng, Taoyuan<br />
Pao-Sheng Yen, Haulien<br />
MEMBERS OF THE EDITORIAL<br />
BOARD<br />
Australia<br />
Karol Miller, Perth<br />
Tomas Kron, Melbourne<br />
Zhonghua Sun, Perth<br />
Austria<br />
Herwig R Cerwenka, Graz<br />
Editorial Board<br />
2009-2013<br />
The <strong>World</strong> <strong>Journal</strong> <strong>of</strong> <strong>Radiology</strong> Editorial Board consists <strong>of</strong> 304 members, representing a team <strong>of</strong> worldwide experts<br />
in radiology. They are from 38 countries, including Australia (3), Austria (4), Belgium (4), Brazil (2), Canada (9),<br />
Chile (1), China (23), Denmark (1), Egypt (4), Estonia (1), Finland (1), France (6), Germany (17), Greece (8), Hungary<br />
(1), India (9), Iran (5), Ireland (1), Israel (4), Italy (28), Japan (14), Lebanon (1), Libya (1), Malaysia (2), Mexico (1),<br />
Netherlands (4), New Zealand (1), Norway (1), Saudi Arabia (3), Serbia (1), Singapore (2), Slovakia (1), South Korea<br />
(16), Spain (8), Switzerland (5), Turkey (20), United Kingdom (15), and United States (76).<br />
百世登<br />
Baishideng TM© December<br />
WJR|www.wjgnet.com<br />
<strong>World</strong> <strong>Journal</strong> <strong>of</strong><br />
<strong>Radiology</strong><br />
Daniela Prayer,Vienna<br />
Siegfried Trattnig, Vienna<br />
Belgium<br />
Piet R Dirix, Leuven<br />
Yicheng Ni, Leuven<br />
Piet Vanhoenacker, Aalst<br />
Brazil<br />
Emerson L Gasparetto, Rio de Janeiro<br />
Wellington P Martins, São Paulo<br />
Canada<br />
Sriharsha Athreya, Hamilton<br />
Mark Otto Baerlocher, Toronto<br />
Martin Charron, Toronto<br />
James Chow, Toronto<br />
John Martin Kirby, Hamilton<br />
Piyush Kumar, Edmonton<br />
Catherine Limperpoulos, Quebec<br />
Ernest K Osei, Kitchener<br />
Weiguang Yao, Sudbury<br />
Chile<br />
Masami Yamamoto, Santiago<br />
China<br />
Feng Chen, Nanjing<br />
Guo-Guang Fan, Shenyang<br />
I<br />
Shen Fu, Shanghai<br />
Gang Jin, Beijing<br />
Tak Yeung Leung, Hong Kong<br />
Wen-Bin Li, Shanghai<br />
Rico Liu, Hong Kong<br />
Yi-Yao Liu, Chengdu<br />
Wei Lu, Guangdong<br />
Fu-Hua Peng, Guangzhou<br />
Li-Jun Wu, Hefei<br />
Zhi-Gang Yang, Chengdu<br />
Xiao-Ming Zhang, Nanchong<br />
Chun-Jiu Zhong, Shanghai<br />
Denmark<br />
Poul Erik Andersen, Odense<br />
Egypt<br />
Mohamed Abou El-Ghar, Mansoura<br />
Mohamed Ragab Nouh, Alexandria<br />
Ahmed A Shokeir, Mansoura<br />
Estonia<br />
Tiina Talvik, Tartu<br />
Finland<br />
Tove J Grönroos, Turku<br />
France<br />
Alain Chapel, Fontenay-Aux-Roses<br />
31, 2009
Youlia M Kirova, Paris<br />
Géraldine Le Duc, Grenoble Cedex<br />
Laurent Pierot, Reims<br />
Frank Pilleul, Lyon<br />
Pascal Pommier, Lyon<br />
Germany<br />
Ambros J Beer, München<br />
Thomas Deserno, Aachen<br />
Frederik L Giesel, Heidelberg<br />
Ulf Jensen, Kiel<br />
Markus Sebastian Juchems, Ulm<br />
Kai U Juergens, Bremen<br />
Melanie Kettering, Jena<br />
Jennifer Linn, Munich<br />
Christian Lohrmann, Freiburg<br />
David Maintz, Münster<br />
Henrik J Michaely, Mannheim<br />
Oliver Micke, Bielefeld<br />
Thoralf Niendorf, Berlin-Buch<br />
Silvia Obenauer, Duesseldorf<br />
Steffen Rickes, Halberstadt<br />
Lars V Baron von Engelhardt, Bochum<br />
Goetz H Welsch, Erlangen<br />
Greece<br />
Panagiotis Antoniou, Alexandroupolis<br />
George C Kagadis, Rion<br />
Dimitris Karacostas, Thessaloniki<br />
George Panayiotakis, Patras<br />
Alexander D Rapidis, Athens<br />
Ioannis Tsalafoutas, Athens<br />
Virginia Tsapaki, Anixi<br />
Ioannis Valais, Athens<br />
Hungary<br />
Peter Laszlo Lakatos, Budapest<br />
India<br />
Anil Kumar Anand, New Delhi<br />
Surendra Babu, Tamilnadu<br />
Sandip Basu, Bombay<br />
Kundan Singh Chufal, New Delhi<br />
Shivanand Gamanagatti, New Delhi<br />
Vimoj J Nair, Haryana<br />
R Prabhakar, New Delhi<br />
Sanjeeb Kumar Sahoo, Orissa<br />
Iran<br />
Vahid Reza Dabbagh Kakhki, Mashhad<br />
Mehran Karimi, Shiraz<br />
Farideh Nejat, Tehran<br />
Alireza Shirazi, Tehran<br />
Hadi Rokni Yazdi, Tehran<br />
Ireland<br />
Joseph Simon Butler, Dublin<br />
百世登<br />
Israel<br />
Amit Gefen, Tel Aviv<br />
Eyal Sheiner, Be’er-Sheva<br />
Jacob Sosna, Jerusalem<br />
Simcha Yagel, Jerusalem<br />
Italy<br />
Mohssen Ansarin, Milan<br />
Stefano Arcangeli, Rome<br />
Tommaso Bartalena, Imola<br />
Filippo Cademartiri, Parma<br />
Sergio Casciaro, Lecce<br />
Laura Crocetti, Pisa<br />
Alberto Cuocolo, Napoli<br />
Mirko D’On<strong>of</strong>rio, Verona<br />
Massimo Filippi, Milan<br />
Claudio Fiorino, Milano<br />
Alessandro Franchello, Turin<br />
Roberto Grassi, Naples<br />
Stefano Guerriero, Cagliari<br />
Francesco Lassandro, Napoli<br />
Nicola Limbucci, L'Aquila<br />
Raffaele Lodi, Bologna<br />
Francesca Maccioni, Rome<br />
Laura Martincich, Candiolo<br />
Mario Mascalchi, Florence<br />
Roberto Miraglia, Palermo<br />
Eugenio Picano, Pisa<br />
Antonio Pinto, Naples<br />
Stefania Romano, Naples<br />
Luca Saba, Cagliari<br />
Sergio Sartori, Ferrara<br />
Mariano Scaglione, Castel Volturno<br />
Lidia Strigari, Rome<br />
Vincenzo Valentini, Rome<br />
Japan<br />
Shigeru Ehara, Morioka<br />
Nobuyuki Hamada, Chiba<br />
Takao Hiraki, Okayama<br />
Akio Hiwatashi, Fukuoka<br />
Masahiro Jinzaki, Tokyo<br />
Hiroshi Matsuda, Saitama<br />
Yasunori Minami, Osaka<br />
Jun-Ichi Nishizawa, Tokyo<br />
Tetsu Niwa, Yokohama<br />
Kazushi Numata, Kanagawa<br />
Kazuhiko Ogawa, Okinawa<br />
Hitoshi Shibuya, Tokyo<br />
Akira Uchino, Saitama<br />
Haiquan Yang, Kanagawa<br />
Lebanon<br />
Aghiad Al-Kutoubi, Beirut<br />
Libya<br />
Anuj Mishra, Tripoli<br />
Malaysia<br />
R Logeswaran, Cyberjaya<br />
Kwan-Hoong Ng, Kuala Lumpur<br />
TM©<br />
Baishideng WJR|www.wjgnet.com<br />
II<br />
December<br />
Mexico<br />
Heriberto Medina-Franco, Mexico City<br />
Netherlands<br />
Jurgen J Fütterer, Nijmegen<br />
Raffaella Rossin, Eindhoven<br />
Paul E Sijens, Groningen<br />
Willem Jan van Rooij, Tilburg<br />
New Zealand<br />
W Howell Round, Hamilton<br />
Norway<br />
Arne Sigmund Borthne, Lørenskog<br />
Saudi Arabia<br />
Mohammed Al-Omran, Riyadh<br />
Ragab Hani Donkol, Abha<br />
Volker Rudat, Al Khobar<br />
Serbia<br />
Djordjije Saranovic, Belgrade<br />
Singapore<br />
Uei Pua, Singapore<br />
Lim CC Tchoyoson, Singapore<br />
Slovakia<br />
František Dubecký, Bratislava<br />
South Korea<br />
Bo-Young Choe, Seoul<br />
Joon Koo Han, Seoul<br />
Seung Jae Huh, Seoul<br />
Chan Kyo Kim, Seoul<br />
Myeong-Jin Kim, Seoul<br />
Seung Hyup Kim, Seoul<br />
Kyoung Ho Lee, Gyeonggi-do<br />
Won-Jin Moon, Seoul<br />
Wazir Muhammad, Daegu<br />
Jai Soung Park, Bucheon<br />
Noh Hyuck Park, Kyunggi<br />
Sang-Hyun Park, Daejeon<br />
Joon Beom Seo, Seoul<br />
Ji-Hoon Shin, Seoul<br />
Jin-Suck Suh, Seoul<br />
Hong-Gyun Wu, Seoul<br />
Spain<br />
Eduardo J Aguilar, Valencia<br />
31, 2009
Miguel Alcaraz, Murcia<br />
Juan Luis Alcazar, Pamplona<br />
Gorka Bastarrika, Pamplona<br />
Rafael Martínez-Monge, Pamplona<br />
Alberto Muñoz, Madrid<br />
Joan C Vilanova, Girona<br />
百世登<br />
Switzerland<br />
Nicolau Beckmann, Basel<br />
Silke Grabherr, Lausanne<br />
Karl-Ol<strong>of</strong> Lövblad, Geneva<br />
Tilo Niemann, Basel<br />
Martin A Walter, Basel<br />
Turkey<br />
Olus Api, Istanbul<br />
Kubilay Aydin, İstanbul<br />
Işıl Bilgen, Izmir<br />
Zulkif Bozgeyik, Elazig<br />
Barbaros E Çil, Ankara<br />
Gulgun Engin, Istanbul<br />
M Fatih Evcimik, Malatya<br />
Ahmet Kaan Gündüz, Ankara<br />
Tayfun Hakan, Istanbul<br />
Adnan Kabaalioglu, Antalya<br />
Fehmi Kaçmaz, Ankara<br />
Musturay Karcaaltincaba, Ankara<br />
Osman Kizilkilic, Istanbul<br />
Zafer Koc, Adana<br />
Cem Onal, Adana<br />
Yahya Paksoy, Konya<br />
Bunyamin Sahin, Samsun<br />
Ercument Unlu, Edirne<br />
Ahmet Tuncay Turgut, Ankara<br />
Ender Uysal, Istanbul<br />
United Kingdom<br />
K Faulkner, Wallsend<br />
Peter Gaines, Sheffield<br />
Balaji Ganeshan, Brighton<br />
Nagy Habib, London<br />
Alan Jackson, Manchester<br />
Pradesh Kumar, Portsmouth<br />
Tarik F Massoud, Cambridge<br />
Igor Meglinski, Bedfordshire<br />
Ian Negus, Bristol<br />
Georgios A Plataniotis, Aberdeen<br />
N J Raine-Fenning, Nottingham<br />
Manuchehr Soleimani, Bath<br />
MY Tseng, Nottingham<br />
Edwin JR van Beek, Edinburgh<br />
Feng Wu, Oxford<br />
United States<br />
Athanassios Argiris, Pittsburgh<br />
Stephen R Baker, Newark<br />
Lia Bartella, New York<br />
Charles Bellows, New Orleans<br />
Walter L Biffl, Denver<br />
Homer S Black, Houston<br />
Wessam Bou-Assaly, Ann Arbor<br />
Owen Carmichael, Davis<br />
Shelton D Caruthers, St Louis<br />
Yuhchyau Chen, Rochester<br />
Melvin E Clouse, Boston<br />
Ezra Eddy Wyssam Cohen, Chicago<br />
Aaron Cohen-Gadol, Indianapolis<br />
Patrick M Colletti, Los Angeles<br />
Kassa Darge, Philadelphia<br />
Abhijit P Datir, Miami<br />
Delia C DeBuc, Miami<br />
Russell L Deter, Houston<br />
Adam P Dicker, Phil<br />
Khaled M Elsayes, Ann Arbor<br />
Steven Feigenberg, Baltimore<br />
Christopher G Filippi, Burlington<br />
Victor Frenkel, Bethesda<br />
Thomas J George Jr, Gainesville<br />
Patrick K Ha, Baltimore<br />
Robert I Haddad, Boston<br />
Walter A Hall, Syracuse<br />
Mary S Hammes, Chicago<br />
John Hart Jr, Dallas<br />
TM©<br />
Baishideng WJR|www.wjgnet.com<br />
III<br />
December<br />
Randall T Higashida, San Francisco<br />
Juebin Huang, Jackson<br />
Andrei Iagaru, Stanford<br />
Craig Johnson, Milwaukee<br />
Ella F Jones, San Francisco<br />
Csaba Juhasz, Detroit<br />
Mannudeep K Kalra, Boston<br />
Riyad Karmy-Jones, Vancouver<br />
Daniel J Kelley, Madison<br />
Amir Khan, Longview<br />
Vikas Kundra, Houston<br />
Kennith F Layton, Dallas<br />
Rui Liao, Princeton<br />
CM Charlie Ma, Philadelphia<br />
Nina A Mayr, Columbus<br />
Thomas J Meade, Evanston<br />
Steven R Messé, Philadelphia<br />
Feroze B Mohamed, Philadelphia<br />
Koenraad J Mortele, Boston<br />
Mohan Natarajan, San Antonio<br />
John L Nosher, New Brunswick<br />
Chong-Xian Pan, Sacramento<br />
Dipanjan Pan, St Louis<br />
Martin R Prince, New York<br />
Reza Rahbar, Boston<br />
Carlos S Restrepo, San Antonio<br />
Veronica Rooks, Honolulu<br />
Maythem Saeed, San Francisco<br />
Edgar A Samaniego, Palo Alto<br />
Jason P Sheehan, Charlottesville<br />
William P Sheehan, Willmar<br />
Charles Jeffrey Smith, Columbia<br />
Dan Stoianovici, Baltimore<br />
Dian Wang, Milwaukee<br />
Jian Z Wang, Columbus<br />
Liang Wang, New York<br />
Shougang Wang, Santa Clara<br />
Wenbao Wang, New York<br />
Aaron H Wolfson, Miami<br />
Ying Xiao, Philadelphia<br />
Juan Xu, Pittsburgh<br />
Benjamin M Yeh, San Francisco<br />
Terry T Yoshizumi, Durham<br />
Jinxing Yu, Richmond<br />
Jianhui Zhong, Rochester<br />
31, 2009
W J R<br />
Contents<br />
EDITORIAL<br />
TOPIC HIGHLIGHT<br />
OBSERVATION<br />
GUIDELINES FOR<br />
CLINICAL PRACTICE<br />
REVIEW<br />
<strong>World</strong> <strong>Journal</strong> <strong>of</strong><br />
<strong>Radiology</strong><br />
1 Reperfusion injury components and manifestations determined by<br />
cardiovascular MR and MDCT imaging<br />
Saeed M, Hetts S, Wilson M<br />
15 Contrast enhanced ultrasound <strong>of</strong> renal masses<br />
Ignee A, Straub B, Schuessler G, Dietrich CF<br />
32 Diagnosis <strong>of</strong> liver cirrhosis with contrast-enhanced ultrasound<br />
Liu GJ, Lu MD<br />
37 Ultra-high-field magnetic resonance: Why and when?<br />
Moser E<br />
41 High attenuation mucoid impaction in allergic bronchopulmonary aspergillosis<br />
Agarwal R<br />
44 Non-invasive MRI assessment <strong>of</strong> the articular cartilage in clinical studies and<br />
experimental settings<br />
Wang YXJ, Griffith JF, Ahuja AT<br />
百世登<br />
Baishideng TM© WJR|www.wjgnet.com<br />
I<br />
Monthly Volume 2 Number 1 January 28, 2010<br />
January 28, 2010|Volume 2|Issue 1|
Contents<br />
ACKNOWLEDGMENTS<br />
APPENDIX<br />
ABOUT COVER<br />
AIM AND SCOPE<br />
FLYLEAF<br />
EDITORS FOR<br />
THIS ISSUE<br />
NAME OF JOURNAL<br />
<strong>World</strong> <strong>Journal</strong> <strong>of</strong> <strong>Radiology</strong><br />
LAUNCH DATE<br />
December 31, 2009<br />
SPONSOR<br />
Beijing Baishideng BioMed Scientific Co., Ltd.,<br />
Room 903, Building D, Ocean International Center,<br />
No. 62 Dongsihuan Zhonglu, Chaoyang District,<br />
Beijing 100025, China<br />
Telephone: 0086-10-8538-1892<br />
Fax: 0086-10-8538-1893<br />
E-mail: baishideng@wjgnet.com<br />
http://www.wjgnet.com<br />
EDITING<br />
Editorial Board <strong>of</strong> <strong>World</strong> <strong>Journal</strong> <strong>of</strong> <strong>Radiology</strong>,<br />
Room 903, Building D, Ocean International Center,<br />
No. 62 Dongsihuan Zhonglu, Chaoyang District,<br />
Beijing 100025, China<br />
Telephone: 0086-10-5908-0036<br />
Fax: 0086-10-8538-1893<br />
E-mail: wjr@wjgnet.com<br />
http://www.wjgnet.com<br />
PUBLISHING<br />
Beijing Baishideng BioMed Scientific Co., Ltd.,<br />
Room 903, Building D, Ocean International Center,<br />
No. 62 Dongsihuan Zhonglu, Chaoyang District,<br />
Beijing 100025, China<br />
Telephone: 0086-10-8538-1892<br />
Fax: 0086-10-8538-1893<br />
E-mail: baishideng@wjgnet.com<br />
http://www.wjgnet.com<br />
百世登<br />
Baishideng TM©<br />
WJR|www.wjgnet.com<br />
<strong>World</strong> <strong>Journal</strong> <strong>of</strong> <strong>Radiology</strong><br />
Volume 2 Number 1 January 28, 2010<br />
I Acknowledgments to reviewers <strong>of</strong> <strong>World</strong> <strong>Journal</strong> <strong>of</strong> <strong>Radiology</strong><br />
I Meetings<br />
I-V Instructions to authors<br />
Wang YXJ, Griffith JF, Ahuja AT.<br />
Non-invasive MRI assessment <strong>of</strong> the articular cartilage in clinical studies and<br />
experimental settings.<br />
<strong>World</strong> J Radiol 2010; 2(1): 44-54<br />
http://www.wjgnet.com/1949-8470/full/v2/i1/44.htm<br />
<strong>World</strong> <strong>Journal</strong> <strong>of</strong> <strong>Radiology</strong> (<strong>World</strong> J Radiol, WJR, online ISSN 1949-8470, DOI: 10.4329) is<br />
a monthly peer-reviewed, online, open-access, journal supported by an editorial board<br />
consisting <strong>of</strong> 304 experts in radiology from 38 countries.<br />
The major task <strong>of</strong> WJR is to rapidly report the most recent improvement in the<br />
research <strong>of</strong> medical imaging and radiation therapy by the radiologists. WJR accepts<br />
papers on the following aspects related to radiology: Abdominal radiology, women<br />
health radiology, cardiovascular radiology, chest radiology, genitourinary radiology,<br />
neuroradiology, head and neck radiology, interventional radiology, musculoskeletal<br />
radiology, molecular imaging, pediatric radiology, experimental radiology, radiological<br />
technology, nuclear medicine, PACS and radiology informatics, and ultrasound. We also<br />
encourage papers that cover all other areas <strong>of</strong> radiology as well as basic research.<br />
I-III Editorial Board<br />
Responsible Assistant Editor: Na Liu Responsible Science Editor: Jian-Xia Cheng<br />
Responsible Electronic Editor: Xiao-Mei Zheng<br />
Pro<strong>of</strong>ing Editor-in-Chief: Lian-Sheng Ma<br />
SUBSCRIPTION<br />
Beijing Baishideng BioMed Scientific Co., Ltd.,<br />
Room 903, Building D, Ocean International Center,<br />
No. 62 Dongsihuan Zhonglu, Chaoyang District,<br />
Beijing 100025, China<br />
Telephone: 0086-10-8538-1892<br />
Fax: 0086-10-8538-1893<br />
E-mail: baishideng@wjgnet.com<br />
http://www.wjgnet.com<br />
ONLINE SUBSCRIPTION<br />
One-Year Price 216.00 USD<br />
PUBLICATION DATE<br />
January 28, 2010<br />
CSSN<br />
ISSN 1949-8470 (online)<br />
PRESIDENT AND EDITOR-IN-CHIEF<br />
Lian-Sheng Ma, Beijing<br />
STRATEGY ASSOCIATE EDITORS-IN-CHIEF<br />
Ritesh Agarwal, Chandigarh<br />
Kenneth Coenegrachts, Bruges<br />
Adnan Kabaalioglu, Antalya<br />
Meng Law, Lost Angeles<br />
Ewald Moser, Vienna<br />
Aytekin Oto, Chicago<br />
AAK Abdel Razek, Mansoura<br />
Àlex Rovira, Barcelona<br />
Yi-Xiang Wang, Hong Kong<br />
Hui-Xiong Xu, Guangzhou<br />
II<br />
EDITORIAL OFFICE<br />
Na Ma, Director<br />
<strong>World</strong> <strong>Journal</strong> <strong>of</strong> <strong>Radiology</strong><br />
Room 903, Building D, Ocean International Center,<br />
No. 62 Dongsihuan Zhonglu, Chaoyang District,<br />
Beijing 100025, China<br />
Telephone: 0086-10-5908-0036<br />
Fax: 0086-10-8538-1893<br />
E-mail: wjr@wjgnet.com<br />
http://www.wjgnet.com<br />
COPYRIGHT<br />
© 2010 Baishideng. All rights reserved; no part <strong>of</strong> this<br />
publication may be reproduced, stored in a retrieval<br />
system, or transmitted in any form or by any means,<br />
electronic, mechanical, photocopying, recording, or<br />
otherwise without the prior permission <strong>of</strong> Baishideng.<br />
Authors are required to grant <strong>World</strong> <strong>Journal</strong> <strong>of</strong> <strong>Radiology</strong><br />
an exclusive license to publish.<br />
SPECIAL STATEMENT<br />
All articles published in this journal represent the<br />
viewpoints <strong>of</strong> the authors except where indicated<br />
otherwise.<br />
INSTRUCTIONS TO AUTHORS<br />
Full instructions are available online at http://www.<br />
wjgnet.com/1949-8470/index.htm. If you do not<br />
have web access please contact the editorial <strong>of</strong>fice.<br />
ONLINE SUBMISSION<br />
http://www.wjgnet.com/1949-8470<strong>of</strong>fice<br />
January 28, 2010|Volume 2|Issue 1|
W J R<br />
Online Submissions: http://www.wjgnet.com/1949-8470<strong>of</strong>fice<br />
wjr@wjgnet.com<br />
doi:10.4329/wjr.v2.i1.1<br />
Reperfusion injury components and manifestations<br />
determined by cardiovascular MR and MDCT imaging<br />
Maythem Saeed, Steve Hetts, Mark Wilson<br />
Maythem Saeed, Steve Hetts, Mark Wilson, Department <strong>of</strong><br />
<strong>Radiology</strong> and Biomedical Imaging, University <strong>of</strong> California<br />
San Francisco, 185 Berry Street, Suite 350, San Francisco, CA<br />
94107-5705, United States<br />
Author contributions: Saeed M contributed to conception and<br />
design <strong>of</strong> study, as well as acquisition <strong>of</strong> data, and analysis and<br />
interpretation <strong>of</strong> data, manuscript writing, including drafting<br />
the article, and revising it critically for important intellectual<br />
content; Hetts S and Wilson M reviewed it critically for important<br />
intellectual content.<br />
Correspondence to: Maythem Saeed, Pr<strong>of</strong>essor, Department<br />
<strong>of</strong> <strong>Radiology</strong> and Biomedical Imaging, University <strong>of</strong> California<br />
San Francisco, 185 Berry Street, Suite 350, San Francisco, CA<br />
94107-5705, United States. maythem.saeed@radiology.ucsf.edu<br />
Telephone: +1-415-5146221 Fax: +1-415-3539423<br />
Received: November 26, 2009 Revised: January 6, 2010<br />
Accepted: January 13, 2010<br />
Published online: January 28, 2010<br />
Abstract<br />
Advances in magnetic resonance (MR) and computed<br />
tomography (CT) imaging have improved visualization<br />
<strong>of</strong> acute and scar infarct. Over the past decade, there<br />
have been and continues to be many significant technical<br />
advancements in cardiac MR and multi-detector<br />
computed tomography (MDCT) technologies. The<br />
strength <strong>of</strong> MR imaging relies on a variety <strong>of</strong> pulse sequences<br />
and the ability to noninvasively provide information<br />
on myocardial structure, function and perfusion<br />
in a single imaging session. The recent technical developments<br />
may also allow CT technologies to rise to the<br />
forefront for evaluating clinical ischemic heart disease.<br />
Components <strong>of</strong> reperfusion injury including myocardial<br />
edema, hemorrhage, calcium deposition and microvascular<br />
obstruction (MO) have been demonstrated using<br />
MR and CT technologies. MR imaging can be used serially<br />
and noninvasively in assessing acute and chronic<br />
consequences <strong>of</strong> reperfusion injury because there is<br />
no radiation exposure or administration <strong>of</strong> radioactive<br />
materials. MDCT is better suited for assessing coronary<br />
artery stenosis and as an alternative technique for as-<br />
WJR|www.wjgnet.com<br />
<strong>World</strong> <strong>Journal</strong> <strong>of</strong><br />
<strong>Radiology</strong><br />
EDITORIAL<br />
sessing viability in patients where MR imaging is contraindicated.<br />
Changes in left ventricular (LV) volumes<br />
and function measured on cine MR are directly related<br />
to infarct size measured on delayed contrast enhanced<br />
images. Recent MR studies found that transmural infarct,<br />
MO and peri-infarct zone are excellent predictors<br />
<strong>of</strong> poor post-infarct recovery and mortality. Recent MR<br />
studies provided ample evidence that growth factor<br />
genes and stem cells delivered locally have beneficial<br />
effects on myocardial viability, perfusion and function.<br />
The significance <strong>of</strong> deposited calcium in acute infarct<br />
detected on MDCT requires further studies. Cardiac MR<br />
and MDCT imaging have the potential for assessing reperfusion<br />
injury components and manifestations.<br />
© 2010 Baishideng. All rights reserved.<br />
Key words: Calcium deposits in myocardium; Magnetic<br />
resonance imaging; Multi-detector computed tomography;<br />
Myocardial micro and macro-infarct; Reperfusion<br />
injury; Vascular injury<br />
Peer reviewers: Yahya Paksoy, MD, Pr<strong>of</strong>essor, Department <strong>of</strong><br />
<strong>Radiology</strong>, Selcuk University Meram Chool <strong>of</strong> Medicine, 42085<br />
Konya, Turkey; Patrick M Colletti, MD, Pr<strong>of</strong>essor <strong>of</strong> <strong>Radiology</strong><br />
and Medicine, Director Nuclear Medicine Fellowship, USC<br />
Keck School <strong>of</strong> Medicine, Pr<strong>of</strong>essor <strong>of</strong> Biokinesiology, Pr<strong>of</strong>essor<br />
<strong>of</strong> Pharmacology and Pharmaceutical Sciences, Chief <strong>of</strong> MRI,<br />
LAC+USC Imaging Science Center, University <strong>of</strong> Southern<br />
California, 1200 N State Street Room 3566, Los Angeles, CA<br />
90033, United States<br />
Saeed M, Hetts S, Wilson M. Reperfusion injury components<br />
and manifestations determined by cardiovascular MR and<br />
MDCT imaging. <strong>World</strong> J Radiol 2010; 2(1): 1-14 Available<br />
from: URL: http://www.wjgnet.com/1949-8470/full/v2/i1/<br />
1.htm DOI: http://dx.doi.org/10.4329/wjr.v2.i1.1<br />
INTRODUCTION<br />
<strong>World</strong> J Radiol 2010 January 28; 2(1): 1-14<br />
ISSN 1949-8470 (online)<br />
© 2010 Baishideng. All rights reserved.<br />
Ischemic heart disease remains the leading cause <strong>of</strong><br />
1 January 28, 2010|Volume 2|Issue 1|
nostic value in predicting a future diagnosis <strong>of</strong> ischemia,<br />
infarct, or death. First pass perfusion imaging can be<br />
used to discriminate ischemic myocardium. A recent MRimpact<br />
study in 234 patients reported improved detection<br />
<strong>of</strong> ischemic myocardium distal to coronary stenosis compared<br />
to single photon emission computed tomography<br />
in a multicenter and multivendor randomized trial [27] .<br />
MDCT imaging has also been used in the evaluation<br />
<strong>of</strong> cardiac function, myocardial viability and plaque morphology<br />
[28-30] . A preclinical study demonstrated that this<br />
modality has the potential to detect infarct heterogeneity<br />
in the peri-infarct zone [31] . Recent experimental studies using<br />
modern MDCT technology confirmed the potential<br />
<strong>of</strong> the technique in depicting ischemic myocardium during<br />
the first pass perfusion <strong>of</strong> iodinated contrast media [10,32] .<br />
HOMOGENEOUS MYOCARDIAL INFARCT<br />
Several studies indicated that there is a close correlation<br />
between homogeneous myocardial infarct size, dimensions<br />
(size, circumferential extent and transmurality) and<br />
LV remodeling. Inversion-recovery low-angle-shot MR<br />
imaging and helical MDCT imaging have been recently<br />
introduced and performed following the intravenous administration<br />
<strong>of</strong> contrast media with a delay <strong>of</strong> 5-10 min to<br />
define myocardial infarct dimensions [7,9,10,33-39] (Figure 2).<br />
Investigators found that differentially contrast enhanced<br />
regions on MR and MDCT imaging correlate well with<br />
areas <strong>of</strong> decreased flow [32,40] and dobutamine stress on<br />
echocardiography [41] . Furthermore, the combined use<br />
<strong>of</strong> cine and DE-MR imaging are able to differentiate regional<br />
transitional dysfunction in stunned and hibernating<br />
myocardium from permanent dysfunction on con-<br />
WJR|www.wjgnet.com<br />
Saeed M et al . Reperfusion injury on MR and MDCT imaging<br />
Figure 2 Head-to-head comparison between first<br />
pass perfusion MR (top left) and first pass multidetector<br />
computed tomography (MDCT) imaging<br />
(top right) in a 42-year-old man with acute reperfused<br />
infarct. Ischemic myocardium (arrows) appears<br />
as a hypoenhanced region with comparable extent<br />
on both imaging modalities. Bottom: Head-to-head<br />
comparison <strong>of</strong> DE-MR (bottom left) and DE-MDCT imaging<br />
(bottom right) shows a bright region comparable<br />
in size to enhanced inferior infarct (arrows). Note that<br />
the enhanced infarct on DE-imaging is substantially<br />
smaller than ischemic myocardium [38] .<br />
trast enhanced infarct [42,43] . A recent study showed multicontrast<br />
MR imaging enables simultaneous assessment<br />
<strong>of</strong> wall motion, MO and viability [44] .<br />
Cine and DE-MR imaging have been used to determine<br />
contractile reserve in transmural and nontransmural<br />
infarct [45,46] . These studies have also indicated<br />
the substantial improvement in regional function in segments<br />
with 50% transmural enhancement and global LV<br />
improvement in transmural enhancement <strong>of</strong> less than<br />
25% <strong>of</strong> LV wall thickness [45-47] . Others found that 75%<br />
<strong>of</strong> the patients with transmural enhancement died within<br />
26-36 mo <strong>of</strong> diagnosis [48] . Tarantini et al [49] demonstrated<br />
in 76 patients with reperfused infarct that transmural<br />
enhancement using DE-MR imaging is associated with<br />
LV remodeling. These findings were confirmed by Roes<br />
et al [50] who showed that the size <strong>of</strong> the infarct scar in<br />
231 patients is a stronger predictor <strong>of</strong> all-cause mortality<br />
than LV ejection fraction and LV volumes. Thus, extensive<br />
transmural enhancement is an excellent predictor <strong>of</strong><br />
poor recovery.<br />
Contrast enhanced T1-weighted and non-contrast T2weighted<br />
MR imaging is useful in discriminating acute<br />
from chronic myocardial infarct [51] . In a study <strong>of</strong> 73 patients<br />
with acute and chronic infarct by Abdel-Aty et al [51]<br />
MR imaging was effective (96% sensitive) in discriminating<br />
acute from chronic infarct. In a preclinical study,<br />
Saeed et al [52] observed lack <strong>of</strong> deferential enhancement<br />
<strong>of</strong> chronic infarct after administration <strong>of</strong> blood pool MR<br />
contrast media, but not after clinically approved extracellular<br />
MR contrast media. Unlike acute reperfused infarct,<br />
chronic infarct lacks edema, MO or hemorrhage because<br />
they are resorbed.<br />
Expanding the use <strong>of</strong> coronary MDCT into clinical<br />
3 January 28, 2010|Volume 2|Issue 1|
A<br />
Ejection fraction (%)<br />
B<br />
End systolic volume (mL/kg)<br />
C<br />
End diastolic volume (mL/kg)<br />
Saeed M et al . Reperfusion injury on MR and MDCT imaging<br />
55<br />
50<br />
45<br />
40<br />
35<br />
30<br />
3.0<br />
2.5<br />
2.0<br />
1.5<br />
1.0<br />
0.5<br />
0.0<br />
3.0<br />
2.5<br />
2.0<br />
1.5<br />
1.0<br />
0.5<br />
0.0<br />
Acute infarction Chronic infarction<br />
Figure 3 The ejection fraction (A), end systolic volumes (B) and end<br />
diastolic volumes (C) are shown for control and hepatocyte growth factor<br />
gene (VM202) treated animals. The hepatocyte growth factor gene administered<br />
at 3 d after reperfusion significantly decreased end diastolic (mL/kg) and end<br />
systolic volumes at 8 wk compared to 3 d infarct ( a P < 0.05) and control group<br />
( c P < 0.05). Control animals at 8 wk showed a significant decrease in ejection<br />
fraction and significant increase in end systolic and end diastolic volumes<br />
compared with 3 d infarct [59] .<br />
practice has sparked interest in using the modality for assessing<br />
myocardial viability [53] . Gerber et al [9] showed the<br />
similarity between infarct size measured on DE-MDCT<br />
and DE-MR imaging in a series <strong>of</strong> patients. The investigators<br />
demonstrated good agreement (82%, k = 0.61,<br />
P < 0.001) between the two measurements (Figure 2).<br />
Nikolaou et al [54] demonstrated the diagnostic power <strong>of</strong><br />
MDCT in assessing the presence, age, and size <strong>of</strong> myocardial<br />
infarct in 106 patients. Myocardial infarct was<br />
found in 27 <strong>of</strong> 106 patients. MDCT detected 23 <strong>of</strong> 27<br />
patients with infarct with a sensitivity <strong>of</strong> 85%, specificity<br />
<strong>of</strong> 91% and accuracy <strong>of</strong> 90%.<br />
WJR|www.wjgnet.com<br />
a<br />
a,c<br />
Acute infarction Chronic infarction<br />
a<br />
a,c<br />
a,c<br />
Acute infarction Chronic infarction<br />
Control<br />
VM202 treated<br />
Control<br />
VM202 treated<br />
Control<br />
VM202 treated<br />
Infarct size (%LV)<br />
20<br />
15<br />
10<br />
5<br />
0<br />
a<br />
Control VM202 treated<br />
Figure 4 Histogram shows the difference in infarct size prior to intramyocardial<br />
gene delivery at 3 d and 8 wk after infarction in control animals (left<br />
block) and animals treated with hepatocyte growth factor gene (VM202)<br />
(right block) measured on DE-MR imaging (black and white bars) and<br />
postmortem (gray bars). Note the decline in infarct size was greater in gene<br />
treated animals compared with control animals. a P < 0.05 compared with 3 d<br />
acute infarction. c P < 0.05 compared with 8 wk chronic infarction in control animals.<br />
%LV: Percentage <strong>of</strong> LV mass [59] .<br />
Transfer <strong>of</strong> angiogenic genes to ischemic myocardium<br />
is a promising approach under development for the treatment<br />
<strong>of</strong> myocardial infarct. MR and CT imaging may be<br />
a useful tool for defining myocardial infarct and for use in<br />
targeting the infarct for gene and stem cell therapies [55-60] .<br />
Catheter-based fluoroscopic MR and MDCT imaging<br />
has been recently used for delivering these therapies transendocardially<br />
[37,58] . Sequential cine and DE-MR imaging<br />
showed great sensitivity in detecting improvement in<br />
ejection fraction, reduction <strong>of</strong> LV volumes and infarct<br />
size (Figures 3 and 4) after intramyocardial delivery <strong>of</strong><br />
different angiogenic genes [58-60] . Figure 5 demonstrates<br />
the increase in vascular density <strong>of</strong> infarcted myocardium<br />
8 wk after intramyocardial delivery <strong>of</strong> vascular growth<br />
factor gene. Thus, MR imaging provides great promise in<br />
evaluating gene and cell therapies [58,61-63] .<br />
A preliminary experimental study investigated MDCT<br />
for the assessment <strong>of</strong> the efficacy <strong>of</strong> stem cells in infarcted<br />
myocardium and showed that this technique has<br />
the capability to elucidate new therapies [37] . The radiation<br />
doses in MDCT may limit such application in patients<br />
because therapeutic studies need a minimum <strong>of</strong> two imaging<br />
sessions. The potential advantages <strong>of</strong> using MDCT<br />
in assessing myocardial viability may be related to faster<br />
acquisition time compared with cardiac MR imaging and<br />
the ability to scan claustrophobic or uncooperative patients.<br />
Additionally, MDCT angiography is the method<br />
<strong>of</strong> choice for direct visualization <strong>of</strong> the coronary arteries,<br />
coronary calcium and atherosclerosis in its earliest stages;<br />
when treatment can be most effective in preventing<br />
subsequent heart attacks or sudden death. On the other<br />
hand, MR imaging has other advantages over MDCT<br />
including: (1) the absence <strong>of</strong> radiation exposure; (2) the<br />
lack <strong>of</strong> nephrotoxic iodinated contrast media; and (3)<br />
it allows for repeated scans, particularly in pediatric patients.<br />
It should be noted that MR contrast media cause<br />
nephrogenic systemic fibrosis in patients with compromised<br />
renal function [64] .<br />
4 January 28, 2010|Volume 2|Issue 1|<br />
a,c<br />
c<br />
3 d<br />
8 wk<br />
Postmortem
A<br />
B<br />
Figure 5 Micrographs <strong>of</strong> representative infarcts in control and VEGFgene<br />
treated swine. A: The infarct in the control animal shows no appreciable<br />
angiogenesis and residual blood vessels have been remodeled, as shown<br />
by the thick vascular wall and small lumen (black arrows). B: VEGF-gene<br />
treated animal contains numerous blood vessels (arrowheads) in linear array<br />
representing injection track (calibration bar = 200 μm) [60] .<br />
MANIFESTATIONS OF REPERFUSION<br />
INJURY<br />
MO zone<br />
In the setting <strong>of</strong> an acute myocardial infarction, treatment<br />
strategies have primarily focused on the management<br />
<strong>of</strong> culprit occlusions in the epicardial coronary<br />
arteries [65] . Interventional cardiologists, however, found<br />
that the benefits <strong>of</strong> revascularization <strong>of</strong> the epicardial<br />
coronary artery is limited and later discovered that MO<br />
is a major component <strong>of</strong> infarction, which is frequently<br />
seen after revascularization <strong>of</strong> the epicardial coronary<br />
artery. Investigators found that the formation <strong>of</strong> MO is<br />
related to plaque emboli, endothelial swelling, inflammation,<br />
extravascular edema and microvascular spasm [66] .<br />
How best to measure MO in terms <strong>of</strong> predictive<br />
values is an important question. A variety <strong>of</strong> techniques,<br />
flow or frame count [67,68] , myocardial blush grade [69] coronary<br />
Doppler imaging [70] , contrast echocardiography [68] ,<br />
contrast-enhanced MR imaging [71,72] and contrast enhanced<br />
MDCT [32,38] , have been used to detect MO zone<br />
in patients with TIMI (thrombosis in myocardial infarction).<br />
The quality <strong>of</strong> some <strong>of</strong> these techniques, however,<br />
is suboptimal due to poor spatial resolution.<br />
MR and MDCT imaging delineated MO as a hypoenhanced<br />
zone in the core <strong>of</strong> acutely reperfused infarct<br />
(Figure 6). The delineation is attributed to inadequate con-<br />
WJR|www.wjgnet.com<br />
Saeed M et al . Reperfusion injury on MR and MDCT imaging<br />
A<br />
B<br />
Figure 6 Head-to-head comparison <strong>of</strong> DE-MR (A) and DE-MDCT images (B)<br />
showing the dark MO zone (arrowheads) surrounded by a bright enhanced<br />
infarct in a reperfused patient (arrows) [38] .<br />
trast media delivery during first pass perfusion (17 s blood<br />
recirculation time) [46] , early (1-2 min; equilibrium phase <strong>of</strong><br />
contrast medium in the blood and tissue interstitium) [72]<br />
and delayed (10 min; peak enhancement <strong>of</strong> myocardial<br />
infarct) MR imaging [73] . The extent <strong>of</strong> MO after bolus<br />
administration <strong>of</strong> contrast media is time dependent and<br />
varies between first pass, early contrast enhancement and<br />
DE-imaging because it is governed by 2 processes namely:<br />
perfusion and passive diffusion. Figure 6 illustrates the<br />
comparable MO extent measured on DE-MR and DE-<br />
MDCT imaging in a patient subjected to reperfusion.<br />
Both early and delayed persistent MO has been shown<br />
to predict post-infarct LV remodeling and outcome in<br />
patients with ST-elevation myocardial infarction (STE-<br />
MI) [72-76] . A recent study showed that MO detected on<br />
DE-MR imaging is more frequently observed in patients<br />
with the most severe LV dyfunction [77] . A clinical study in<br />
25 patients demonstrated that delayed persistent MO is<br />
also high (32%) in the No-STEMI population after successful<br />
percutaneous coronary intervention [78] , but less<br />
than that observed in STEMI patients [73,79] . Recent studies<br />
indicated that MO is predictive <strong>of</strong> increasing recurrent<br />
myocardial infarct, congestive heart failure, stroke and<br />
death up to 16 mo after the event [72,73,75] .<br />
Preclinical studies showed that the extent <strong>of</strong> MO in reperfused<br />
infarct is less variable in the first 10 min after administration<br />
<strong>of</strong> blood pool MR contrast media, which may<br />
be attributed to slow convection <strong>of</strong> the contrast medium<br />
in the interstitium and its retention in the blood pool [80] .<br />
January 28, 2010|Volume 2|Issue 1|
Saeed M et al . Reperfusion injury on MR and MDCT imaging<br />
Figure 7 Multislice T2*-weighted (susceptibility) turbo spin echo images<br />
show severe interstitial hemorrhage in the core (arrowheads) <strong>of</strong> the<br />
hyperintense edematous area at risk (arrows) 3 d after reperfusion.<br />
INTERSTITIAL HEMORRHAGE<br />
Interstitial hemorrhage is another component <strong>of</strong> reperfusion<br />
injury in patients with ST-segment elevation due<br />
to acute infarct. Its presence is an important marker for<br />
myocardial and microvascular damage. Interstitial hemorrhage<br />
causes signal loss on T2*-weighted images, which<br />
depends on the status <strong>of</strong> hemoglobin (oxyhemoglobin,<br />
deoxyhemoglobin, or methemoglobin) and the presence<br />
<strong>of</strong> blood products such as ferritin and hemosiderin [15,81] .<br />
Figure 7 demonstrates intensive hypointense interstitial<br />
hemorrhage 3 d after reperfusion in a swine model on<br />
T2*-weighted (susceptibility) turbo spin echo MR imaging.<br />
O’Regan et al [82] quantified the extent <strong>of</strong> interstitial<br />
hemorrhage on T2*-weighted mapping and compared it<br />
with other indices <strong>of</strong> ischemic injury, such as area at risk<br />
and infarct size.<br />
Although non-enhancing myocardium within the<br />
infarct is thought to represent MO [46] , it is possible that<br />
the presence <strong>of</strong> blood products may also contribute to<br />
its low signal seen on MR images [15] . Ganame et al [83] also<br />
used T2-weighted MR imaging to measure the extent <strong>of</strong><br />
hemorrhage and area at risk in 98 patients with a large<br />
reperfused infarct. Based on this technique, the investigators<br />
demonstrated a high prevalence <strong>of</strong> myocardial<br />
hemorrhage <strong>of</strong> 25% in this patient cohort, more common<br />
amongst patients with large transmural infarct and<br />
severe LV global and regional dysfunction.<br />
PERI-INFARCT ZONE<br />
A mixed population <strong>of</strong> viable and non-viable myocytes<br />
has been found around acutely infarcted myocardium,<br />
a territory previously described as the peri-infarct<br />
zone [84,85] . Microscopic studies indicated that the periinfarct<br />
zone has leaky microvessels [84-88] . The peri-infarct<br />
WJR|www.wjgnet.com<br />
zone has consistently been substantiated by a variety <strong>of</strong><br />
modalities, including echocardiography [89] , radiopaque<br />
bead arrays [90] and MR imaging [82] . The physiological correlates<br />
<strong>of</strong> the peri-infarct zone using MR imaging have<br />
been described [91] .<br />
MR or CT contrast media have been used to define<br />
the peri-infarct zone [31,88] , identify patients who are susceptible<br />
to ventricular arrhythmias [92] and predict postinfarct<br />
mortality [93] . Using preclinical necrosis-specific<br />
(mesoporphyrin) and extracellular MR contrast medium<br />
in a seminal animal study, Saeed et al [94] demonstrated MR<br />
characterization <strong>of</strong> the peri-infarct zone. They found<br />
that the enhanced region on DE-MR imaging is larger<br />
than the true infarct delineated on TTC staining, which<br />
was identical to regions enhanced by the necrosis-specific<br />
contrast medium. The difference in enhancement<br />
regions demarcated by the 2 contrast media was considered<br />
the peri-infarct zone. At that time our findings<br />
were in contrast to other groups who demonstrated that<br />
differentially enhanced myocardium represents necrotic<br />
tissue. Recent clinical MR studies confirmed our findings<br />
[31,92,95] and went further to report the associations<br />
between infarct size, the peri-infarct zone and inducible<br />
ventricular arrhythmias [31,92,93,95] . Yan et al [93] found that<br />
the extent <strong>of</strong> the peri-infarct provides prognostic value<br />
for mortality incremental to that <strong>of</strong>fered by ejection fraction<br />
and LV end-diastolic volume. On the other hand,<br />
the existence <strong>of</strong> viable myocytes in a large peri-infarct<br />
zone may raise an interesting hypothesis that reperfusion<br />
could be beneficial by reducing arrhythmogenic triggers,<br />
despite the apparent lack <strong>of</strong> measurable improvement<br />
in contractile function. Furthermore, implantable cardioverter-defibrillator<br />
therapy may be warranted in such<br />
high-risk patients identified by MR due to the creation<br />
<strong>of</strong> multiple action potential circuits derived from the<br />
peri-infarct zone.<br />
CALCIUM DEPOSIT<br />
Considering the deleterious effects <strong>of</strong> calcium overload<br />
in reperfused myocardium [96,97] , the development <strong>of</strong> a<br />
noninvasive technique to visualize calcium deposits in<br />
infarcted myocardium may have clinical value. Noninvasive<br />
imaging techniques that directly incorporate the<br />
spatial distribution <strong>of</strong> calcium in infarcted myocardium<br />
may help our understanding <strong>of</strong> the relationship between<br />
calcium deposits in the myocardium, the rate <strong>of</strong> infarct<br />
resorption, and LV function [98] .<br />
Calcium deposited in infarcted myocardium has previously<br />
been used as a target for 99m-Tc pyrophosphate<br />
scintigraphy to delineate reperfused myocardial infarcts<br />
in patients [99,100] . For over a decade, electron-beam CT<br />
has been clinically used for calcium scoring in the coronary<br />
arteries <strong>of</strong> patients. In addition to calcium scoring<br />
and detection <strong>of</strong> coronary stenosis, modern MDCT<br />
scanners have been used to assess the extent <strong>of</strong> acute<br />
and chronic infarct [10,101] .<br />
January 28, 2010|Volume 2|Issue 1|
In a recent animal study, non-contrast MDCT images<br />
depicted calcium deposits as “hot-spots” 1 wk after<br />
reperfusion (Figure 8). The presence <strong>of</strong> calcium deposits<br />
on non-contrast MDCT images, however, was transient<br />
and specific to acute infarct because the calcium was<br />
resorbed from the infarct scar at 8 wk as shown on CT<br />
imaging and histopathology (Figure 9). Histopathology<br />
confirmed the engulfment <strong>of</strong> the deposited calcium by<br />
macrophages [102] . Noninvasive evaluation <strong>of</strong> the beneficial<br />
administration <strong>of</strong> calcium channel blockers on calcium<br />
overload during reperfusion may be possible using<br />
MDCT.<br />
HETEROGENOUS MICROINFARCT<br />
Heterogeneous microinfarct results from showers <strong>of</strong> microemboli<br />
shed following coronary intervention. Clinical<br />
studies showed that 42% <strong>of</strong> patients experience major<br />
WJR|www.wjgnet.com<br />
Saeed M et al . Reperfusion injury on MR and MDCT imaging<br />
Figure 8 Non-contrast enhanced MDCT imaging demonstrates deposited calcium 7 d after reperfusion (right block arrows). In all 3 animals (the 3 rows) the<br />
deposited calcium was not evident at 2-3 h after reperfusion on non-contrast enhanced MDCT (left block) [102] .<br />
cardiac problems, such as heart failure and sudden death,<br />
after percutaneous coronary angioplasty [103,104] . High incidences<br />
(30%-50%) <strong>of</strong> defects on myocardial perfusion<br />
scintigraphy have also been detected soon after coronary<br />
balloon angioplasty and with optimally implanted<br />
stents [105,106] and these events continued during followup<br />
[107-109] . The emboli sizes, collected by distal protection<br />
devices during percutaneous coronary intervention,<br />
differ widely (47-2503 μm) [110] and the size and number<br />
<strong>of</strong> ruptured atherosclerotic plaques is a key event in the<br />
pathogenesis <strong>of</strong> heterogeneous microinfarct [111] . A recent<br />
clinical study demonstrated that the volume <strong>of</strong> embolized<br />
material relates directly to the volume <strong>of</strong> new necrosis<br />
detected by delayed-enhancement MR imaging [112] .<br />
The American College <strong>of</strong> Cardiology and the European<br />
Society <strong>of</strong> Cardiology recently recognized the detrimental<br />
consequences <strong>of</strong> coronary microembolization in patients<br />
in their 2007 guidelines [113] .<br />
7 January 28, 2010|Volume 2|Issue 1|
A B<br />
DE-images provides prognostic value beyond the routine<br />
clinical, angiographic and functional predictors [25] .<br />
Heterogeneous microinfarct is not limited to percutaneous<br />
coronary intervention for atherosclerosis but<br />
include a wide range <strong>of</strong> diseases, such as valvular disease,<br />
prosthetic valve, endocarditis, cardiomyopathy with<br />
mural thrombus, arrhythmias and during heart-lungbypass<br />
[121-125] . This pathology has also been reported in<br />
patients with hypertension, diabetes [126] , systemic lupus<br />
erythematosus [127] and sickle cell disease, where abnormally<br />
shaped erythrocytes obstructing the capillaries and<br />
small arterioles may cause myocardial fibrosis [128] . Therefore,<br />
early detection and subsequent effects <strong>of</strong> microinfarct<br />
need highly sensitive imaging modalities.<br />
CONCLUSION<br />
The clinical role <strong>of</strong> MR and MDCT imaging continues<br />
to expand supported by the advances in s<strong>of</strong>tware and<br />
hardware. The strength <strong>of</strong> MR imaging relies on the variety<br />
<strong>of</strong> pulse sequences and the ability to noninvasively<br />
provide information on myocardial structure, function<br />
and perfusion in a single imaging session. The complementary<br />
use <strong>of</strong> both MR and MDCT imaging allows the<br />
components and manifestations <strong>of</strong> reperfusion injury<br />
including myocardial edema, interstitial hemorrhage, calcium<br />
deposition and MO to be visualized. MR imaging<br />
can be used serially and noninvasively in assessing the<br />
consequences <strong>of</strong> reperfusion injury because there is no<br />
radiation exposure or administration <strong>of</strong> radioactive materials.<br />
MDCT is better suited for assessing coronary artery<br />
stenosis and as an alternative technique for assessing<br />
viability in patients where MR imaging is contraindicated.<br />
Clinical MR studies found that the presence <strong>of</strong> transmural<br />
infarct, MO and peri-infarct are excellent predictor<br />
<strong>of</strong> poor post-infarct recovery and mortality [31,92,93,95,129] .<br />
Heterogeneous cardiac microinfarct detected on contrast<br />
enhanced MR and MDCT imaging has a prolonged effect<br />
on LV function and perfusion (Figure 11) [130] . The<br />
clinical significance <strong>of</strong> deposited calcium, detected on<br />
MDCT, in acute homogeneous infarct requires further<br />
studies. Recent preclinical MR studies provided ample<br />
evidence that angiogenic genes and stem cells, delivered<br />
transendocardially under MR-guidance, have beneficial<br />
WJR|www.wjgnet.com<br />
Saeed M et al . Reperfusion injury on MR and MDCT imaging<br />
effects on myocardial function, perfusion and viability.<br />
Imaging protocols are in progress to monitor the longterm<br />
efficacy <strong>of</strong> such therapeutic agents. Cardiac MR<br />
and MDCT imaging can characterize reperfusion injury<br />
components and manifestations.<br />
REFERENCES<br />
Figure 11 DE-multi-slice MDCT (A) and DE-MR (B) images<br />
from experimentally embolized LAD coronary artery show<br />
good correspondence between the modalities in defining<br />
heterogenous microinfarct. Both modalities show enhanced<br />
stripes (arrows) <strong>of</strong> microinfarct extending from the epicardium<br />
to the endocardium mapping occluded microvessels.<br />
1 Maceira AM, Joshi J, Prasad SK, Moon JC, Perugini E,<br />
Harding I, Sheppard MN, Poole-Wilson PA, Hawkins PN,<br />
Pennell DJ. Cardiovascular magnetic resonance in cardiac<br />
amyloidosis. Circulation 200 ; 111: 18 -193<br />
2 Friedrich MG, Strohm O, Schulz-Menger J, Marciniak<br />
H, Luft FC, Dietz R. Contrast media-enhanced magnetic<br />
resonance imaging visualizes myocardial changes in the<br />
course <strong>of</strong> viral myocarditis. Circulation 1998; 97: 1802-1809<br />
3 Amano Y, Takayama M, Kumita S. Contrast-enhanced<br />
myocardial T1-weighted scout (Look-Locker) imaging<br />
for the detection <strong>of</strong> myocardial damages in hypertrophic<br />
cardiomyopathy. J Magn Reson Imaging 2009; 30: 778-784<br />
4 Sakuma H, Suzawa N, Ichikawa Y, Makino K, Hirano<br />
T, Kitagawa K, Takeda K. Diagnostic accuracy <strong>of</strong> stress<br />
first-pass contrast-enhanced myocardial perfusion MRI<br />
compared with stress myocardial perfusion scintigraphy.<br />
AJR Am J Roentgenol 200 ; 185: 9 -102<br />
Hendel RC, Patel MR, Kramer CM, Poon M, Hendel RC, Carr<br />
JC, Gerstad NA, Gillam LD, Hodgson JM, Kim RJ, Kramer<br />
CM, Lesser JR, Martin ET, Messer JV, Redberg RF, Rubin GD,<br />
Rumsfeld JS, Taylor AJ, Weigold WG, Woodard PK, Brindis<br />
RG, Hendel RC, Douglas PS, Peterson ED, Wolk MJ, Allen<br />
JM, Patel MR. ACCF/ACR/SCCT/SCMR/ASNC/NASCI/<br />
SCAI/SIR 200 appropriateness criteria for cardiac computed<br />
tomography and cardiac magnetic resonance imaging: a<br />
report <strong>of</strong> the American College <strong>of</strong> Cardiology Foundation<br />
Quality Strategic Directions Committee Appropriateness<br />
Criteria Working Group, American College <strong>of</strong> <strong>Radiology</strong>,<br />
Society <strong>of</strong> Cardiovascular Computed Tomography, Society<br />
for Cardiovascular Magnetic Resonance, American Society<br />
<strong>of</strong> Nuclear Cardiology, North American Society for Cardiac<br />
Imaging, Society for Cardiovascular Angiography and<br />
Interventions, and Society <strong>of</strong> Interventional <strong>Radiology</strong>. J Am<br />
Coll Cardiol 200 ; 48: 147 -1497<br />
van der Vleuten PA, Willems TP, Götte MJ, Tio RA, Greuter<br />
MJ, Zijlstra F, Oudkerk M. Quantification <strong>of</strong> global left<br />
ventricular function: comparison <strong>of</strong> multidetector computed<br />
tomography and magnetic resonance imaging. a metaanalysis<br />
and review <strong>of</strong> the current literature. Acta Radiol<br />
200 ; 47: 1049-10 7<br />
7 George RT, Silva C, Cordeiro MA, DiPaula A, Thompson DR,<br />
McCarthy WF, Ichihara T, Lima JA, Lardo AC. Multidetector<br />
computed tomography myocardial perfusion imaging during<br />
adenosine stress. J Am Coll Cardiol 200 ; 48: 1 3-1 0<br />
9 January 28, 2010|Volume 2|Issue 1|
Saeed M et al . Reperfusion injury on MR and MDCT imaging<br />
8 Mahnken AH, Bruners P, Katoh M, Wildberger JE, Günther<br />
RW, Buecker A. Dynamic multi-section CT imaging in acute<br />
myocardial infarction: preliminary animal experience. Eur<br />
Radiol 200 ; 16: 74 -7 2<br />
9 Gerber BL, Belge B, Legros GJ, Lim P, Poncelet A, Pasquet<br />
A, Gisellu G, Coche E, Vanoverschelde JL. Characterization<br />
<strong>of</strong> acute and chronic myocardial infarcts by multidetector<br />
computed tomography: comparison with contrast-enhanced<br />
magnetic resonance. Circulation 200 ; 113: 823-833<br />
10 Lardo AC, Cordeiro MA, Silva C, Amado LC, George RT,<br />
Saliaris AP, Schuleri KH, Fernandes VR, Zviman M, Nazarian<br />
S, Halperin HR, Wu KC, Hare JM, Lima JA. Contrastenhanced<br />
multidetector computed tomography viability<br />
imaging after myocardial infarction: characterization <strong>of</strong><br />
myocyte death, microvascular obstruction, and chronic scar.<br />
Circulation 200 ; 113: 394-404<br />
11 Garcia-Dorado D, Oliveras J. Myocardial oedema: a preventable<br />
cause <strong>of</strong> reperfusion injury? Cardiovasc Res 1993; 27:<br />
1 -1 3<br />
12 García-Dorado D, Oliveras J, Gili J, Sanz E, Pérez-Villa F,<br />
Barrabés J, Carreras MJ, Solares J, Soler-Soler J. Analysis <strong>of</strong><br />
myocardial oedema by magnetic resonance imaging early<br />
after coronary artery occlusion with or without reperfusion.<br />
Cardiovasc Res 1993; 27: 14 2-14 9<br />
13 Boxt LM, Hsu D, Katz J, Detweiler P, Mclaughlin S, Kolb TJ,<br />
Spotnitz HM. Estimation <strong>of</strong> myocardial water content using<br />
transverse relaxation time from dual spin-echo magnetic<br />
resonance imaging. Magn Reson Imaging 1993; 11: 37 -383<br />
14 Arai AE. Using magnetic resonance imaging to characterize<br />
recent myocardial injury: utility in acute coronary syndrome<br />
and other clinical scenarios. Circulation 2008; 118: 79 -79<br />
1 Basso C, Corbetti F, Silva C, Abudureheman A, Lacognata C,<br />
Cacciavillani L, Tarantini G, Marra MP, Ramondo A, Thiene G,<br />
Iliceto S. Morphologic validation <strong>of</strong> reperfused hemorrhagic<br />
myocardial infarction by cardiovascular magnetic resonance.<br />
Am J Cardiol 2007; 100: 1322-1327<br />
1 Friedrich MG, Abdel-Aty H, Taylor A, Schulz-Menger J,<br />
Messroghli D, Dietz R. The salvaged area at risk in reperfused<br />
acute myocardial infarction as visualized by cardiovascular<br />
magnetic resonance. J Am Coll Cardiol 2008; 51: 1 81-1 87<br />
17 Stork A, Lund GK, Muellerleile K, Bansmann PM, Nolte-<br />
Ernsting C, Kemper J, Begemann PG, Adam G. Characterization<br />
<strong>of</strong> the peri-infarction zone using T2-weighted MRI and<br />
delayed-enhancement MRI in patients with acute myocardial<br />
infarction. Eur Radiol 200 ; 16: 23 0-23 7<br />
18 Tilak GS, Hsu LY, Hoyt RF Jr, Arai AE, Aletras AH. In vivo<br />
T2-weighted magnetic resonance imaging can accurately<br />
determine the ischemic area at risk for 2-day-old nonreperfused<br />
myocardial infarction. Invest Radiol 2008; 43: 7-1<br />
19 Janssens S, Dubois C, Bogaert J, Theunissen K, Deroose<br />
C, Desmet W, Kalantzi M, Herbots L, Sinnaeve P, Dens J,<br />
Maertens J, Rademakers F, Dymarkowski S, Gheysens O, Van<br />
Cleemput J, Bormans G, Nuyts J, Belmans A, Mortelmans<br />
L, Boogaerts M, Van de Werf F. Autologous bone marrowderived<br />
stem-cell transfer in patients with ST-segment<br />
elevation myocardial infarction: double-blind, randomised<br />
controlled trial. Lancet 200 ; 367: 113-121<br />
20 Miller TD, Christian TF, Hopfenspirger MR, Hodge DO,<br />
Gersh BJ, Gibbons RJ. Infarct size after acute myocardial<br />
infarction measured by quantitative tomographic 99mTc<br />
sestamibi imaging predicts subsequent mortality. Circulation<br />
199 ; 92: 334-341<br />
21 Santoro GM, Bisi G, Sciagrà R, Leoncini M, Fazzini PF,<br />
Meldolesi U. Single photon emission computed tomography<br />
with technetium-99m hexakis 2-methoxyisobutyl isonitrile<br />
in acute myocardial infarction before and after thrombolytic<br />
treatment: assessment <strong>of</strong> salvaged myocardium and<br />
prediction <strong>of</strong> late functional recovery. J Am Coll Cardiol 1990;<br />
15: 301-314<br />
WJR|www.wjgnet.com<br />
22 Wackers FJ, Gibbons RJ, Verani MS, Kayden DS, Pellikka PA,<br />
Behrenbeck T, Mahmarian JJ, Zaret BL. Serial quantitative<br />
planar technetium-99m isonitrile imaging in acute<br />
myocardial infarction: efficacy for noninvasive assessment <strong>of</strong><br />
thrombolytic therapy. J Am Coll Cardiol 1989; 14: 8 1-873<br />
23 Shapiro MD, Guarraia DL, Moloo J, Cury RC. Evaluation <strong>of</strong><br />
acute coronary syndromes by cardiac magnetic resonance<br />
imaging. Top Magn Reson Imaging 2008; 19: 2 -32<br />
24 Bragadeesh T, Jayaweera AR, Pascotto M, Micari A, Le DE,<br />
Kramer CM, Epstein FH, Kaul S. Post-ischaemic myocardial<br />
dysfunction (stunning) results from my<strong>of</strong>ibrillar oedema.<br />
Heart 2008; 94: 1 -171<br />
2 Kwong RY, Chan AK, Brown KA, Chan CW, Reynolds HG,<br />
Tsang S, Davis RB. Impact <strong>of</strong> unrecognized myocardial scar<br />
detected by cardiac magnetic resonance imaging on eventfree<br />
survival in patients presenting with signs or symptoms<br />
<strong>of</strong> coronary artery disease. Circulation 200 ; 113: 2733-2743<br />
2 Ingkanisorn WP, Kwong RY, Bohme NS, Geller NL, Rhoads<br />
KL, Dyke CK, Paterson DI, Syed MA, Aletras AH, Arai AE.<br />
Prognosis <strong>of</strong> negative adenosine stress magnetic resonance<br />
in patients presenting to an emergency department with<br />
chest pain. J Am Coll Cardiol 200 ; 47: 1427-1432<br />
27 Schwitter J, Wacker CM, van Rossum AC, Lombardi M,<br />
Al-Saadi N, Ahlstrom H, Dill T, Larsson HB, Flamm SD,<br />
Marquardt M, Johansson L. MR-IMPACT: comparison <strong>of</strong><br />
perfusion-cardiac magnetic resonance with single-photon<br />
emission computed tomography for the detection <strong>of</strong> coronary<br />
artery disease in a multicentre, multivendor, randomized<br />
trial. Eur Heart J 2008; 29: 480-489<br />
28 Achenbach S, Daniel WG. Current role <strong>of</strong> cardiac computed<br />
tomography. Herz 2007; 32: 97-107<br />
29 Kopp AF, Heuschmid M, Reimann A, Kuettner A, Beck<br />
T, Ohmer M, Burgstahler C, Brodoefel H, Claussen CD,<br />
Schroeder S. Evaluation <strong>of</strong> cardiac function and myocardial<br />
viability with 1 - and 4-slice multidetector computed<br />
tomography. Eur Radiol 200 ; 15 Suppl 4: D1 -D20<br />
30 Mollet NR, Cademartiri F, Nieman K, Saia F, Lemos PA,<br />
McFadden EP, Serruys PW, Krestin GP, de Feyter PJ.<br />
Noninvasive assessment <strong>of</strong> coronary plaque burden using<br />
multislice computed tomography. Am J Cardiol 200 ; 95:<br />
11 -11 9<br />
31 Schuleri KH, Centola M, George RT, Amado LC, Evers KS,<br />
Kitagawa K, Vavere AL, Evers R, Hare JM, Cox C, McVeigh<br />
ER, Lima JA, Lardo AC. Characterization <strong>of</strong> peri-infarct zone<br />
heterogeneity by contrast-enhanced multidetector computed<br />
tomography: a comparison with magnetic resonance<br />
imaging. J Am Coll Cardiol 2009; 53: 1 99-1707<br />
32 Furtado AD, Carlsson M, Wintermark M, Ordovas K,<br />
Saeed M. Identification <strong>of</strong> residual ischemia, infarction, and<br />
microvascular impairment in revascularized myocardial<br />
infarction using 4-slice MDCT. Contrast Media Mol Imaging<br />
2008; 3: 198-20<br />
33 Baks T, Cademartiri F, Moelker AD, van der Giessen WJ,<br />
Krestin GP, Duncker DJ, de Feyter PJ. Assessment <strong>of</strong> acute<br />
reperfused myocardial infarction with delayed enhancement<br />
4-MDCT. AJR Am J Roentgenol 2007; 188: W13 -W137<br />
34 Mahnken AH, Bruners P, Mühlenbruch G, Emmerich M,<br />
Hohl C, Günther RW, Wildberger JE. Low tube voltage<br />
improves computed tomography imaging <strong>of</strong> delayed<br />
myocardial contrast enhancement in an experimental acute<br />
myocardial infarction model. Invest Radiol 2007; 42: 123-129<br />
3 Kondo C, Mori S, Endo M, Kusakabe K, Suzuki N, Hattori A,<br />
Kusakabe M. Real-time volumetric imaging <strong>of</strong> human heart<br />
without electrocardiographic gating by 2 -detector row<br />
computed tomography: initial experience. J Comput Assist<br />
Tomogr 200 ; 29: 94- 98<br />
3 Sanz J, Weeks D, Nikolaou K, Sirol M, Rius T, Rajagopalan<br />
S, Dellegrottaglie S, Strobeck J, Fuster V, Poon M. Detection<br />
<strong>of</strong> healed myocardial infarction with multidetector-row<br />
10 January 28, 2010|Volume 2|Issue 1|
computed tomography and comparison with cardiac<br />
magnetic resonance delayed hyperenhancement. Am J Cardiol<br />
200 ; 98: 149-1<br />
37 Amado LC, Schuleri KH, Saliaris AP, Boyle AJ, Helm R,<br />
Oskouei B, Centola M, Eneboe V, Young R, Lima JA, Lardo<br />
AC, Heldman AW, Hare JM. Multimodality noninvasive<br />
imaging demonstrates in vivo cardiac regeneration after<br />
mesenchymal stem cell therapy. J Am Coll Cardiol 200 ; 48:<br />
211 -2124<br />
38 Jacquier A, Boussel L, Amabile N, Bartoli JM, Douek<br />
P, Moulin G, Paganelli F, Saeed M, Revel D, Croisille P.<br />
Multidetector computed tomography in reperfused acute<br />
myocardial infarction. Assessment <strong>of</strong> infarct size and noreflow<br />
in comparison with cardiac magnetic resonance<br />
imaging. Invest Radiol 2008; 43: 773-781<br />
39 Jacquier A, Revel D, Saeed M. MDCT <strong>of</strong> the myocardium:<br />
a new contribution to ischemic heart disease. Acad Radiol<br />
2008; 15: 477-487<br />
40 Klein C, Nekolla SG, Bengel FM, Momose M, Sammer A,<br />
Haas F, Schnackenburg B, Delius W, Mudra H, Wolfram<br />
D, Schwaiger M. Assessment <strong>of</strong> myocardial viability with<br />
contrast-enhanced magnetic resonance imaging: comparison<br />
with positron emission tomography. Circulation 2002; 105:<br />
1 2-1 7<br />
41 Zamorano J, Delgado J, Almería C, Moreno R, Gómez Sánchez<br />
M, Rodrigo J, Fernández C, Ferreiros J, Rufilanchas J, Sánchez-<br />
Harguindey L. Reason for discrepancies in identifying<br />
myocardial viability by thallium-201 redistribution, magnetic<br />
resonance imaging, and dobutamine echocardiography. Am J<br />
Cardiol 2002; 90: 4 -4 9<br />
42 Kim RJ, Hillenbrand HB, Judd RM. Evaluation <strong>of</strong> myocardial<br />
viability by MRI. Herz 2000; 25: 417-430<br />
43 Weiss CR, Aletras AH, London JF, Taylor JL, Epstein FH,<br />
Wassmuth R, Balaban RS, Arai AE. Stunned, infarcted, and<br />
normal myocardium in dogs: simultaneous differentiation<br />
by using gadolinium-enhanced cine MR imaging with<br />
magnetization transfer contrast. <strong>Radiology</strong> 2003; 226: 723-730<br />
44 Connelly KA, Detsky JS, Graham JJ, Paul G, Vijayaragavan<br />
R, Dick AJ, Wright GA. Multicontrast late gadolinium<br />
enhancement imaging enables viability and wall motion<br />
assessment in a single acquisition with reduced scan times. J<br />
Magn Reson Imaging 2009; 30: 771-777<br />
4 Choi KM, Kim RJ, Gubernik<strong>of</strong>f G, Vargas JD, Parker M,<br />
Judd RM. Transmural extent <strong>of</strong> acute myocardial infarction<br />
predicts long-term improvement in contractile function.<br />
Circulation 2001; 104: 1101-1107<br />
4 Lund GK, Stork A, Saeed M, Bansmann MP, Gerken JH,<br />
Müller V, Mester J, Higgins CB, Adam G, Meinertz T. Acute<br />
myocardial infarction: evaluation with first-pass enhancement<br />
and delayed enhancement MR imaging compared with 201Tl<br />
SPECT imaging. <strong>Radiology</strong> 2004; 232: 49- 7<br />
47 Sandstede JJ, Lipke C, Beer M, Harre K, Pabst T, Kenn W,<br />
Neubauer S, Hahn D. Analysis <strong>of</strong> first-pass and delayed<br />
contrast-enhancement patterns <strong>of</strong> dysfunctional myocardium<br />
on MR imaging: use in the prediction <strong>of</strong> myocardial viability.<br />
AJR Am J Roentgenol 2000; 174: 1737-1740<br />
48 Kwong RY, Yucel EK. Cardiology patient pages. Computed<br />
tomography scan and magnetic resonance imaging.<br />
Circulation 2003; 108: e104-e10<br />
49 Tarantini G, Razzolini R, Cacciavillani L, Bilato C, Sarais<br />
C, Corbetti F, Marra MP, Napodano M, Ramondo A,<br />
Iliceto S. Influence <strong>of</strong> transmurality, infarct size, and severe<br />
microvascular obstruction on left ventricular remodeling<br />
and function after primary coronary angioplasty. Am J<br />
Cardiol 200 ; 98: 1033-1040<br />
0 Roes SD, Kelle S, Kaandorp TA, Kokocinski T, Poldermans<br />
D, Lamb HJ, Boersma E, van der Wall EE, Fleck E, de Roos<br />
A, Nagel E, Bax JJ. Comparison <strong>of</strong> myocardial infarct size<br />
assessed with contrast-enhanced magnetic resonance imaging<br />
WJR|www.wjgnet.com<br />
Saeed M et al . Reperfusion injury on MR and MDCT imaging<br />
and left ventricular function and volumes to predict mortality<br />
in patients with healed myocardial infarction. Am J Cardiol<br />
2007; 100: 930-93<br />
1 Abdel-Aty H, Zagrosek A, Schulz-Menger J, Taylor AJ,<br />
Messroghli D, Kumar A, Gross M, Dietz R, Friedrich MG.<br />
Delayed enhancement and T2-weighted cardiovascular<br />
magnetic resonance imaging differentiate acute from chronic<br />
myocardial infarction. Circulation 2004; 109: 2411-241<br />
2 Saeed M, Weber O, Lee R, Do L, Martin A, Saloner D, Ursell P,<br />
Robert P, Corot C, Higgins CB. Discrimination <strong>of</strong> myocardial<br />
acute and chronic (scar) infarctions on delayed contrast<br />
enhanced magnetic resonance imaging with intravascular<br />
magnetic resonance contrast media. J Am Coll Cardiol 200 ; 48:<br />
19 1-19 8<br />
3 Nieman K, Shapiro MD, Ferencik M, Nomura CH, Abbara<br />
S, H<strong>of</strong>fmann U, Gold HK, Jang IK, Brady TJ, Cury RC.<br />
Reperfused myocardial infarction: contrast-enhanced<br />
4-Section CT in comparison to MR imaging. <strong>Radiology</strong> 2008;<br />
247: 49-<br />
4 Nikolaou K, Flohr T, Knez A, Rist C, Wintersperger B,<br />
Johnson T, Reiser MF, Becker CR. Advances in cardiac CT<br />
imaging: 4-slice scanner. Int J Cardiovasc Imaging 2004; 20:<br />
3 - 40<br />
Dick AJ, Lederman RJ. MRI-guided myocardial cell therapy.<br />
Int J Cardiovasc Intervent 200 ; 7: 1 -170<br />
Dicks D, Saloner D, Martin A, Carlsson M, Saeed M.<br />
Percutaneous transendocardial VEGF gene therapy: MRI<br />
guided delivery and characterization <strong>of</strong> 3D myocardial<br />
strain. Int J Cardiol 2009; :<br />
7 Hill JM, Dick AJ, Raman VK, Thompson RB, Yu ZX, Hinds<br />
KA, Pessanha BS, Guttman MA, Varney TR, Martin BJ,<br />
Dunbar CE, McVeigh ER, Lederman RJ. Serial cardiac<br />
magnetic resonance imaging <strong>of</strong> injected mesenchymal stem<br />
cells. Circulation 2003; 108: 1009-1014<br />
8 Saeed M, Martin A, Jacquier A, Bucknor M, Saloner D, Do L,<br />
Ursell P, Su H, Kan YW, Higgins CB. Permanent coronary<br />
artery occlusion: cardiovascular MR imaging is platform for<br />
percutaneous transendocardial delivery and assessment <strong>of</strong><br />
gene therapy in canine model. <strong>Radiology</strong> 2008; 249: 0- 71<br />
9 Saeed M, Martin A, Ursell P, Do L, Bucknor M, Higgins<br />
CB, Saloner D. MR assessment <strong>of</strong> myocardial perfusion,<br />
viability, and function after intramyocardial transfer <strong>of</strong><br />
VM202, a new plasmid human hepatocyte growth factor in<br />
ischemic swine myocardium. <strong>Radiology</strong> 2008; 249: 107-118<br />
0 Saeed M, Saloner D, Martin A, Do L, Weber O, Ursell PC,<br />
Jacquier A, Lee R, Higgins CB. Adeno-associated viral<br />
vector-encoding vascular endothelial growth factor gene:<br />
effect on cardiovascular MR perfusion and infarct resorption<br />
measurements in swine. <strong>Radiology</strong> 2007; 243: 4 1-4 0<br />
1 Carlsson M, Wilson M, Martin AJ, Saeed M. Myocardial<br />
microinfarction after coronary microembolization in swine:<br />
MR imaging characterization. <strong>Radiology</strong> 2009; 250: 703-713<br />
2 Jacquier A, Higgins CB, Martin AJ, Do L, Saloner D, Saeed<br />
M. Injection <strong>of</strong> adeno-associated viral vector encoding<br />
vascular endothelial growth factor gene in infarcted swine<br />
myocardium: MR measurements <strong>of</strong> left ventricular function<br />
and strain. <strong>Radiology</strong> 2007; 245: 19 -20<br />
3 Saeed M, Martin AJ, Lee RJ, Weber O, Revel D, Saloner D,<br />
Higgins CB. MR guidance <strong>of</strong> targeted injections into border<br />
and core <strong>of</strong> scarred myocardium in pigs. <strong>Radiology</strong> 200 ; 240:<br />
419-42<br />
4 Weinreb JC, Abu-Alfa AK. Gadolinium-based contrast<br />
agents and nephrogenic systemic fibrosis: why did it happen<br />
and what have we learned? J Magn Reson Imaging 2009; 30:<br />
123 -1239<br />
Keeley EC, Boura JA, Grines CL. Primary angioplasty versus<br />
intravenous thrombolytic therapy for acute myocardial<br />
infarction: a quantitative review <strong>of</strong> 23 randomised trials.<br />
Lancet 2003; 361: 13-20<br />
11 January 28, 2010|Volume 2|Issue 1|
Saeed M et al . Reperfusion injury on MR and MDCT imaging<br />
Kloner RA, Rude RE, Carlson N, Maroko PR, DeBoer LW,<br />
Braunwald E. Ultrastructural evidence <strong>of</strong> microvascular<br />
damage and myocardial cell injury after coronary artery<br />
occlusion: which comes first? Circulation 1980; 62: 94 -9 2<br />
7 Gibson CM, Cannon CP, Daley WL, Dodge JT Jr, Alexander<br />
B Jr, Marble SJ, McCabe CH, Raymond L, Fortin T, Poole WK,<br />
Braunwald E. TIMI frame count: a quantitative method <strong>of</strong><br />
assessing coronary artery flow. Circulation 199 ; 93: 879-888<br />
8 Ito H, Taniyama Y, Iwakura K, Nishikawa N, Masuyama<br />
T, Kuzuya T, Hori M, Higashino Y, Fujii K, Minamino T.<br />
Intravenous nicorandil can preserve microvascular integrity<br />
and myocardial viability in patients with reperfused anterior<br />
wall myocardial infarction. J Am Coll Cardiol 1999; 33: 4- 0<br />
9 Gibson CM, Murphy SA, Rizzo MJ, Ryan KA, Marble SJ,<br />
McCabe CH, Cannon CP, Van de Werf F, Braunwald E.<br />
Relationship between TIMI frame count and clinical outcomes<br />
after thrombolytic administration. Thrombolysis In Myocardial<br />
Infarction (TIMI) Study Group. Circulation 1999; 99: 194 -19 0<br />
70 Iwakura K, Ito H, Takiuchi S, Taniyama Y, Nakatsuchi Y,<br />
Negoro S, Higashino Y, Okamura A, Masuyama T, Hori M,<br />
Fujii K, Minamino T. Alternation in the coronary blood flow<br />
velocity pattern in patients with no reflow and reperfused<br />
acute myocardial infarction. Circulation 199 ; 94: 12 9-127<br />
71 Rochitte CE, Lima JA, Bluemke DA, Reeder SB, McVeigh<br />
ER, Furuta T, Becker LC, Melin JA. Magnitude and time<br />
course <strong>of</strong> microvascular obstruction and tissue injury after<br />
acute myocardial infarction. Circulation 1998; 98: 100 -1014<br />
72 Wu KC, Zerhouni EA, Judd RM, Lugo-Olivieri CH, Barouch<br />
LA, Schulman SP, Blumenthal RS, Lima JA. Prognostic<br />
significance <strong>of</strong> microvascular obstruction by magnetic resonance<br />
imaging in patients with acute myocardial infarction.<br />
Circulation 1998; 97: 7 -772<br />
73 Hombach V, Grebe O, Merkle N, Waldenmaier S, Höher M,<br />
Kochs M, Wöhrle J, Kestler HA. Sequelae <strong>of</strong> acute myocardial<br />
infarction regarding cardiac structure and function and their<br />
prognostic significance as assessed by magnetic resonance<br />
imaging. Eur Heart J 200 ; 26: 49- 7<br />
74 Gerber BL, Rochitte CE, Melin JA, McVeigh ER, Bluemke<br />
DA, Wu KC, Becker LC, Lima JA. Microvascular obstruction<br />
and left ventricular remodeling early after acute myocardial<br />
infarction. Circulation 2000; 101: 2734-2741<br />
7 Ito H, Maruyama A, Iwakura K, Takiuchi S, Masuyama T, Hori<br />
M, Higashino Y, Fujii K, Minamino T. Clinical implications<br />
<strong>of</strong> the 'no reflow' phenomenon. A predictor <strong>of</strong> complications<br />
and left ventricular remodeling in reperfused anterior wall<br />
myocardial infarction. Circulation 199 ; 93: 223-228<br />
7 Topol EJ, Yadav JS. Recognition <strong>of</strong> the importance <strong>of</strong><br />
embolization in atherosclerotic vascular disease. Circulation<br />
2000; 101: 70- 80<br />
77 Ørn S, Manhenke C, Greve OJ, Larsen AI, Bonarjee VV,<br />
Edvardsen T, Dickstein K. Microvascular obstruction is a<br />
major determinant <strong>of</strong> infarct healing and subsequent left<br />
ventricular remodelling following primary percutaneous<br />
coronary intervention. Eur Heart J 2009; 30: 1978-198<br />
78 Mewton N, Bonnefoy E, Revel D, Ovize M, Kirkorian G,<br />
Croisille P. Presence and extent <strong>of</strong> cardiac magnetic resonance<br />
microvascular obstruction in reperfused non-ST-elevated<br />
myocardial infarction and correlation with infarct size and<br />
myocardial enzyme release. Cardiology 2009; 113: 0- 8<br />
79 Nijveldt R, H<strong>of</strong>man MB, Hirsch A, Beek AM, Umans VA,<br />
Algra PR, Piek JJ, van Rossum AC. Assessment <strong>of</strong> microvascular<br />
obstruction and prediction <strong>of</strong> short-term remodeling<br />
after acute myocardial infarction: cardiac MR imaging<br />
study. <strong>Radiology</strong> 2009; 250: 3 3-370<br />
80 Saeed M, Higgins CB, Geschwind JF, Wendland MF. T1-relaxation<br />
kinetics <strong>of</strong> extracellular, intracellular and intravascular<br />
MR contrast agents in normal and acutely reperfused<br />
infarcted myocardium using echo-planar MR imaging. Eur<br />
Radiol 2000; 10: 310-318<br />
WJR|www.wjgnet.com<br />
81 van den Bos EJ, Baks T, Moelker AD, Kerver W, van Geuns RJ,<br />
van der Giessen WJ, Duncker DJ, Wielopolski PA. Magnetic<br />
resonance imaging <strong>of</strong> haemorrhage within reperfused<br />
myocardial infarcts: possible interference with iron oxidelabelled<br />
cell tracking? Eur Heart J 200 ; 27: 1 20-1 2<br />
82 O'Regan DP, Ahmed R, Karunanithy N, Neuwirth C,<br />
Tan Y, Durighel G, Hajnal JV, Nadra I, Corbett SJ, Cook<br />
SA. Reperfusion hemorrhage following acute myocardial<br />
infarction: assessment with T2* mapping and effect on<br />
measuring the area at risk. <strong>Radiology</strong> 2009; 250: 91 -922<br />
83 Ganame J, Messalli G, Dymarkowski S, Rademakers FE,<br />
Desmet W, Van de Werf F, Bogaert J. Impact <strong>of</strong> myocardial<br />
haemorrhage on left ventricular function and remodelling<br />
in patients with reperfused acute myocardial infarction. Eur<br />
Heart J 2009; 30: 1440-1449<br />
84 Arheden H, Saeed M, Higgins CB, Gao DW, Bremerich J,<br />
Wyttenbach R, Dae MW, Wendland MF. Measurement <strong>of</strong><br />
the distribution volume <strong>of</strong> gadopentetate dimeglumine at<br />
echo-planar MR imaging to quantify myocardial infarction:<br />
comparison with 99mTc-DTPA autoradiography in rats.<br />
<strong>Radiology</strong> 1999; 211: 98-708<br />
8 Saeed M, Wendland MF, Masui T, Connolly AJ, Derugin N,<br />
Brasch RC, Higgins CB. Myocardial infarction: assessment<br />
with an intravascular MR contrast medium. Work in<br />
progress. <strong>Radiology</strong> 1991; 180: 1 3-1 0<br />
8 Dymarkowski S, Ni Y, Miao Y, Bogaert J, Rademakers F,<br />
Bosmans H, Marchal G. Value <strong>of</strong> t2-weighted magnetic<br />
resonance imaging early after myocardial infarction in dogs:<br />
comparison with bis-gadolinium-mesoporphyrin enhanced<br />
T1-weighted magnetic resonance imaging and functional<br />
data from cine magnetic resonance imaging. Invest Radiol<br />
2002; 37: 77-8<br />
87 Krombach GA, Higgins CB, Chujo M, Saeed M. Blood pool<br />
contrast-enhanced MRI detects suppression <strong>of</strong> microvascular<br />
permeability in early postinfarction reperfusion after nicorandil<br />
therapy. Magn Reson Med 2002; 47: 89 -902<br />
88 Saeed M, Lund G, Wendland MF, Bremerich J, Weinmann<br />
H, Higgins CB. Magnetic resonance characterization <strong>of</strong> the<br />
peri-infarction zone <strong>of</strong> reperfused myocardial infarction<br />
with necrosis-specific and extracellular nonspecific contrast<br />
media. Circulation 2001; 103: 871-87<br />
89 Jackson BM, Gorman JH 3rd, Salgo IS, Moainie SL, Plappert T,<br />
St John-Sutton M, Edmunds LH Jr, Gorman RC. Border zone<br />
geometry increases wall stress after myocardial infarction:<br />
contrast echocardiographic assessment. Am J Physiol Heart<br />
Circ Physiol 2003; 284: H47 -H479<br />
90 Van Leuven SL, Waldman LK, McCulloch AD, Covell JW.<br />
Gradients <strong>of</strong> epicardial strain across the perfusion boundary<br />
during acute myocardial ischemia. Am J Physiol 1994; 267:<br />
H2348-H23 2<br />
91 Pennell D. Myocardial salvage: retrospection, resolution,<br />
and radio waves. Circulation 200 ; 113: 1821-1823<br />
92 Schmidt A, Azevedo CF, Cheng A, Gupta SN, Bluemke DA,<br />
Foo TK, Gerstenblith G, Weiss RG, Marbán E, Tomaselli GF,<br />
Lima JA, Wu KC. Infarct tissue heterogeneity by magnetic<br />
resonance imaging identifies enhanced cardiac arrhythmia<br />
susceptibility in patients with left ventricular dysfunction.<br />
Circulation 2007; 115: 200 -2014<br />
93 Yan AT, Shayne AJ, Brown KA, Gupta SN, Chan CW, Luu<br />
TM, Di Carli MF, Reynolds HG, Stevenson WG, Kwong<br />
RY. Characterization <strong>of</strong> the peri-infarct zone by contrastenhanced<br />
cardiac magnetic resonance imaging is a powerful<br />
predictor <strong>of</strong> post-myocardial infarction mortality. Circulation<br />
200 ; 114: 32-39<br />
94 Saeed M, Bremerich J, Wendland MF, Wyttenbach R, Weinmann<br />
HJ, Higgins CB. Reperfused myocardial infarction as<br />
seen with use <strong>of</strong> necrosis-specific versus standard extracellular<br />
MR contrast media in rats. <strong>Radiology</strong> 1999; 213: 247-2 7<br />
9 Rubenstein JC, Ortiz JT, Wu E, Kadish A, Passman R, Bonow<br />
12 January 28, 2010|Volume 2|Issue 1|
RO, Goldberger JJ. The use <strong>of</strong> periinfarct contrast-enhanced<br />
cardiac magnetic resonance imaging for the prediction <strong>of</strong> late<br />
postmyocardial infarction ventricular dysfunction. Am Heart<br />
J 2008; 156: 498- 0<br />
9 Rodríguez-Sinovas A, Abdallah Y, Piper HM, Garcia-Dorado<br />
D. Reperfusion injury as a therapeutic challenge in patients<br />
with acute myocardial infarction. Heart Fail Rev 2007; 12:<br />
207-21<br />
97 Dong Z, Saikumar P, Weinberg JM, Venkatachalam MA.<br />
Calcium in cell injury and death. Annu Rev Pathol 200 ; 1:<br />
40 -434<br />
98 Saeed M, Lee RJ, Weber O, Do L, Martin A, Ursell P, Saloner<br />
D, Higgins CB. Scarred myocardium imposes additional<br />
burden on remote viable myocardium despite a reduction<br />
in the extent <strong>of</strong> area with late contrast MR enhancement.<br />
Eur Radiol 200 ; 16: 827-83<br />
99 Hashimoto T, Kambara H, Fudo T, Tamaki S, Nohara R,<br />
Takatsu Y, Hattori R, Tokunaga S, Kawai C. Early estimation <strong>of</strong><br />
acute myocardial infarct size soon after coronary reperfusion<br />
using emission computed tomography with technetium-99m<br />
pyrophosphate. Am J Cardiol 1987; 60: 9 2-9 7<br />
100 Wheelan K, Wolfe C, Corbett J, Rude RE, Winniford M, Parkey<br />
RW, Buja LM, Willerson JT. Early positive technetium-99m<br />
stannous pyrophosphate images as a marker <strong>of</strong> reperfusion<br />
after thrombolytic therapy for acute myocardial infarction. Am<br />
J Cardiol 198 ; 56: 2 2-2<br />
101 Mahnken AH, Koos R, Katoh M, Wildberger JE, Spuentrup E,<br />
Buecker A, Günther RW, Kühl HP. Assessment <strong>of</strong> myocardial<br />
viability in reperfused acute myocardial infarction using<br />
1 -slice computed tomography in comparison to magnetic<br />
resonance imaging. J Am Coll Cardiol 200 ; 45: 2042-2047<br />
102 Carlsson M, Ursell PC, Saloner D, Saeed M. Multidetector<br />
computed tomography for characterization <strong>of</strong> calcium<br />
deposits in reperfused myocardial infarction. Acta Radiol<br />
2009; 50: 39 -40<br />
103 Antoniucci D, Valenti R, Migliorini A, Moschi G, Parodi<br />
G, Dovellini EV, Bolognese L, Santoro GM. Comparison <strong>of</strong><br />
impact <strong>of</strong> emergency percutaneous revascularization on<br />
outcome <strong>of</strong> patients > or =7 to those < 7 years <strong>of</strong> age with<br />
acute myocardial infarction complicated by cardiogenic<br />
shock. Am J Cardiol 2003; 91: 14 8-14 1, A<br />
104 Bolognese L, Carrabba N, Santoro GM, Valenti R, Buonamici<br />
P, Antoniucci D. Angiographic findings, time course <strong>of</strong><br />
regional and global left ventricular function, and clinical<br />
outcome in diabetic patients with acute myocardial infarction<br />
treated with primary percutaneous transluminal coronary<br />
angioplasty. Am J Cardiol 2003; 91: 44- 49<br />
10 Hard<strong>of</strong>f R, Shefer A, Gips S, Merdler A, Flugelman MY,<br />
Halon DA, Lewis BS. Predicting late restenosis after<br />
coronary angioplasty by very early (12 to 24 h) thallium-201<br />
scintigraphy: implications with regard to mechanisms <strong>of</strong> late<br />
coronary restenosis. J Am Coll Cardiol 1990; 15: 148 -1492<br />
10 Wijns W, Serruys PW, Reiber JH, de Feyter PJ, van den<br />
Brand M, Simoons ML, Hugenholtz PG. Early detection<br />
<strong>of</strong> restenosis after successful percutaneous transluminal<br />
coronary angioplasty by exercise-redistribution thallium<br />
scintigraphy. Am J Cardiol 198 ; 55: 3 7-3 1<br />
107 Holmes DR Jr. Very early prediction <strong>of</strong> restenosis after<br />
successful coronary angioplasty: how early is early and can<br />
we identify it? J Am Coll Cardiol 1990; 15: 2 -2<br />
108 Rodés-Cabau J, Candell-Riera J, Domingo E, Castell-Conesa J,<br />
Anívarro I, Angel J, Aguadé-Bruix S, Padilla F, Soto A, Soler-<br />
Soler J. Frequency and clinical significance <strong>of</strong> myocardial<br />
ischemia detected early after coronary stent implantation. J<br />
Nucl Med 2001; 42: 17 8-1772<br />
109 Jaffe R, Haim SB, Karkabi B, Front A, Gips S, Weisz G,<br />
Khader N, Merdler A, Flugelman MY, Halon DA, Lewis<br />
BS. Myocardial perfusion abnormalities early (12-24 h)<br />
after coronary stenting or balloon angioplasty: implications<br />
WJR|www.wjgnet.com<br />
Saeed M et al . Reperfusion injury on MR and MDCT imaging<br />
regarding pathophysiology and late clinical outcome.<br />
Cardiology 2002; 98: 0-<br />
110 Bahrmann P, Werner GS, Heusch G, Ferrari M, Poerner TC,<br />
Voss A, Figulla HR. Detection <strong>of</strong> coronary microembolization<br />
by Doppler ultrasound in patients with stable angina pectoris<br />
undergoing elective percutaneous coronary interventions.<br />
Circulation 2007; 115: 00- 08<br />
111 Skyschally A, Schulz R, Erbel R, Heusch G. Reduced coronary<br />
and inotropic reserves with coronary microembolization. Am J<br />
Physiol Heart Circ Physiol 2002; 282: H 11-H 14<br />
112 Porto I, Selvanayagam JB, Van Gaal WJ, Prati F, Cheng<br />
A, Channon K, Neubauer S, Banning AP. Plaque volume<br />
and occurrence and location <strong>of</strong> periprocedural myocardial<br />
necrosis after percutaneous coronary intervention: insights<br />
from delayed-enhancement magnetic resonance imaging,<br />
thrombolysis in myocardial infarction myocardial perfusion<br />
grade analysis, and intravascular ultrasound. Circulation<br />
200 ; 114: 2- 9<br />
113 Anderson JL, Adams CD, Antman EM, Bridges CR, Califf<br />
RM, Casey DE Jr, Chavey WE 2nd, Fesmire FM, Hochman JS,<br />
Levin TN, Linc<strong>of</strong>f AM, Peterson ED, Theroux P, Wenger NK,<br />
Wright RS, Smith SC Jr, Jacobs AK, Adams CD, Anderson<br />
JL, Antman EM, Halperin JL, Hunt SA, Krumholz HM,<br />
Kushner FG, Lytle BW, Nishimura R, Ornato JP, Page RL,<br />
Riegel B. ACC/AHA 2007 guidelines for the management<br />
<strong>of</strong> patients with unstable angina/non-ST-Elevation<br />
myocardial infarction: a report <strong>of</strong> the American College <strong>of</strong><br />
Cardiology/American Heart Association Task Force on<br />
Practice Guidelines (Writing Committee to Revise the 2002<br />
Guidelines for the Management <strong>of</strong> Patients With Unstable<br />
Angina/Non-ST-Elevation Myocardial Infarction) developed<br />
in collaboration with the American College <strong>of</strong> Emergency<br />
Physicians, the Society for Cardiovascular Angiography<br />
and Interventions, and the Society <strong>of</strong> Thoracic Surgeons<br />
endorsed by the American Association <strong>of</strong> Cardiovascular<br />
and Pulmonary Rehabilitation and the Society for Academic<br />
Emergency Medicine. J Am Coll Cardiol 2007; 50: e1-e1 7<br />
114 Carlsson M, Martin AJ, Ursell PC, Saloner D, Saeed M.<br />
Magnetic resonance imaging quantification <strong>of</strong> left ventricular<br />
dysfunction following coronary microembolization. Magn<br />
Reson Med 2009; 61: 9 - 02<br />
11 Nassenstein K, Breuckmann F, Bucher C, Kaiser G, Konorza<br />
T, Schäfer L, Konietzka I, de Greiff A, Heusch G, Erbel R,<br />
Barkhausen J. How much myocardial damage is necessary<br />
to enable detection <strong>of</strong> focal late gadolinium enhancement at<br />
cardiac MR imaging? <strong>Radiology</strong> 2008; 249: 829-83<br />
11 Breuckmann F, Nassenstein K, Bucher C, Konietzka I, Kaiser<br />
G, Konorza T, Naber C, Skyschally A, Gres P, Heusch G,<br />
Erbel R, Barkhausen J. Systematic analysis <strong>of</strong> functional<br />
and structural changes after coronary microembolization: a<br />
cardiac magnetic resonance imaging study. JACC Cardiovasc<br />
Imaging 2009; 2: 121-130<br />
117 Selvanayagam JB, Cheng AS, Jerosch-Herold M, Rahimi K,<br />
Porto I, van Gaal W, Channon KM, Neubauer S, Banning AP.<br />
Effect <strong>of</strong> distal embolization on myocardial perfusion reserve<br />
after percutaneous coronary intervention: a quantitative<br />
magnetic resonance perfusion study. Circulation 2007; 116:<br />
14 8-14 4<br />
118 Ricciardi MJ, Wu E, Davidson CJ, Choi KM, Klocke FJ,<br />
Bonow RO, Judd RM, Kim RJ. Visualization <strong>of</strong> discrete<br />
microinfarction after percutaneous coronary intervention<br />
associated with mild creatine kinase-MB elevation. Circulation<br />
2001; 103: 2780-2783<br />
119 Choi JW, Gibson CM, Murphy SA, Davidson CJ, Kim<br />
RJ, Ricciardi MJ. Myonecrosis following stent placement:<br />
association between impaired TIMI myocardial perfusion<br />
grade and MRI visualization <strong>of</strong> microinfarction. Catheter<br />
Cardiovasc Interv 2004; 61: 472-47<br />
120 Selvanayagam JB, Porto I, Channon K, Petersen SE, Francis<br />
13 January 28, 2010|Volume 2|Issue 1|
Saeed M et al . Reperfusion injury on MR and MDCT imaging<br />
JM, Neubauer S, Banning AP. Troponin elevation after<br />
percutaneous coronary intervention directly represents<br />
the extent <strong>of</strong> irreversible myocardial injury: insights from<br />
cardiovascular magnetic resonance imaging. Circulation 200 ;<br />
111: 1027-1032<br />
121 Caraballo V. Fatal myocardial infarction resulting from<br />
coronary artery septic embolism after abortion: unusual<br />
cause and complication <strong>of</strong> endocarditis. Ann Emerg Med<br />
1997; 29: 17 -177<br />
122 Garg RK, Jolly N. Acute myocardial infarction secondary to<br />
thromboembolism in a patient with atrial fibrillation. Int J<br />
Cardiol 2007; 123: e18-e20<br />
123 Quinn EG, Fergusson DJ. Coronary embolism following<br />
aortic and mitral valve replacement: successful management<br />
with abciximab and urokinase. Cathet Cardiovasc Diagn 1998;<br />
43: 4 7-4 9<br />
124 Takenaka T, Horimoto M, Igarashi K, Yoshie H, Tsujino I,<br />
Morihira M. Multiple coronary thromboemboli complicating<br />
valvular heart disease and atrial fibrillation. Am Heart J<br />
199 ; 131: 194-19<br />
WJR|www.wjgnet.com<br />
12 Yutani C, Imakita M, Ueda-Ishibashi H, Katsuragi M, Fujita H.<br />
Coronary artery embolism with special reference to invasive<br />
procedures as the source. Mod Pathol 1992; 5: 244-249<br />
12 Erbel R. Spontaneous and interventional coronary microembolisation.<br />
Heart 2003; 89: 98 -989<br />
127 Mandell BF. Cardiovascular involvement in systemic lupus<br />
erythematosus. Semin Arthritis Rheum 1987; 17: 12 -141<br />
128 Westwood MA, Shah F, Anderson LJ, Strange JW, Tanner<br />
MA, Maceira AM, Howard J, Porter JB, Walker JM, Wonke<br />
B, Pennell DJ. Myocardial tissue characterization and the<br />
role <strong>of</strong> chronic anemia in sickle cell cardiomyopathy. J Magn<br />
Reson Imaging 2007; 26: 4- 8<br />
129 Bello D, Fieno DS, Kim RJ, Pereles FS, Passman R, Song G,<br />
Kadish AH, Goldberger JJ. Infarct morphology identifies<br />
patients with substrate for sustained ventricular tachycardia.<br />
J Am Coll Cardiol 200 ; 45: 1104-1108<br />
130 Carlsson M, Saloner D, Martin A, Ursell P, Saeed M. Heterogeneous<br />
microinfarcts caused by coronary microemboli:<br />
Evaluation with multidetector CT and MR imaging in swine<br />
model. <strong>Radiology</strong> 2010; In press<br />
S- Editor Wang JL L- Editor Webster JR E- Editor Zheng XM<br />
14 January 28, 2010|Volume 2|Issue 1|
W J R<br />
Online Submissions: http://www.wjgnet.com/1949-8470<strong>of</strong>fice<br />
wjr@wjgnet.com<br />
doi:10.4329/wjr.v2.i1.15<br />
Hui-Xiong Xu, MD, PhD, Series Editor<br />
Contrast enhanced ultrasound <strong>of</strong> renal masses<br />
Andre Ignee, Bernd Straub, Gudrun Schuessler, Christoph Frank Dietrich<br />
Andre Ignee, Gudrun Schuessler, Christoph Frank Dietrich,<br />
2nd Department <strong>of</strong> Internal Medicine, Caritas Krankenhaus,<br />
Uhlandstrasse 7, 97980 Bad Mergentheim, Germany<br />
Bernd Straub, Department <strong>of</strong> Urology, Caritas Krankenhaus,<br />
97980 Bad Mergentheim, Germany<br />
Author contributions: All authors contributed to this article.<br />
Correspondence to: Christoph Frank Dietrich, Pr<strong>of</strong>essor, 2nd<br />
Department <strong>of</strong> Internal Medicine, Caritas Krankenhaus, Uhlandstrasse<br />
7, 97980 Bad Mergentheim,<br />
Germany. christoph.dietrich@ckbm.de<br />
Telephone: +49-7931-582201 Fax: +49-7931-582290<br />
Received: December 19, 2009 Revised: January 20, 2010<br />
Accepted: January 22, 2010<br />
Published online: January 28, 2010<br />
Abstract<br />
Contrast enhanced ultrasound (CEUS) has gained clinical<br />
importance over the last years for the characterization<br />
<strong>of</strong> hepatic masses. Its role in extrahepatic indications<br />
has been investigated repeatedly but has been less<br />
comprehensively studied. Currently more than 50%<br />
<strong>of</strong> renal masses are incidentally diagnosed, mostly<br />
by B-mode ultrasound. The method <strong>of</strong> choice for<br />
characterization <strong>of</strong> renal lesions is contrast enhanced<br />
computed tomography (CECT). In the case <strong>of</strong> cystic<br />
lesions CECT refers to the Bosniak classification for<br />
cystic lesions to assess the risk <strong>of</strong> malignant behavior.<br />
The majority <strong>of</strong> masses are renal cell carcinoma, but the<br />
exact proportion is controversial. Disadvantages <strong>of</strong> CECT<br />
are a significant risk for patients with impaired renal<br />
function, allergic reactions and hyperthyroidism due to<br />
iodinated contrast agents. Several studies concerning<br />
CEUS for the characterization <strong>of</strong> both solid and cystic<br />
renal lesions have been published, but prospective<br />
multicenter studies are missing, the presented data<br />
being mainly descriptive. The aim <strong>of</strong> the this manuscript<br />
is to review the current literature for CEUS in renal<br />
masses, to summarize the available data and focus on<br />
possible concepts for studies in the future.<br />
WJR|www.wjgnet.com<br />
<strong>World</strong> <strong>Journal</strong> <strong>of</strong><br />
<strong>Radiology</strong><br />
© 2010 Baishideng. All rights reserved.<br />
Key words: Contrast enhanced ultrasound; Renal cell<br />
carcinoma; Angiomyolipoma; Oncocytoma; Sonovue;<br />
Biopsy<br />
Peer reviewers: Herwig R Cerwenka, Pr<strong>of</strong>essor, MD, Department<br />
<strong>of</strong> Surgery, Medical University <strong>of</strong> Graz, Auenbruggerplatz<br />
29, A-8036 Graz, Austria; Yasunori Minami, MD, PhD, Division<br />
<strong>of</strong> <strong>Gastroenterology</strong> and Hepatology, Department <strong>of</strong> Internal<br />
Medicine, 377-2 Ohno-higashi Osaka-sayama Osaka 589-8511,<br />
Japan<br />
Ignee A, Straub B, Schuessler G, Dietrich CF. Contrast enhanced<br />
ultrasound <strong>of</strong> renal masses. <strong>World</strong> J Radiol 2010; 2(1): 15-31<br />
Available from: URL: http://www.wjgnet.com/1949-8470/full/v2/<br />
i1/15.htm DOI: http://dx.doi.org/10.4329/wjr.v2.i1.15<br />
INTRODUCTION<br />
<strong>World</strong> J Radiol 2010 January 28; 2(1): 15-31<br />
ISSN 1949-8470 (online)<br />
© 2010 Baishideng. All rights reserved.<br />
TOPIC HIGHLIGHT<br />
Ultrasound (US) is the most frequently used imaging<br />
method since it is inexpensive, has no side effects and is<br />
widely available. The majority <strong>of</strong> asymptomatically diagnosed<br />
renal tumors are detected by US. Nevertheless, to<br />
date the standard method for staging purposes is contrast<br />
enhanced computed tomography (CECT). Contrast<br />
enhanced US (CEUS) has been introduced for diagnostic<br />
imaging in the liver, heart, pancreas, trauma and several<br />
other organs. Contrast agents are used for CECT and<br />
magnetic resonance imaging (MRI) techniques, and increase<br />
the sensitivity and specificity <strong>of</strong> these techniques.<br />
US contrast agents have been introduced relatively recently.<br />
They consist <strong>of</strong> microbubbles with a size similar<br />
to an erythrocyte. They resonate in the US beam and<br />
change the backscattered wave resulting in both an enhancement<br />
and a change in the waveform. This enables<br />
a selective presentation <strong>of</strong> contrast information. Both<br />
agents are usually given in a single bolus followed by a<br />
rapid saline flush intravenously, but extravascular use<br />
15 January 28, 2010|Volume 2|Issue 1|
Ignee A et al . CEUS <strong>of</strong> renal masses<br />
has been described [1] . Whereas SHU 508A (Levovist ® ), a<br />
first generation contrast agent has some affinity with the<br />
reticuloendothelial system, BR1 (Sonovue ® ), a second<br />
generation contrast agent is a strictly vascular contrast<br />
agent. In contrast to SHU 508A, BR1 allows real time<br />
imaging because <strong>of</strong> the higher stability <strong>of</strong> the microbubbles,<br />
which contain an inert gas. Studies using SHU<br />
508A could be confirmed with BR1.<br />
Detection and characterization <strong>of</strong> focal liver lesions<br />
are the single most important application <strong>of</strong> CEUS in<br />
the abdomen [2,3] . CEUS now equals CECT, and in some<br />
instances exceeds it, in accuracy. Its use for renal evaluation<br />
has been less comprehensively studied. Several studies<br />
indicate also a role for CEUS in the characterization <strong>of</strong><br />
renal masses and renal cell carcinoma (RCC) but the results<br />
are controversial [4] . The aim <strong>of</strong> this study is to analyze the<br />
role <strong>of</strong> CEUS in renal masses referring to the literature<br />
and our own experience.<br />
RENAL MASSES<br />
Cancer <strong>of</strong> the kidney represents about 2% <strong>of</strong> human all<br />
cancers. In Africa and Asia the incidence is lower than in<br />
Northern America and Western Europe. The incidence<br />
and detection <strong>of</strong> asymptomatic renal masses has increased<br />
over the last 25 years - e.g. by 38% in the United States<br />
<strong>of</strong> America between 1974 and 1990. Apart from an<br />
increase in average body weight and other risk factors, this<br />
is the result <strong>of</strong> improved imaging technology as well as<br />
improved understanding <strong>of</strong> the clinical and pathological<br />
findings <strong>of</strong> RCC [5-9] . It can be shown that the survival<br />
rate has improved over the years as a result <strong>of</strong> earlier<br />
diagnosis [7,10-12] . To date, most (61%) renal masses are<br />
found incidentally [13] . From the diagnostic point <strong>of</strong> view,<br />
in the case <strong>of</strong> a focal renal lesion, the following entities<br />
must be taken into account (Figure 1): neoplastic lesions,<br />
non-neoplastic lesions or masses (e.g. inflammatory,<br />
traumatic, ischemic lesions, simple and complicated non<br />
neoplastic cysts), and pseudotumors/lesions.<br />
Neoplastic lesions can be divided into primary lesions<br />
that originate from the renal parenchyma or from the<br />
urinary system in the renal pelvis, and secondary lesions<br />
such as metastases, lymphoma, plasmocytoma, leukemia,<br />
and lesions close to the renal parenchyma e.g. urothelial/<br />
transitional cell carcinoma, adrenal lesions, and retroperitoneal<br />
lesions which mimic true renal lesions. The <strong>World</strong><br />
Health Organization (WHO) distinguishes primary tumors<br />
<strong>of</strong> the kidney into renal cell tumors, metanephric<br />
tumors, nephroblastic tumors, mesenchymal tumors, neural/neuroendocrine<br />
tumors, hemotologic lesions, germ<br />
cell tumors.<br />
In the following section the most frequent renal<br />
lesions (renal cell carcinoma, angiomyolipoma (AML),<br />
oncocytoma, renal adenoma) are presented. Table 1<br />
presents an overview <strong>of</strong> rare renal tumors according to<br />
the current WHO classification.<br />
Malignant tumors<br />
Renal cell carcinoma: Renal cell lesions can be separated<br />
WJR|www.wjgnet.com<br />
into RCC with its several subtypes, papillary adenoma and<br />
oncocytoma. This strict pathological organization is not<br />
suitable for imaging purposes. The majority <strong>of</strong> masses<br />
seen in imaging methods consist <strong>of</strong> renal cell tumors<br />
(RCC, oncocytomas, cystic lesions), metanephric tumors<br />
(metanephric adenomas), mesenchymal tumors (AML),<br />
secondary lesions (e.g. metastases), and inflammatory<br />
lesions.<br />
The typical triad <strong>of</strong> flank pain, hematuria and flank<br />
mass is uncommon (about 10%) and is a sign <strong>of</strong> an<br />
advanced stage <strong>of</strong> disease. Syndromes such as hypercalcemia,<br />
Stauffer syndrome, anemia, and cachexia are<br />
frequently caused by metastatic lesions or paraneoplastic<br />
syndromes [14] .<br />
In 4%-22% <strong>of</strong> autopsied corpses small renal lesions<br />
are found which are malignant or pre-malignant. Patients<br />
are a mean <strong>of</strong> 65 years old at the time <strong>of</strong> diagnosis <strong>of</strong><br />
RCC, and the majority is older than 40 years [15] . In up<br />
to 20% <strong>of</strong> RCC > 3 cm, synchronous RCC are found<br />
in the same kidney. Even small tumors grow in size and<br />
metastasize and there is a benefit for the patients if they<br />
undergo surgery at an early stage [7,16-21] .<br />
RCC are reported to grow at a rate <strong>of</strong> about 0.4 cm<br />
per year [17,22] , but this depends on the size <strong>of</strong> the lesion.<br />
In a retrospectively reviewed series <strong>of</strong> 63 consecutive<br />
patients with observational treatment for renal cancer<br />
(mean age 77 years) with a mean tumor size <strong>of</strong> 4.3 cm,<br />
there was a 5-year cancer-specific survival <strong>of</strong> 93% and<br />
an overall survival <strong>of</strong> 43%. The mean annual growth rate<br />
was < 1 cm in 85% <strong>of</strong> cases. In patients with tumors ≤<br />
4 cm only 4% had a growth rate <strong>of</strong> > 1 cm/year but this<br />
was significantly higher for lesions > 4 cm. The authors<br />
conclude that observational strategies for small RCC in<br />
older and comorbid patients can give acceptable results<br />
in a period <strong>of</strong> 5 years [23] .<br />
Radical nephrectomy has been the standard for<br />
treatment <strong>of</strong> RCC. The parenchyma-sparing therapy<br />
proved to have a survival rate comparable to that for<br />
nephrectomy and is now considered to be the method<br />
<strong>of</strong> choice for small lesions. Arguments against this<br />
therapeutic approach are that 7%-11% <strong>of</strong> tumors appear<br />
multifocally and the local tumor recurrence rate is<br />
4%-10% [24] . The rate <strong>of</strong> multicentricity for tumors ≤<br />
3 cm has been shown to be less than 3%. Thus parenchyma-sparing<br />
surgery should be considered when a<br />
small tumor is confined to the renal parenchyma and is<br />
encapsulated [25] .<br />
RCC can be divided into 4 subtypes, each developing<br />
from a different origin cell: clear cell RCC, papillary<br />
RCC, chromophobic RCC and collecting duct RCC.<br />
Clear cell RCC is the most frequent subtype <strong>of</strong> RCC.<br />
Multilocular (cystic) RCC consist entirely <strong>of</strong> cysts and<br />
the number <strong>of</strong> clear cell carcinoma cells is small whereas<br />
cysts in ordinary RCC are frequent; it cannot be distinguished<br />
from cystic clear cell RCC and should, therefore,<br />
be resected. Papillary RCC comprise 10% <strong>of</strong> RCC. Bilaterality<br />
is more frequent than in other RCC. There is<br />
a hereditary type, where multiple microscopic tumors<br />
16 January 28, 2010|Volume 2|Issue 1|
Primary renal<br />
tumors<br />
Renal cell<br />
tumors<br />
Metanephric<br />
tumors<br />
Nephroblastic<br />
tumors<br />
Mesenchymal<br />
tumors<br />
Neural/<br />
neuroendocrine<br />
tumors<br />
Germ<br />
cell tumors<br />
Metastases<br />
Neoplastic<br />
lesions<br />
are described. In angiographic studies, hypovascularity<br />
has been demonstrated which could be reproduced by<br />
CECT [26,27] . Chromophobe RCC comprises about 5%<br />
<strong>of</strong> RCC. A hereditary form exists also, and most <strong>of</strong> the<br />
tumors have a good prognosis. Typically, they are large<br />
and do not show necrosis or calcification. RCC <strong>of</strong> the<br />
collecting ducts <strong>of</strong> Bellini are a rare entity. Most patients<br />
show metastasis at the time <strong>of</strong> diagnosis. Renal medullary<br />
carcinoma is a rare entity as well. Those tumors are<br />
typically seen in young people with sickle cell disease; the<br />
prognosis is poor. Other rare entities are: (1) RCC associated<br />
with Xp11.2 translocations/TFE3 gene fusions;<br />
(2) RCC associated with neuroblastoma which appear<br />
in long term survivors <strong>of</strong> childhood neuroblastoma; (3)<br />
mucinous RCC; and (4) spindle cell RCC.<br />
Unclassified RCC appear in 5% <strong>of</strong> patients in surgical<br />
series. This category contains tumors with varied appearances<br />
and sometimes a sarcomatoid change is found.<br />
Bilateral RCC appear in about 5% <strong>of</strong> all patients with<br />
RCC. They are hereditary in about 10% (von-Hippel-<br />
Lindau-disease, hereditary papillary RCC, hereditary clear<br />
cell RCC). Bilateral oncocytomas are described also. The<br />
survival rate is similar to that <strong>of</strong> patients with singular<br />
RCC. Metachronous lesions can appear years later [28] .<br />
Metastases and lymphomas<br />
Typically renal metastases are detected when a nonrenal<br />
malignancy progresses [29] , and the median survival is low<br />
when renal metastases occur [30] . However, patients can<br />
present with a single renal metastasis without symptoms<br />
<strong>of</strong> tumor progression in follow-up investigations after a<br />
WJR|www.wjgnet.com<br />
Secondary renal<br />
tumors<br />
Figure 1 Differential diagnosis <strong>of</strong> renal masses.<br />
Haematologic<br />
lesions<br />
Lymphoma<br />
Plasmocytoma<br />
Leukemia<br />
Extrarenaltumors<br />
Adrenal tumors<br />
Transitional cell<br />
tumors<br />
Retroperitoneal<br />
tumors<br />
Masses<br />
Non-neoplastic<br />
Non-neoplasric<br />
lesions<br />
Infarction<br />
Trauma<br />
Ischaemic<br />
lesions<br />
Ischaemic lesions<br />
(e.g. abscess)<br />
Cyts<br />
Ignee A et al . CEUS <strong>of</strong> renal masses<br />
Pseudolesion<br />
Pseudotumors<br />
(anatomical<br />
variants)<br />
long period <strong>of</strong> stable disease [31,32] . Renal metastases from<br />
bronchogenic carcinoma, breast cancer, colon cancer,<br />
esophageal cancer, hepatocellular carcinoma, pancreatic<br />
adenocarcinoma, prostatic cancer, follicular and papillary<br />
thyroid carcinoma have been reported [32-39] .<br />
Secondary renal lymphomas are 30-fold more frequent<br />
than primary renal lymphoma without evidence<br />
<strong>of</strong> systemic involvement. They are mostly present in the<br />
advanced stages <strong>of</strong> the disease. Also, a plasmocytoma<br />
can occur as a manifestation <strong>of</strong> a disseminated multiple<br />
myeloma. In contrast to RCC metastases are suggestive<br />
if they show the following imaging features: (1) < 3 cm;<br />
(2) not totally spheric, sometimes wedge-shaped; (3)<br />
signs <strong>of</strong> “infiltrative” growth; (4) bilateral multiple; (5)<br />
no encapsulation; and (6) no calcification [40-42] .<br />
They <strong>of</strong>ten appear hypoenhanced in contrast enhanced<br />
studies [29] . The group around Lassau and Lamuraglia<br />
were able to monitor the response <strong>of</strong> advanced RCC<br />
to antiangiogenetic therapy with Sorafenib in a heterogeneous<br />
group including 2/30 patients (7%) with<br />
contralateral renal metastases. Nevertheless, there was no<br />
description <strong>of</strong> the enhancement pattern in CEUS before<br />
therapy. The group suggested quantitative CEUS for<br />
monitoring antiangiogenetic drug effectiveness which has<br />
been also proposed by our group [43] . In our experience,<br />
metastases in CEUS are typically hypovascular in more<br />
than 80% <strong>of</strong> cases. Since metastases typically do represent<br />
advanced tumor stages histologically proven elsewhere, we<br />
can only refer to one histologically proven metastasis in<br />
our patients which was hypoenhancing both in the arterial<br />
and late phase (unpublished data).<br />
17 January 28, 2010|Volume 2|Issue 1|
Ignee A et al . CEUS <strong>of</strong> renal masses<br />
Table 1 Rare renal tumors according to the current WHO classification [76]<br />
Entity Dignity Clinical meaning<br />
Renal cell tumors<br />
RCC associated with neuroblastoma Malignant Long term survivors <strong>of</strong> childhood neuroblastoma<br />
Nephroblastic tumors<br />
Nephroblastoma Malignant Malignant embryonal neoplasm; 1:8000 children, 98% < 10 yr; if treated excellent<br />
prognosis = Wilm’s tumor<br />
Nephrogenic rests and nephroblastomatosis Malignant<br />
potential<br />
Metastases in the kidney appear in advanced tumor<br />
stages and should be expected in the case <strong>of</strong> a hypoenhancing<br />
mass and/or evidence <strong>of</strong> a primary tumor. Biopsy<br />
can be discussed to rule out a secondary malignancy if<br />
this leads to therapeutic consequences. The evidence in<br />
the CEUS literature is rare.<br />
Benign renal tumors<br />
Angiomyolipoma (AML): The prevalence <strong>of</strong> AML<br />
(hamartomas) reported in the literature varies from<br />
WJR|www.wjgnet.com<br />
Nephrogenic rests in 1% <strong>of</strong> infant autopsies; possible transformation into<br />
nephroblastoma<br />
Mesenchymal tumors in children<br />
Ossifying renal tumor <strong>of</strong> infants Benign 12 cases reported, mostly in children < 18 mo<br />
Clear cell sarcoma Malignant Typically bone metastasis, metastases can develop late<br />
Rhabdoid tumor Malignant Highly invasive; 80% ≤ 2 yr; 2 yr survival rate < 20%<br />
Congenital mesoblastic nephroma<br />
Mesenchymal tumors in adults<br />
Malignant Excellent prognosis when completely excised; recurrence rate 5%; metastases in<br />
rare cases<br />
Leiomyoma Benign Arises typically from the renal capsule; incidental tumors < 10 mm, but sometimes<br />
large<br />
Hemangioma Benign No mitosis and nuclear pleomorphism<br />
Lymphangioma Benign Presenting as a peripelvic or renal sinus mass. Some cases may develop secondary<br />
to inflammatory lower urinary tract diseases; cystic<br />
Juxtaglomerular cell tumor Benign Benign rennin-secreting tumor → hypertension; about 70 tumors described;<br />
typically < 3 cm<br />
Renomedullary interstitial cell tumor Benign Common autopsy findings in adults; > 1 tumor in 50%; < 5 mm<br />
Intrarenal Schwannoma Benign Common benign tumor <strong>of</strong> peripheral and auditory nerves<br />
Cystic nephroma Benign Cystic; female >> male<br />
Mixed epithelial and stromal tumor Benign Complex renal neoplasm; contains large cysts<br />
Neuroblastoma Benign<br />
Solitary fibrous tumor Malignant<br />
potential<br />
Frequent painless hematuria; confused with RCC<br />
Paraganglioma/phaeochromocytoma Malignant<br />
potential<br />
Leimyosarcoma (incl. renal vein) Malignant The most common renal sarcoma; 5-yr survival rate 35%; chemotherapy is<br />
ineffective<br />
Osteosarcoma Malignant<br />
Angiosarcoma Malignant Rare, aggressive; poor prognosis; strong male predominance, androgen factor<br />
possible; rapid metastases<br />
Hemangiopericytoma Malignant<br />
Malignant fibrous histiocytoma Malignant Pararenal and retroperitoneal extension<br />
Synovial sarcoma Malignant Characterized by a specific translocation: t (X; 18)(p11.2; q11); recurrence is<br />
commonly seen<br />
Renal carcinoid tumor Malignant Association with horseshoe kidney; carcinoid syndrome < 10%; cystic, calcification<br />
Neuroendocrine carcinoma Malignant Poorly differentiated epithelial NPL with neuroendocrine differentiation; poor<br />
prognosis; necrotic mass<br />
Primitive neuroectodermal tumor (Ewing sarcoma)<br />
Plasmocytoma, Lymphoma and Leukemia<br />
Malignant Inhomogeneous, <strong>of</strong>ten replacing the entire kidney; hemorrhage, necrosis<br />
Lymphoma Malignant Typically secondary renal lymphomas; primary renal lymphoma very rare<br />
Plasmocytoma Malignant Occurs as a manifestation <strong>of</strong> a disseminated multiple myeloma<br />
Leukemia<br />
Germ cell tumors<br />
Malignant Interstitial infiltration <strong>of</strong> leukemic cells can be called extramedullary leukemia in<br />
the kidney<br />
Teratoma Benign<br />
Choriocarcinoma Malignant Difficult to differentiate from high grade urothelial carcinomas; mostly metastases<br />
from testicular germ cell tumors<br />
RCC: Renal cell carcinoma; NPL: Neoplasia; >>: Much more frequent or predominantly seen in female.<br />
0.03%-0.07% [44] . They are composed <strong>of</strong> a variable proportion<br />
<strong>of</strong> adipose tissue, spindle and epithelioid smooth<br />
muscle cells and abnormal thick-walled blood vessels.<br />
AML can occur in patients with tuberous sclerosis. They<br />
belong to a family <strong>of</strong> lesions characterized by proliferation<br />
<strong>of</strong> perivascular epithelioid cells (PEC). Clonality<br />
could be shown. There is onset <strong>of</strong> AML after puberty<br />
as well as a progesterone receptor immunoreactivity in<br />
AML. Synchronous occurrence with oncocytomas or<br />
with RCC has been described. Vascular extension up to<br />
18 January 28, 2010|Volume 2|Issue 1|
A<br />
B<br />
C<br />
Figure 2 Histologically proven angiomyolipoma with typical central artery<br />
(which has been also described in some oncocytoma). Doppler US analysis<br />
reveals a relatively low resistance index (A); In CEUS the lesion shows a<br />
hypovascular enhancement (B, C).<br />
the vena cava has also been reported, as well as 3 cases<br />
<strong>of</strong> sarcoma arising in AML [45-47] . Small precursor lesions<br />
consist <strong>of</strong> epithelioid smooth muscle cells whereas the<br />
proportion <strong>of</strong> adipocytes and spindle cells increase when<br />
they grow. Some rare cases are associated with spontaneous<br />
hemorrhage in lesions > 4 cm and in pregnant women.<br />
Epithelioid AML is a malignant variant. More than<br />
50% <strong>of</strong> patients with epithelioid AML have tuberous<br />
sclerosis; the typical patient is 35-40 years old, and onethird<br />
suffer from metastatic disease at the time <strong>of</strong> diagnosis.<br />
Patients frequently present with pain. The tumors<br />
show typically a poor fat content, therefore, in imaging<br />
techniques they are rarely confused with classic AML.<br />
AML are lesions which are frequently found in<br />
screening investigations. In patients investigated at our<br />
hospital the typical sonographic findings <strong>of</strong> AML were<br />
found in about 1% <strong>of</strong> 10 000 consecutive patients (unpublished<br />
data). Diagnosis using unenhanced CT is possible<br />
in most patients with respect to demonstration <strong>of</strong><br />
fat equivalent density. AML represents a diagnostic challenge<br />
for every imaging method in case <strong>of</strong> hemorrhage,<br />
WJR|www.wjgnet.com<br />
Ignee A et al . CEUS <strong>of</strong> renal masses<br />
calcification, arteriovenous shunts (“highly vascular<br />
AML”), necrosis, and low fat content [48,49] .<br />
Up to 14% <strong>of</strong> all AML are wrongly diagnosed with<br />
CECT leading to unnecessary surgery. Papillary RCC<br />
can mimic AML with low fat appearance with homogeneous<br />
enhancement and slow washout [50] . Some authors<br />
suggest nephron-sparing surgery in the case <strong>of</strong> calcified<br />
lesions [51-53] . In US they show a typical snowball-like pronounced<br />
hyperechoic appearance. Up to 25% <strong>of</strong> small<br />
RCC are hyperechoic in comparison to the surrounding<br />
renal parenchyma (own unpublished data). Atypical only<br />
slightly hyperechoic AML are found in 30%, and iso- or<br />
hypoechoic variants in 6%.<br />
Some reports focused on the fat content in renal<br />
cell carcinomas [54-57] . In particular, fat containing renal<br />
tumors can also be lipomas, liposarcomas, and oncocytomas<br />
[58] . Several reasons have been discussed, such as<br />
lipid producing necrosis, intra-tumoral bone metaplasia<br />
containing fatty marrow elements, and entrapment <strong>of</strong><br />
perirenal or sinus fat [57-59] .<br />
In CEUS, AML appear typically as hypoenhancing<br />
with a progressive hypoenhancement in the late phase<br />
(Figure 2 [60-62] ). In other studies, AML showed a wide<br />
range <strong>of</strong> enhancement patterns without sharp discrimination<br />
in comparison to RCC [63] .<br />
The typical AML can be diagnosed with satisfying<br />
accuracy by unenhanced CT. Up to 14% <strong>of</strong> all AML are<br />
atypical and can lead to unnecessary surgery, especially<br />
when hemorrhage, calcification, arteriovenous shunts,<br />
necrosis or low fat content appears. RCC or oncocytoma<br />
can also contain fatty components. In CEUS, AML are<br />
typically less enhancing than RCC but there are overlaps<br />
in the CEUS appearance.<br />
Renal adenoma: In the literature the concept <strong>of</strong> renal<br />
adenoma is controversial. The current WHO classification<br />
only describes papillary and metanephric adenomas,<br />
<strong>of</strong> which papillary adenomas are < 5 mm and, therefore,<br />
do not play a significant role in imaging <strong>of</strong> renal masses.<br />
All renal tumors <strong>of</strong> the clear cell type are considered<br />
malignant [64] since malignant transformation <strong>of</strong> renal<br />
adenomas have been described and genetic predictors<br />
<strong>of</strong> the transformation are unknown [5,27,65-68] . Papillary<br />
adenomas are tumors with low nuclear grade, show no<br />
mitotic figures and are ≤ 5 mm. In autopsy studies they<br />
are found in 10% <strong>of</strong> patients < 40 years old and in 40%<br />
<strong>of</strong> patients > 70 years old. They are typically located below<br />
the renal capsule. They can be multiple and bilateral.<br />
Multiloculated adenomas are called renal adenomatosis.<br />
Metanephric adenoma, aden<strong>of</strong>ibroma and stromal<br />
tumors are rare benign neoplasia with similar features<br />
occurring at different ages. Metanephric stromal tumors<br />
appear only in children, metanephric aden<strong>of</strong>ibroma in<br />
children and young adults and metanephric adenomas<br />
in the young and old. One single case <strong>of</strong> a high grade<br />
sarcoma in association with metanephric adenoma has<br />
been reported [69] . An association <strong>of</strong> metanephric adenomas<br />
with Wilm’s tumor or RCC has been described [70] .<br />
19 January 28, 2010|Volume 2|Issue 1|
Ignee A et al . CEUS <strong>of</strong> renal masses<br />
There are only a few reports on progression <strong>of</strong> these<br />
tumors [66,69] . Typically they have a size <strong>of</strong> 3-6 cm and are<br />
well circumscribed. Hemorrhage and necrosis are common.<br />
Twenty percent show calcification, as well as small<br />
cysts.<br />
In studies using CEUS, metanephric adenomas appeared<br />
in only 2 patients <strong>of</strong> 2 different studies from the<br />
same group [60,61] . The contrast enhanced features revealed<br />
hyperenhancement in the arterial phase but progressive<br />
hypoenhancement in the late phase. Our own data revealed<br />
one metanephric adenoma which showed a rim<br />
enhancement with hypovascular appearance in the arterial<br />
and in the late phase.<br />
Adenoma histology in renal tumors is rare. There is<br />
evidence for malignant transformation in some variants.<br />
Papillary adenoma is ≤ 5 mm. Metanephric adenomas<br />
have no specific imaging features either in CECT or in<br />
CEUS.<br />
Oncocytoma: Histologically, oncocytomas are composed<br />
<strong>of</strong> large cells with mitochondria-rich eosinophilic<br />
neoplasm, and originate from intercalated cells <strong>of</strong> the<br />
distal renal tubules. The entity was first described by<br />
Zippel in 1942. Oncocytosis or oncocytomatosis is a<br />
syndrome with oncocytic tumors, oncocytic changes in<br />
benign tubules, microcysts lined by oncocytic cells and<br />
clusters <strong>of</strong> oncocytes within the renal interstitium [64,71] .<br />
In the current WHO classification, oncocytomas are<br />
considered as benign lesions. Nevertheless there is an<br />
ongoing discussion on cases <strong>of</strong> oncocytomas developing<br />
metastases [72] .<br />
Oncocytomas are difficult to differentiate pathologically<br />
from an eosinophilic variant <strong>of</strong> chromophobe<br />
RCC which itself is considered to have low malignant<br />
potential. In a study by Breda et al [73] a chromophobe<br />
RCC was diagnosed via biopsy as an oncocytoma, and<br />
an oncocytoma was diagnosed via biopsy as an chromophobe<br />
RCC. In a case <strong>of</strong> oncocytosis, a hybrid<br />
oncocytoma/chromophobe RCC lesion was identified<br />
by Al-Saleem et al [74] . The literature concerning the rate<br />
<strong>of</strong> metastatic oncocytomas is weak, in some instances<br />
sometimes lacking histological confirmation <strong>of</strong> the oncocytoma<br />
origin <strong>of</strong> the metastases, and sometimes the<br />
oncocytoma diagnosis was questionable [72,75] . A review<br />
<strong>of</strong> non-urothelial renal tumors revealed 70/954 oncocytomas<br />
(7%) [76] , <strong>of</strong> which 1/70 had an asymptomatic liver<br />
metastasis confirmed by needle biopsy.<br />
In imaging, the diagnosis can also be difficult.<br />
Choudhary et al [77] investigated CECT imaging features<br />
in 21 patients with 28 histologically confirmed oncocytomas.<br />
The lesion size ranged from 1.2-12 cm, mean 4.9<br />
cm. In all lesions contrast enhancement could be detected.<br />
In 64% the enhancement was isodense and in 36%<br />
the enhancement was hypodense in comparison to the renal<br />
cortex. In 5/28 lesions (18%) a central scar could be<br />
identified pathologically, but was detected by CECT only<br />
in 3/28 lesions (11%, lesion size 10-29 mm). The authors<br />
concluded that imaging features fail to demonstrate typi-<br />
WJR|www.wjgnet.com<br />
cal features in oncocytomas. The <strong>of</strong>ten discussed central<br />
scar is seen histologically in 18%-33% <strong>of</strong> tumors and<br />
correlates with the size <strong>of</strong> the lesion [64,77] . It can be confused<br />
with areas without enhancement in RCC (own data:<br />
69% in 300 histologically proven RCC, 40% <strong>of</strong> 20 lesions<br />
published by Wink et al [78] ). Correlation <strong>of</strong> this sign with<br />
tumor size has been published [79] . Therefore, the central<br />
scar sign lacks specificity as well as sensitivity. In the<br />
CEUS literature, the perfusion pattern in patients with<br />
oncocytomas is described by the group around Strobel [4] .<br />
They found a stellate scar in none <strong>of</strong> 3 oncocytoma, 2<br />
<strong>of</strong> 3 (67%) were hypervascular in the arterial phase, 1<br />
<strong>of</strong> 3 (33%) was hypovascular. In the late phase all were<br />
hypoenhancing compared to the surrounding renal parenchyma.<br />
Tamai et al [80] evaluated 29 patients with CEUS,<br />
2/29 (7%) had an oncocytoma. In 50% <strong>of</strong> patients with<br />
an oncocytoma, a spoke-like enhancement pattern could<br />
be demonstrated with CEUS in contrast to CECT. Fan<br />
et al [62] reported that there were no characteristic patterns<br />
in one patient with oncocytoma.<br />
Oncocytomas are benign lesions. Typical but rare<br />
signs for oncocytomas are a spoke-like enhancement<br />
and a central scar. Nevertheless neither in CECT nor in<br />
CEUS can both signs be displayed regularly, and positive<br />
and negative predictive values are low. We suggest<br />
discussing a biopsy in lesions with typical oncocytoma<br />
appearance. Histological diagnosis is also difficult.<br />
Renal pseudotumors: Pseudotumors are mass-like anatomical<br />
variations without pathological significance.<br />
Besides fetal lobation, dromedary or splenic humps, a<br />
proportion <strong>of</strong> pseudotumors is caused by hypertrophied<br />
columns <strong>of</strong> Bertin. Those represent unresorbed polar<br />
parenchyma <strong>of</strong> one or both <strong>of</strong> 2 subkidneys that fuse to<br />
form a normal kidney and contain renal cortex, pyramids,<br />
and columns (septa) <strong>of</strong> Bertin. It can be referred to as<br />
junctional parenchyma [81,82] . In clinical practice, the ability<br />
<strong>of</strong> US and CECT to distinguish between anatomical<br />
variations and real neoplasia is frequently challenging.<br />
Typical US features are: (1) location between the overlapping<br />
portion <strong>of</strong> 2 renal sinus systems; (2) clear definition<br />
from the renal sinus; (3) a size < 3 cm; (4) comparable<br />
echogenicity to the renal parenchyma; (5) the structure<br />
is bordered by a junctional parenchymal line; and (6) the<br />
demonstration <strong>of</strong> regular/branch-like renal blood flow in<br />
the suspected lesion [83] .<br />
Ascenti et al [84] described their experience with contrast<br />
enhanced power Doppler with SHU 508A in 4<br />
patients with renal pseudotumors. They could differentiate<br />
those changes from real neoplastic disease [84] . In<br />
more than 300 patients with renal masses investigated<br />
prospectively with US, color Doppler US (CDUS) and<br />
CEUS at our institution there were 4% histologically<br />
proven pseudotumors which could be reliably differentiated<br />
from real neoplasm. Neoplasia could not be ruled<br />
out with CECT. Nevertheless follow-up investigations<br />
must be performed in certain cases. Several other investigators<br />
have stressed this issue also [62,63,85-90] .<br />
20 January 28, 2010|Volume 2|Issue 1|
A<br />
B<br />
C<br />
Figure 3 Small renal cell carcinoma (13 mm) not detectable by computed<br />
tomography (CT); B-mode reveals an isoechoic lesion without mass effect<br />
(A); contrast enhanced ultrasound (CEUS) in the arterial phase showed the<br />
lesion slightly hypoenhancing (B) and after 33 s isoenhancing (C); 2D Video<br />
shows the transcutaneous biopsy proving clear cell renal cell carcinoma;<br />
consecutively the patient underwent surgery.<br />
In the diagnosis <strong>of</strong> pseudotumors with US there are<br />
different B-mode and CDUS criteria. If in CEUS a normal<br />
perfusion pattern can be distinguished, this represents<br />
a major criterion for the diagnosis <strong>of</strong> a pseudotumor.<br />
Published evidence is limited.<br />
DETECTION OF RENAL MASSES<br />
The accuracy <strong>of</strong> conventional B-mode alone, or in combination<br />
with CDUS in the detection and characterization<br />
<strong>of</strong> renal masses, is considered to be less reliable than<br />
other imaging techniques [91] . This is especially true if they<br />
are not contour deforming [16] . Jamis-Dow et al [6] reported<br />
detection rates for lesions < 30 mm, < 20 mm, and < 10<br />
mm <strong>of</strong> 99%, 95% and 76%, respectively, for CECT. For<br />
US the rates were 95%, 70% and 20%, respectively. In<br />
more recent studies this is controversially discussed. Sixty<br />
patients with renal masses were investigated by Spahn<br />
and co-workers to assess the ability <strong>of</strong> CDUS for staging<br />
WJR|www.wjgnet.com<br />
Ignee A et al . CEUS <strong>of</strong> renal masses<br />
purposes in comparison to CECT and surgical findings<br />
which served as reference methods [92] . The sensitivity <strong>of</strong><br />
CDUS for tumor detection and detection <strong>of</strong> lymph node<br />
metastases was 100%. CDUS was superior to CECT in<br />
the detection <strong>of</strong> renal vein involvement. In a study <strong>of</strong><br />
Dong et al [93] the detection rate with conventional US in<br />
42 patients with clear cell RCC (1.8-11.2 cm) was 30/42<br />
(71%), which could be improved by CEUS to 100%. The<br />
size distribution <strong>of</strong> the lesions is not shown in the article<br />
whereas 33/42 lesions (78%) are referred to as “larger<br />
tumors”. We must admit that the results were not in accordance<br />
with our own experiences. In 143 patients with<br />
renal masses submitted to our hospital with available<br />
histology and accessible CECT imaging there were 3/143<br />
lesions (2%) with a < 15, 25 and 25 mm which were not<br />
detected in CECT but were detected in CEUS (unpublished<br />
data, Figure 3).<br />
A major advantage <strong>of</strong> US in comparison to other<br />
imaging techniques is its ability in the characterization <strong>of</strong><br />
cystic lesions. CECT sometimes fails to differentiate cysts<br />
containing blood or fluids with high protein content and,<br />
therefore, elevated density (in comparison to water). The<br />
detection <strong>of</strong> blood flow is a major issue in the detection<br />
<strong>of</strong> renal masses. Kitamura et al [94] evaluated the ability <strong>of</strong><br />
CDUS in comparison to CECT in the staging <strong>of</strong> renal<br />
solid tumors. They investigated 110 patients with lesions<br />
< 7 cm. In 9/110 patients (8%), CECT showed enhancement<br />
in the cortical nephrographic phase whereas CDUS<br />
showed no flow. In 8/110 patients (7%), CDUS showed<br />
flow whereas CECT showed poor enhancement. Thus it<br />
can be concluded that CDUS has an accuracy for detection<br />
equal to CECT.<br />
US (performed by a sophisticated investigator) has<br />
a detection rate comparable to that <strong>of</strong> CECT but the<br />
evidence is sparse. In the detection <strong>of</strong> blood flow in renal<br />
lesions CDUS, it has comparable sensitivity to CECT.<br />
CEUS is more sensitive than CDUS in the detection <strong>of</strong><br />
blood and has been shown to be superior to CECT in a<br />
limited number <strong>of</strong> patients. Published data are limited.<br />
The majority <strong>of</strong> renal masses are incidentally detected<br />
nowadays. The major issue for each imaging method is<br />
to characterize lesions when this leads to a therapeutic<br />
impact. For CEUS, this could be shown for liver lesions [95]<br />
or pancreatic lesions [96] .<br />
In contrast to liver or pancreas tumors, the characterization<br />
<strong>of</strong> renal tumors is more difficult. There is a<br />
small and heterogeneous proportion <strong>of</strong> benign lesions.<br />
Surgery is believed to be the method <strong>of</strong> choice for each<br />
solid renal lesion because <strong>of</strong> the high rate <strong>of</strong> malignancy.<br />
So most studies for characterization <strong>of</strong> renal masses<br />
with CEUS did not focus on the characterization but on<br />
the staging <strong>of</strong> renal masses with US. In the more recent<br />
literature this strategy is questioned. Particularly in small<br />
lesions (< 4 cm), the proportion <strong>of</strong> benign lesions has<br />
been reported to be higher than 13% [97-102] and histology<br />
obtained by transcutaneous biopsy is reliable and can be<br />
safely performed. An analysis <strong>of</strong> the literature for the<br />
proportion <strong>of</strong> benign lesions is given in Table 2.<br />
21 January 28, 2010|Volume 2|Issue 1|
Ignee A et al . CEUS <strong>of</strong> renal masses<br />
Table 2 Frequency <strong>of</strong> benign lesions in consecutive patients<br />
Author n Benign Angiomyolipomas Oncocytomas Metanephric adenomas Atypical cysts Others Population<br />
[103]<br />
396 5% 1% 7<br />
2% 8<br />
Surgery<br />
[104]<br />
30 17% 13% 3% Ultrasound<br />
[105]<br />
70 26% 1% 4% 14% 7% 3<br />
Biopsy<br />
[106]<br />
40 23% 10% 13% Ultrasound<br />
[107]<br />
35 17% 3% 10% 3% 1<br />
Surgery<br />
[108]<br />
173 14% 4% 8% 2% Surgery<br />
[109]<br />
20 35% 5% 5% 25% 2<br />
Surgery<br />
[110]<br />
78 21% 3% 17% Biopsy<br />
[111]<br />
26 21% 8% 12% Biopsy<br />
[60]<br />
26 31% 27% 4% Ultrasound<br />
[80]<br />
29 10% 3% 7% Ultrasound<br />
[61]<br />
23 34% 30% 4% Ultrasound<br />
[112]<br />
54 21% 4% 11% 6% Biopsy<br />
[113]<br />
97 25% 25% Ultrasound<br />
[4]<br />
30 10% 10% Ultrasound<br />
[114]<br />
99 7% 1% 6% Surgery/Biopsy<br />
[115]<br />
543 15% 5% 6% 0.2% 3% 4<br />
Surgery<br />
[73]<br />
31 13% 10% 3% 5<br />
Surgery<br />
[59]<br />
100 20% 3% 13% 2% 2% 6<br />
Biopsy<br />
[64]<br />
954 7% 7% Surgery<br />
[100]<br />
2770 13% Surgery<br />
[78]<br />
18 33% 11% 22% Ultrasound<br />
Own data (unpublished) 143 15% 3% 1% 1% 1% 8% 9<br />
Ultrasound<br />
Data are given as percentage; N indicates the total number <strong>of</strong> included patients. 1 Leiomyoma; 2 1 abscess, 1 lesion associated with xanthogranulomatous<br />
pyelonephritis, 2 cysts, 1 arteriovenous fistula; 3 1 lesion associated with xanthogranulomatous pyelonephritis, 3 lesions associated with chronic<br />
pyelonephritis, 1 lesion associated with tuberculosis; 4 Leiomyoma 0.9%, papillary adenoma 0.6%, abscess 0.4%, haematoma 0.4%, giant cell fibroblastoma<br />
0.2%, lipoma 0.2%, haemangioma 0.2%; 5 Benign lymphoid infiltrate; 6 Mixed epithelial and stromal tumor; 7 Adenoma, not further specified; 8 Haemangioma<br />
1%, cystic nephroma 0.5%; 9 Abscess 2%, pseudotumour 4%,focal cystic dysplasia 1%, necrosis 1%.<br />
Renal mass biopsy<br />
Since there is a significant proportion <strong>of</strong> lesions with<br />
benign diagnosis especially in small lesions (Table 2),<br />
several studies reported on percutaneous renal mass<br />
biopsy guided either by CECT or US. In the analysis <strong>of</strong><br />
the literature the rates for benign lesions were between<br />
5% and 34% (Table 2). The question, which needle size<br />
to use was discussed by Breda et al [73] . They investigated<br />
intraoperatively 27/31 RCC (87%), 21/31 clear cell RCC<br />
(68%), 3/31 papillary RCC (10%), 3/31 chromophobe<br />
RCC (10%), 3/31 oncocytomas (10%), 1/31 benign<br />
lymphoid infiltrates (3%) with 14, 18 and 20 G core<br />
needle biopsies each after extirpation. They found a<br />
correlation <strong>of</strong> biopsy findings with final histology in 94%,<br />
97% and 81%, respectively. They suggest 18 G to be a<br />
suitable size for renal biopsy. Wang et al [59] investigated the<br />
sufficiency and accuracy <strong>of</strong> percutaneous core biopsy in<br />
renal masses < 4 cm performed with CT or US guidance<br />
(60% vs 40%). A total <strong>of</strong> 110 biopsies were performed, <strong>of</strong><br />
which 100/110 (91%) were sufficient. Histology revealed<br />
35% benign lesions (Table 2). 8/110 complications (7%)<br />
were reported (1 hypotension, 2 hematomas without<br />
intervention, 4 patients with severe pain and 1 with wound<br />
infection). In 34 patients biopsy could be compared with<br />
final surgical histology, and the accuracy was 100% [59] .<br />
Shannon et al [116] investigated renal core biopsies <strong>of</strong> 222<br />
lesions < 5 cm with respect to accuracy in comparison<br />
with surgical histology. The rate <strong>of</strong> diagnostic biopsies<br />
was 78%; 25% <strong>of</strong> the lesions were benign. The accuracy<br />
WJR|www.wjgnet.com<br />
rate in comparison with final surgical histology was 100%.<br />
Significant complications appeared in 0.9% <strong>of</strong> patients.<br />
Kramer et al [117] report on their retrospective analysis<br />
<strong>of</strong> intraoperative biopsies before surgical cryoablation<br />
<strong>of</strong> renal tumors. There were 81/119 patients (68%) in<br />
which one core was taken, 38/119 patients (32%) had 3<br />
cores taken. In the “one core group” 49/81 (60%) were<br />
malignant and 14/81 (17%) were not diagnostic. In the “3<br />
core group” 27/38 (71%) were malignant (P = 0.25) and<br />
2/38 (5%) were not diagnostic (P = 0.03). To increase the<br />
number <strong>of</strong> diagnostic biopsies it is reasonable to project<br />
this strategy to percutaneous biopsies, but there are no<br />
data concerning safety/complications.<br />
As there is a significant proportion <strong>of</strong> benign lesions<br />
there is a need for preoperative histological analysis in<br />
selected cases. The reported rates for diagnostic biopsy<br />
range from 75% to 100%. It could be shown that at least<br />
18 G core biopsies should be used from a histopathological<br />
standpoint but data concerning complications following<br />
multiple biopsies are not available. It could be also proven<br />
that 3 cores in one patient are more sufficient than one<br />
biopsy. This could not be shown for percutaneous biopsies<br />
for ethical reasons.<br />
Differential diagnosis <strong>of</strong> solid renal tumors on US<br />
Unenhanced US: Since B-mode US lacks specific characteristics<br />
to differentiate benign and malignant renal<br />
masses, CDUS characteristics were investigated in several<br />
settings. Habboub et al [118] could demonstrate renal<br />
22 January 28, 2010|Volume 2|Issue 1|
mass perfusion using CDUS in 42 <strong>of</strong> 44 patients (95%).<br />
In 60 patients with renal masses which were investigated<br />
by Spahn and co-workers, equal results were found with<br />
CECT and surgical findings [92] . Kitamura et al [94] evaluated<br />
the ability <strong>of</strong> CDUS in comparison to CECT in the staging<br />
<strong>of</strong> renal solid tumors. They investigated 110 patients<br />
with lesions < 7 cm. In 9/110 (8%) patients CECT<br />
showed enhancement in the cortical nephrographic<br />
phase whereas CDUS showed no flow. In 8/110 (7%)<br />
patients CDUS showed flow whereas CECT showed<br />
poor enhancement. The authors concluded that CDUS<br />
has a diagnostic accuracy equal to CECT. The detection<br />
<strong>of</strong> blood flow in renal solid tumors using CDUS and/or<br />
power Doppler US as a predictor for clear cell RCC histology<br />
was investigated by Raj et al [103] . Any flow that was<br />
detected with the methods mentioned above was defined<br />
as vascular flow. The authors did not give information<br />
about the CD settings. Two hundred and ninety nine patients<br />
were retrospectively analyzed and 97 patients were<br />
analyzed prospectively. The proportion <strong>of</strong> benign lesions<br />
for the retrospective and prospective groups were 4%<br />
and 7%, respectively, with a calculated rate <strong>of</strong> 5% for<br />
both groups. There was a strong association <strong>of</strong> vascular<br />
flow with clear cell RCC histology.<br />
Unenhanced CDUS has a detection rate for blood<br />
flow comparable to CECT, whereas CEUS is superior to<br />
CECT. A characterization <strong>of</strong> benign and malignant lesions<br />
is not possible with satisfying accuracy using CDUS,<br />
CEUS or the traditional reference standard CECT.<br />
Contrast enhanced ultrasound: Since the availability<br />
<strong>of</strong> US contrast agents, several studies have been performed<br />
for the characterization and staging <strong>of</strong> solid<br />
renal lesions (Figure 4). CEUS is always performed after<br />
conventional B-mode US and must, therefore, be regarded<br />
as a combination <strong>of</strong> both methods.<br />
As early as 1994 Filippone et al [104] described contrast<br />
enhanced CD flow imaging with a high mechanical index<br />
and SHU 508A in 30 patients with 22/30 RCC (73%),<br />
1/30 sarcoma (3%), 1/30 leiomyosarcoma (3%), 1/30<br />
urothelial cell carcinoma (3%), 1/30 hemorrhagic cyst<br />
(3%) and 4 AML (13%). They found CD signals inside<br />
the lesion with conventional CDUS and CEUS in 13/30<br />
(43%) and 26/30 (87%) patients, respectively.<br />
Ascenti et al [84] demonstrated a sufficient diagnosis<br />
<strong>of</strong> renal pseudotumors with contrast-enhanced power<br />
Doppler US using SHU 508A in 4 patients. The same<br />
group performed contrast enhanced power Doppler<br />
with SHU 508A in 32 patients with 41 lesions (26 AML,<br />
11 RCC, 3 pseudotumors, 1 metastasis) with hyperechoic<br />
lesions to evaluate its ability in the differential diagnosis<br />
<strong>of</strong> RCC vs AML. All malignant lesions were diagnosed<br />
histologically, all benign lesions with CECT or followup.<br />
In most cases, RCC showed peripheral and central<br />
enhancement, and AML showed a wide range <strong>of</strong> different<br />
patterns <strong>of</strong> vascularity. With CDUS a correct diagnosis<br />
could be found in 76%, which could not be improved by<br />
injection <strong>of</strong> SHU 508A [63] .<br />
WJR|www.wjgnet.com<br />
Ignee A et al . CEUS <strong>of</strong> renal masses<br />
Figure 4 Renal cell carcinoma (T1), incidentally detected. CEUS investigation<br />
12 s after injection <strong>of</strong> 2.4 mL BR1 (SonoVue ® ).<br />
Quaia et al [60] investigated 23 lesions, including 15/23<br />
RCC (65%), 1/23 metanephric adenoma (4%) and 7/23<br />
AML (30%). With SHU 508A, heterogeneous behavior<br />
in the arterial phase was typical for RCC. The results in<br />
the late phase were not homogeneous. AML showed<br />
peripheral hypovascularity compared to renal tissue. Six<br />
<strong>of</strong> 7 AML were diagnosed by CT, all other tumors by<br />
histology.<br />
In 2004, Tranquart et al [119] reported on their experience<br />
with the investigation <strong>of</strong> 18 patients with different<br />
focal and diffuse renal diseases using BR1 (Sonovue ® )<br />
and contrast specific s<strong>of</strong>tware. CECT or magnetic resonance<br />
imaging was used as the reference method. Compared<br />
to conventional B-mode US, they found a better<br />
tumor delineation, a better detection <strong>of</strong> venous extension<br />
and a better characterization <strong>of</strong> cystic masses.<br />
The group around Siracusano and Quaia investigated<br />
23 patients with renal masses using SHU 508A with<br />
contrast specific s<strong>of</strong>tware [61] . CECT diagnosis or histology<br />
was used as the reference method. Results were solid<br />
RCC in 11/23 (48%), 7/23 AML (30%), 4/23 cystic RCC<br />
(17%), 1/23 metanephric adenoma (4%). Solid RCCs had<br />
a higher contrast enhancement than AML. The benign<br />
lesions showed a progressively decreasing enhancement in<br />
the delayed phase.<br />
Kabakci et al [120] investigated 21 patients with RCC<br />
using conventional power Doppler and contrast enhanced<br />
power Doppler US with SHU 508A and correlated their<br />
findings with microvessel density. Microvessel density<br />
has been shown to be a significant prognostic factor<br />
in a subgroup <strong>of</strong> patients with low tumor stages. They<br />
found a significant correlation between color pixel ratio<br />
in conventional power Doppler and contrast enhanced<br />
power Doppler US and microvessel density.<br />
Tamai et al [80] evaluated the usefulness <strong>of</strong> CEUS in the<br />
diagnosis <strong>of</strong> solid renal tumors. They included 29 patients<br />
who were investigated with conventional B-mode US and<br />
whose tumors were surgically resected. The histological<br />
diagnoses were RCC in 25/29 (86%), urothelial cell<br />
carcinoma in 1/29 (3%), oncocytomas in 2/29 (7%) and<br />
AML in 1/29 (3%) patients. CECT, here a multidetector<br />
scanner, failed to detect tumor blood flow in 5/29<br />
patients (17%), while CEUS demonstrated flow in 29/29<br />
23 January 28, 2010|Volume 2|Issue 1|
Ignee A et al . CEUS <strong>of</strong> renal masses<br />
(100%). In 1 <strong>of</strong> 2 patients with oncocytomas, a spoketype<br />
enhancement pattern could be demonstrated with<br />
CEUS in contrast to CECT.<br />
The group around Lassau and Lamuraglia reported on<br />
the experience with dynamic contrast enhanced Doppler<br />
US as a predictor <strong>of</strong> tumor response. They investigated a<br />
relatively heterogeneous group <strong>of</strong> 30 patients treated with<br />
Sorafenib for metastatic renal cell carcinomas [8/30 (27%)<br />
patients with lymph nodes involvement, 8/30 (27%) with<br />
liver metastases, 3/30 (10%) with recurrent renal lesions,<br />
3/30 (10%) with adrenal metastases, 2/30 (7%) with<br />
contralateral renal metastases, 1/30 (3%) with pancreas<br />
metastases as well as more than one metastatic location in<br />
5/30 (17%) patients]. They suggested quantitative CEUS<br />
for monitoring antiangiogenetic drug effectiveness in renal<br />
cancer [43] .<br />
Kawata et al [121] reported on 6 patients with recurrent<br />
RCC and demonstrated the utility <strong>of</strong> CEUS in this<br />
subgroup. In 5/6 patients (83%) the lesions were detected<br />
with conventional US, in 1 patient the diagnosis could<br />
only be made with CEUS.<br />
Wink et al [78] examined 18 patients with renal masses<br />
using CEUS with BR1. Inhomogeneous enhancement<br />
was typical for RCC. In 4/10 patients (40%) with histological<br />
analysis, CEUS demonstrated areas without enhancement<br />
which correlated with necrosis pathologically.<br />
Fan et al [62] investigated 72 patients with renal lesions ≤<br />
5 cm with contrast specific s<strong>of</strong>tware and BR1 (Sonovue ® )<br />
[44 RCC (61%), 24 AML (32%), 2 hypertrophied columns<br />
<strong>of</strong> Bertin (3%), 1 oncocytoma (1%), and 1 abscess<br />
(1%)]. The rates <strong>of</strong> histological confirmation for RCC,<br />
AML, oncocytoma, hypertrophied columns <strong>of</strong> Bertin<br />
and abscesses were 100%, 17%, 100%, 0% and 0%,<br />
respectively [62] . They found hyperenhancement in the<br />
late phase to be predictive for RCC (sensitivity 77%,<br />
specificity 96%). Also heterogeneous enhancement was<br />
characteristic for RCC. AML were homogeneously enhancing<br />
with hypoenhancement in both the arterial and<br />
late phase.<br />
Jiang et al [79] correlated CEUS features <strong>of</strong> 92 pathologically<br />
confirmed clear cell RCC in relation to tumor<br />
size. The degree <strong>of</strong> enhancement showed no correlation,<br />
but the homogenicity <strong>of</strong> enhancement correlated with<br />
tumor size. In tumors ≤ 3 cm, homogeneous enhancement<br />
was seen in 72% in contrast to tumors > 3 cm<br />
(9%). In patients with tumors ≤ 2 cm, a pseudocapsule<br />
appeared in 3/13 cases (23%), in tumors from > 2 to<br />
5 cm in 38/58 cases (66%) and in tumors > 5 cm in 5/21<br />
cases 24%. Inhomogeneous enhancement correlated with<br />
necrosis or cysts by histological analysis. A pseudocapsule<br />
was histologically diagnosed in 46/92 <strong>of</strong> the lesions (50%)<br />
and correlated with a rim <strong>of</strong> perilesional enhancement in<br />
42/46 patients (91%).<br />
Dong et al [93] characterized 42 patients with histologically<br />
proven clear cell RCC using time intensity curves<br />
received from video frames <strong>of</strong> second harmonic imaging<br />
with BR1. They could not differentiate a characteristic<br />
pattern. In time intensity curves, clear cell RCC had a<br />
WJR|www.wjgnet.com<br />
time to peak enhancement shorter than that <strong>of</strong> normal<br />
renal parenchyma and the mean value <strong>of</strong> the descent<br />
slope rate was lower. Avascular areas or filling defects<br />
were predominantly seen in larger tumors (33/42 (78%).<br />
Thirty patients with solid renal tumors were investigated<br />
by the group around Strobel and Bernatik [4] .<br />
RCC had a size <strong>of</strong> 65.4 ± 6.5 mm and were hypoechoic,<br />
isoechoic and hyperechoic in 52%, 36% and 12%, respectively.<br />
RCC showed a chaotic vascular pattern except<br />
for one lesion which was cystic and showed no enhancement<br />
at all. Hyperperfusion, isoperfusion and hypoperfusion<br />
was seen in the arterial phase in 12/25 (48%),<br />
3/25 (12%) and 9/25 (36%), respectively. In the late<br />
phase hyperperfusion, isoperfusion and hypoperfusion<br />
was seen in 5/25 (20%), 9/25% (36%) and 10/25 (40%),<br />
respectively. The authors conclude that CEUS is not useful<br />
in the characterization <strong>of</strong> small renal masses.<br />
Our group investigated more than 300 patients referred<br />
for surgical treatment <strong>of</strong> a renal mass. We performed<br />
conventional B-mode and color/power Doppler<br />
US as well as CEUS with BR1. In the majority <strong>of</strong> our<br />
patients histology was obtained by surgery (87%); in the<br />
other patients histology was obtained by biopsy (13%).<br />
Four percent <strong>of</strong> patients had lesions which finally proved<br />
to be <strong>of</strong> extrarenal origin, a proportion which is in accordance<br />
with the literature [105] . Overall there were 15% benign<br />
lesions, 22% <strong>of</strong> lesions < 40 mm had benign histology<br />
and 10% <strong>of</strong> lesions ≥ 40 mm had benign histology.<br />
In 77% <strong>of</strong> patients with histologically determined RCC,<br />
9% were cystic. CEUS could predict malignancy with a<br />
sensitivity, specificity, positive predictive value, negative<br />
predictive value and accuracy <strong>of</strong> 97%, 45%, 91%, 75%,<br />
and 90%, respectively. CEUS (CECT) had a sensitivity,<br />
specificity, positive, negative predictive value and accuracy<br />
<strong>of</strong> 85% (38%), 97% (98%), 72% (63%), 98% (94%), and<br />
96% (92%), respectively, for vein invasion. The correct<br />
staging was diagnosed by CEUS (CECT) in 83% (69%).<br />
The interpretation <strong>of</strong> the mentioned results favored<br />
CEUS in comparison to CECT for staging and characterization<br />
<strong>of</strong> RCC.<br />
The majority <strong>of</strong> clear cell RCC are hypervascular. One<br />
third <strong>of</strong> papillary RCC are hypovascular, although this<br />
does not lead to immediate consequences. A significant<br />
proportion <strong>of</strong> RCC show unenhanced areas which<br />
correlate with necrosis in histology. A significant pattern<br />
for RCC which leads to sharp discrimination between<br />
RCC and benign lesions cannot be currently defined.<br />
Staging <strong>of</strong> renal cell carcinoma with CEUS<br />
Staging parameters in RCC are <strong>of</strong> prognostic importance.<br />
In early stage RCC, partial nephrectomy is recommended.<br />
The 5-year survival rate after radical nephrectomy is<br />
reported to be between 75%-95% for patients with organ<br />
confined disease and 0-5% for patients with metastatic<br />
disease at time <strong>of</strong> presentation [122] . In locally advanced<br />
RCC (T ≥ 3, N0 and M0) certain subgroups (especially<br />
T2 and T3a) differ significantly in survival rates [123] .<br />
In contrast to preoperative T3a staging, detection <strong>of</strong><br />
24 January 28, 2010|Volume 2|Issue 1|
CEUS are widely used, and sophisticated techniques<br />
(hardware and s<strong>of</strong>tware) improve the diagnostic impact.<br />
There is significant evidence for its strength in the detection<br />
and characterization <strong>of</strong> liver lesions, with lesser<br />
strength for solid pancreatic lesions. In other indications<br />
the evidence is less clear but promising, e.g. splenic and<br />
adrenal tumors [95,96,143,144] . Regarding CEUS for tumor<br />
evaluation <strong>of</strong> the kidneys, the number <strong>of</strong> published<br />
studies is impressive but the conclusive evidence is low.<br />
The majority <strong>of</strong> tumors <strong>of</strong> the kidney are RCC. RCC<br />
are hypervascular in CEUS in most cases, especially in<br />
the case <strong>of</strong> clear cell histology. Here more than 90% are<br />
hypervascular in comparison to the surrounding renal<br />
parenchyma. Nevertheless it has to be taken into account<br />
that the bigger the lesion the higher the chance for large<br />
areas <strong>of</strong> necrosis or hemorrhage. In current studies with<br />
the development <strong>of</strong> sophisticated US techniques [e.g.<br />
cadence pulse sequencing (CPS)], avascular areas could be<br />
defined as necrosis by histological investigation [78,79] (own<br />
unpublished data). Avascular areas appear more frequent<br />
in large lesions. As those findings were formerly mixed<br />
with heterogeneous enhancement patterns the positive<br />
and negative predictive value <strong>of</strong> this sign has not been<br />
investigated so far. Papillary RCC in contrast to clear<br />
cell RCC was described as hypovascular in one third <strong>of</strong><br />
cases [80] but, as papillary RCC are malignant tumors, this<br />
finding does not play an important role in clinical practice.<br />
In the staging <strong>of</strong> malignant tumors <strong>of</strong> the kidney, the<br />
impact <strong>of</strong> CDUS and CEUS is high. Lymph node metastases,<br />
renal vein involvement as well as intraabdominal<br />
metastases elsewhere can be detected with results<br />
comparable to CECT, although multicenter studies with<br />
large patient numbers are not available so far. The detection<br />
<strong>of</strong> the pseudocapsule as a sign <strong>of</strong> early stage RCC is<br />
possible; nevertheless this feature has not been included<br />
in the current TNM classification.<br />
The results for CEUS concerning the late phase are<br />
not satisfying. CEUS patterns for RCC as well as for benign<br />
lesions are heterogeneous for the same tumor entity<br />
as well as dissimilar in different studies [60,93] . Since in the<br />
kidney there is no dual blood supply the late phase in the<br />
renal parenchyma itself is less pronounced as compared<br />
to the liver. In this context, observations in the late<br />
phase are limited by certain bubble destruction leading<br />
to different results in hyper- and hypoenhancing lesions<br />
using different techniques. Nevertheless the late phase<br />
is <strong>of</strong> significant interest but should be investigated with<br />
objective measurements using time intensity curves and<br />
intermittent imaging to avoid bubble destruction.<br />
Typical AML can be diagnosed with unenhanced<br />
CECT if they show a significant fat component. The<br />
frequency <strong>of</strong> atypical AML in CECT is controversial, and<br />
depends on necrosis, presence <strong>of</strong> shunts, low fat content<br />
and others. Nevertheless as well as in CECT, in CEUS<br />
the contrast agent enhancement patterns do not allow<br />
discrimination from RCC in all cases, and in case reports<br />
nearly all other tumor entities can present with fatty<br />
components as well. The typical AML in CEUS shows less<br />
WJR|www.wjgnet.com<br />
contrast enhancement in the arterial phase in comparison<br />
to the typical clear cell RCC.<br />
Oncocytoma represent a challenge for each imaging<br />
method. The typical central stellate scar can be histologically<br />
found in about 1/3 <strong>of</strong> oncocytoma, therefore,<br />
imaging methods cannot be sensitive and reliable. Furthermore<br />
this sign cannot be differentiated from small<br />
necrotic areas in RCC which are seen in a significant<br />
proportion <strong>of</strong> RCC (50%-80%, depending on the size).<br />
Metanephric adenoma is a rare entity and its features<br />
in CEUS need to be investigated by a multicenter<br />
approach. Up to now there has been no possibility for<br />
sharp discrimination with other tumor entities. (1) In<br />
the currently available literature, CEUS showed comparable<br />
results to CECT in the staging <strong>of</strong> RCC; (2) The<br />
characterization <strong>of</strong> cystic lesions (this is to date the most<br />
promising issue); (3) The detection <strong>of</strong> blood flow in<br />
small masses (differential diagnosis to atypical cysts with<br />
elevated density due to protein/blood content on CT);<br />
and (4) After local ablative tumor therapy (radi<strong>of</strong>requency<br />
ablation, cryotherapy).<br />
Possible indications with potential for further investigations<br />
are: (1) Differentiation <strong>of</strong> abscess/infarction vs<br />
hypovascular tumors because <strong>of</strong> sharp discrimination <strong>of</strong><br />
flow vs no flow; (2) Follow-up for palliative antiangiogenetic<br />
therapy in metastatic or recurrent RCC.<br />
Issues to be investigated further for CEUS are as follows:<br />
(1) The potential <strong>of</strong> CEUS to discriminate features<br />
for preoperative biopsy, e.g. hypoenhancing lesions < 4 cm;<br />
(2) Time-intensity curves, e.g. for oncocytoma and AML;<br />
and (3) The rate <strong>of</strong> benign lesions in the subgroup <strong>of</strong> small<br />
(< 4 cm) hypoenhancing lesions.<br />
REFERENCES<br />
Ignee A et al . CEUS <strong>of</strong> renal masses<br />
1 Ignee A, Baum U, Schuessler G, Dietrich CF. Contrastenhanced<br />
ultrasound-guided percutaneous cholangiography<br />
and cholangiodrainage (CEUS-PTCD). Endoscopy 2009; 41:<br />
725-726<br />
2 Claudon M, Cosgrove D, Albrecht T, Bolondi L, Bosio M,<br />
Calliada F, Correas JM, Darge K, Dietrich C, D’On<strong>of</strong>rio<br />
M, Evans DH, Filice C, Greiner L, Jäger K, Jong N, Leen E,<br />
Lencioni R, Lindsell D, Martegani A, Meairs S, Nolsøe C,<br />
Piscaglia F, Ricci P, Seidel G, Skjoldbye B, Solbiati L, Thorelius<br />
L, Tranquart F, Weskott HP, Whittingham T. Guidelines<br />
and good clinical practice recommendations for contrast<br />
enhanced ultrasound (CEUS) - update 2008. Ultraschall Med<br />
2008; 29: 28-44<br />
3 Dietrich CF. Comments and illustrations regarding the<br />
guidelines and good clinical practice recommendations<br />
for contrast-enhanced ultrasound (CEUS)--update 2008.<br />
Ultraschall Med 2008; 29 Suppl 4: S188-S202<br />
4 Haendl T, Strobel D, Legal W, Frieser M, Hahn EG, Bernatik<br />
T. [Renal cell cancer does not show a typical perfusion<br />
pattern in contrast-enhanced ultrasound] Ultraschall Med<br />
2009; 30: 58-63<br />
5 Curry NS. Small renal masses (lesions smaller than 3 cm):<br />
imaging evaluation and management. AJR Am J Roentgenol<br />
1995; 164: 355-362<br />
6 Jamis-Dow CA, Choyke PL, Jennings SB, Linehan WM,<br />
Thakore KN, Walther MM. Small (< or = 3-cm) renal masses:<br />
detection with CT versus US and pathologic correlation.<br />
27 January 28, 2010|Volume 2|Issue 1|
Ignee A et al . CEUS <strong>of</strong> renal masses<br />
<strong>Radiology</strong> 1996; 198: 785-788<br />
7 Smith SJ, Bosniak MA, Megibow AJ, Hulnick DH, Horii SC,<br />
Raghavendra BN. Renal cell carcinoma: earlier discovery<br />
and increased detection. <strong>Radiology</strong> 1989; 170: 699-703<br />
8 Amendola MA, Bree RL, Pollack HM, Francis IR, Glazer<br />
GM, Jafri SZ, Tomaszewski JE. Small renal cell carcinomas:<br />
resolving a diagnostic dilemma. <strong>Radiology</strong> 1988; 166: 637-641<br />
9 Warshauer DM, McCarthy SM, Street L, Bookbinder MJ,<br />
Glickman MG, Richter J, Hammers L, Taylor C, Rosenfield<br />
AT. Detection <strong>of</strong> renal masses: sensitivities and specificities<br />
<strong>of</strong> excretory urography/linear tomography, US, and CT.<br />
<strong>Radiology</strong> 1988; 169: 363-365<br />
10 Robbin ML, Lockhart ME, Barr RG. Renal imaging with<br />
ultrasound contrast: current status. Radiol Clin North Am<br />
2003; 41: 963-978<br />
11 Provet J, Tessler A, Brown J, Golimbu M, Bosniak M, Morales<br />
P. Partial nephrectomy for renal cell carcinoma: indications,<br />
results and implications. J Urol 1991; 145: 472-476<br />
12 Eggener SE, Rubenstein JN, Smith ND, Nadler RB, Kontak<br />
J, Flanigan RC, Waters WB, Picken M, Campbell SC. Renal<br />
tumors in young adults. J Urol 2004; 171: 106-110<br />
13 Jayson M, Sanders H. Increased incidence <strong>of</strong> serendipitously<br />
discovered renal cell carcinoma. Urology 1998; 51: 203-205<br />
14 Curti BD. Renal cell carcinoma. JAMA 2004; 292: 97-100<br />
15 Scialpi M, Di Maggio A, Midiri M, Loperfido A, Angelelli<br />
G, Rotondo A. Small renal masses: assessment <strong>of</strong> lesion<br />
characterization and vascularity on dynamic contrast-enhanced<br />
MR imaging with fat suppression. AJR Am J Roentgenol 2000;<br />
175: 751-757<br />
16 Bosniak MA. The small (less than or equal to 3.0 cm) renal<br />
parenchymal tumor: detection, diagnosis, and controversies.<br />
<strong>Radiology</strong> 1991; 179: 307-317<br />
17 Birnbaum BA, Bosniak MA, Megibow AJ, Lubat E, Gordon<br />
RB. Observations on the growth <strong>of</strong> renal neoplasms.<br />
<strong>Radiology</strong> 1990; 176: 695-701<br />
18 Talamo TS, Shonnard JW. Small renal adenocarcinoma with<br />
metastases. J Urol 1980; 124: 132-134<br />
19 Hajdu SI, Thomas AG. Renal cell carcinoma at autopsy. J<br />
Urol 1967; 97: 978-982<br />
20 Aizawa S, Suzuki M, Kikuchi Y, Nikaido T, Matsumoto K.<br />
Clinicopathological study on small renal cell carcinomas<br />
with metastases. Acta Pathol Jpn 1987; 37: 947-954<br />
21 Ellis WJ, Bauer KD, Oyasu R, McVary KT. Flow cytometric<br />
analysis <strong>of</strong> small renal tumors. J Urol 1992; 148: 1774-1777<br />
22 Beisland C, Hjelle KM, Reisaeter LA, Bostad L. Observation<br />
should be considered as an alternative in management <strong>of</strong><br />
renal masses in older and comorbid patients. Eur Urol 2009;<br />
55: 1419-1427<br />
23 O’Malley RL, Godoy G, Phillips CK, Taneja SS. Is surveillance<br />
<strong>of</strong> small renal masses safe in the elderly? BJU Int<br />
2009; Epub ahead <strong>of</strong> print<br />
24 Bosniak MA, Birnbaum BA, Krinsky GA, Waisman J. Small<br />
renal parenchymal neoplasms: further observations on<br />
growth. <strong>Radiology</strong> 1995; 197: 589-597<br />
25 Cheville JC, Lohse CM, Zincke H, Weaver AL, Blute ML.<br />
Comparisons <strong>of</strong> outcome and prognostic features among<br />
histologic subtypes <strong>of</strong> renal cell carcinoma. Am J Surg Pathol<br />
2003; 27: 612-624<br />
26 Mydlo JH, Bard RH. Analysis <strong>of</strong> papillary renal adenocarcinoma.<br />
Urology 1987; 30: 529-534<br />
27 Van Poppel H, Nilsson S, Algaba F, Bergerheim U, Dal<br />
Cin P, Fleming S, Hellsten S, Kirkali Z, Klotz L, Lindblad<br />
P, Ljungberg B, Mulders P, Roskams T, Ross RK, Walker C,<br />
Wersäll P. Precancerous lesions in the kidney. Scand J Urol<br />
Nephrol Suppl 2000; 136-165<br />
28 Grimaldi G, Reuter V, Russo P. Bilateral non-familial renal<br />
cell carcinoma. Ann Surg Oncol 1998; 5: 548-552<br />
29 Sánchez-Ortiz RF, Madsen LT, Bermejo CE, Wen S, Shen<br />
Y, Swanson DA, Wood CG. A renal mass in the setting<br />
WJR|www.wjgnet.com<br />
<strong>of</strong> a nonrenal malignancy: When is a renal tumor biopsy<br />
appropriate? Cancer 2004; 101: 2195-2201<br />
30 Chassagne P, Perol MB, Doucet J, Elyachkouri L, Grise<br />
P, Métayer J, Berc<strong>of</strong>f E. [Renal metastases from cancer.<br />
Apropos <strong>of</strong> 9 cases and review <strong>of</strong> the literature] Ann Med<br />
Interne (Paris) 1994; 145: 103-106<br />
31 Abe K, Hasegawa T, Onodera S, Oishi Y, Suzuki M. Renal<br />
metastasis <strong>of</strong> thyroid carcinoma. Int J Urol 2002; 9: 656-658<br />
32 Takehara K, Koga S, Nishikido M, Kanetake H, Hayashi<br />
T, Hara S, Ayabe H, Saito Y. Breast cancer metastatic to the<br />
kidney. Anticancer Res 1999; 19: 5571-5573<br />
33 Aron M, Nair M, Hemal AK. Renal metastasis from primary<br />
hepatocellular carcinoma. A case report and review <strong>of</strong> the<br />
literature. Urol Int 2004; 73: 89-91<br />
34 Trompette A, Clavel M, Paraf F, Sabatini M, Melloni B,<br />
Bonnaud F. [Symptomatic renal metastases <strong>of</strong> bronchial<br />
carcinoma] Rev Mal Respir 1999; 16: 833-835<br />
35 Denti F, Wisard M, Guillou L, Francke ML, Leisinger HJ.<br />
Renal metastasis from prostatic adenocarcinoma: a potential<br />
diagnostic pitfall. Urol Int 1999; 62: 171-173<br />
36 Martino L, Martino F, Coluccio A, Mangiarini MG, Chioda C.<br />
Renal metastasis from pancreatic adenocarcinoma. Arch Ital<br />
Urol Androl 2004; 76: 37-39<br />
37 Sanz Mayayo E, Mayayo Dehesa T, Gómez García I, Sáenz<br />
Medina J, Rodríguez-Patrón Rodríguez R, Escudero Barrilero A.<br />
[Renal metastasis <strong>of</strong> hepatocellular carcinoma] Actas Urol Esp<br />
2003; 27: 387-390<br />
38 Müller HJ, Weckesser M, Schober O. Bilateral renal metastasis<br />
in follicular thyroid carcinoma. Nuklearmedizin 2000; 39: 45-47<br />
39 Fukushima M, Isoyama E, Sakaridani N, Sanematsu H,<br />
Kadowaki H, Hirakawa S, Miyagawa I. [Renal metastasis<br />
originating from liver cancer] Nippon Hinyokika Gakkai Zasshi<br />
1996; 87: 710-713<br />
40 Le Normand S, Soyer P, Klein I, Hervé JM, Scherrer A. [Can<br />
primary kidney clear cell adenocarcinoma be differentiated<br />
from kidney metastasis with computed tomography?] Prog<br />
Urol 1997; 7: 403-407<br />
41 Päivänalo M, Tikkakoski T, Merikanto J, Suramo I. [Radiologic<br />
findings in renal metastases] Aktuelle Radiol 1993; 3:<br />
360-365<br />
42 Honda H, C<strong>of</strong>fman CE, Berbaum KS, Barloon TJ, Masuda<br />
K. CT analysis <strong>of</strong> metastatic neoplasms <strong>of</strong> the kidney.<br />
Comparison with primary renal cell carcinoma. Acta Radiol<br />
1992; 33: 39-44<br />
43 Lamuraglia M, Escudier B, Chami L, Schwartz B, Leclère<br />
J, Roche A, Lassau N. To predict progression-free survival<br />
and overall survival in metastatic renal cancer treated with<br />
sorafenib: pilot study using dynamic contrast-enhanced<br />
Doppler ultrasound. Eur J Cancer 2006; 42: 2472-2479<br />
44 Fröhlich T, Brands A, Thon WF, Weskott HP, Ostertag H.<br />
Angiomyolipoma <strong>of</strong> the kidney and lymph nodes. <strong>World</strong> J<br />
Urol 1999; 17: 123-125<br />
45 Tallarigo C, Baldassarre R, Bianchi G, Comunale L, Olivo<br />
G, Pea M, Bonetti F, Martignoni G, Zamboni G, Mobilio G.<br />
Diagnostic and therapeutic problems in multicentric renal<br />
angiomyolipoma. J Urol 1992; 148: 1880-1884<br />
46 Ferry JA, Malt RA, Young RH. Renal angiomyolipoma with<br />
sarcomatous transformation and pulmonary metastases. Am<br />
J Surg Pathol 1991; 15: 1083-1088<br />
47 Cibas ES, Goss GA, Kulke MH, Demetri GD, Fletcher<br />
CD. Malignant epithelioid angiomyolipoma (‚sarcoma ex<br />
angiomyolipoma‘) <strong>of</strong> the kidney: a case report and review<br />
<strong>of</strong> the literature. Am J Surg Pathol 2001; 25: 121-126<br />
48 Jinzaki M, Tanimoto A, Narimatsu Y, Ohkuma K, Kurata<br />
T, Shinmoto H, Hiramatsu K, Mukai M, Murai M. Angiomyolipoma:<br />
imaging findings in lesions with minimal fat.<br />
<strong>Radiology</strong> 1997; 205: 497-502<br />
49 Kim JK, Park SY, Shon JH, Cho KS. Angiomyolipoma with<br />
minimal fat: differentiation from renal cell carcinoma at<br />
28 January 28, 2010|Volume 2|Issue 1|
iphasic helical CT. <strong>Radiology</strong> 2004; 230: 677-684<br />
50 Bret PM, Bretagnolle M, Gaillard D, Plauchu H, Labadie M,<br />
Lapray JF, Roullaud Y, Cooperberg P. Small, asymptomatic<br />
angiomyolipomas <strong>of</strong> the kidney. <strong>Radiology</strong> 1985; 154: 7-10<br />
51 Hélénon O, Chrétien Y, Paraf F, Melki P, Denys A, Moreau<br />
JF. Renal cell carcinoma containing fat: demonstration with<br />
CT. <strong>Radiology</strong> 1993; 188: 429-430<br />
52 Strotzer M, Lehner KB, Becker K. Detection <strong>of</strong> fat in a renal<br />
cell carcinoma mimicking angiomyolipoma. <strong>Radiology</strong> 1993;<br />
188: 427-428<br />
53 Davidson AJ, Davis CJ Jr. Fat in renal adenocarcinoma: never<br />
say never. <strong>Radiology</strong> 1993; 188: 316<br />
54 D’Angelo PC, Gash JR, Horn AW, Klein FA. Fat in renal<br />
cell carcinoma that lacks associated calcifications. AJR Am J<br />
Roentgenol 2002; 178: 931-932<br />
55 Lesavre A, Correas JM, Merran S, Grenier N, Vieillefond<br />
A, Hélénon O. CT <strong>of</strong> papillary renal cell carcinomas with<br />
cholesterol necrosis mimicking angiomyolipomas. AJR Am J<br />
Roentgenol 2003; 181: 143-145<br />
56 Roy C, Tuchmann C, Lindner V, Guth S, Vasilescu C,<br />
Saussine C, Jacqmin D. Renal cell carcinoma with a fatty<br />
component mimicking angiomyolipoma on CT. Br J Radiol<br />
1998; 71: 977-979<br />
57 Schuster TG, Ferguson MR, Baker DE, Schaldenbrand JD,<br />
Solomon MH. Papillary renal cell carcinoma containing fat<br />
without calcification mimicking angiomyolipoma on CT.<br />
AJR Am J Roentgenol 2004; 183: 1402-1404<br />
58 Hélénon O, Merran S, Paraf F, Melki P, Correas JM, Chrétien<br />
Y, Moreau JF. Unusual fat-containing tumors <strong>of</strong> the kidney: a<br />
diagnostic dilemma. Radiographics 1997; 17: 129-144<br />
59 Wang R, Wolf JS Jr, Wood DP Jr, Higgins EJ, Hafez KS.<br />
Accuracy <strong>of</strong> percutaneous core biopsy in management <strong>of</strong><br />
small renal masses. Urology 2009; 73: 586-590; discussion<br />
590-591<br />
60 Quaia E, Siracusano S, Bertolotto M, Monduzzi M, Mucelli<br />
RP. Characterization <strong>of</strong> renal tumours with pulse inversion<br />
harmonic imaging by intermittent high mechanical index<br />
technique: initial results. Eur Radiol 2003; 13: 1402-1412<br />
61 Siracusano S, Quaia E, Bertolotto M, Ciciliato S, Tiberio A,<br />
Belgrano E. The application <strong>of</strong> ultrasound contrast agents in<br />
the characterization <strong>of</strong> renal tumors. <strong>World</strong> J Urol 2004; 22:<br />
316-322<br />
62 Fan L, Lianfang D, Jinfang X, Yijin S, Ying W. Diagnostic<br />
efficacy <strong>of</strong> contrast-enhanced ultrasonography in solid renal<br />
parenchymal lesions with maximum diameters <strong>of</strong> 5 cm. J<br />
Ultrasound Med 2008; 27: 875-885<br />
63 Ascenti G, Zimbaro G, Mazziotti S, Gaeta M, Settineri N,<br />
Scribano E. Usefulness <strong>of</strong> power Doppler and contrastenhanced<br />
sonography in the differentiation <strong>of</strong> hyperechoic<br />
renal masses. Abdom Imaging 2001; 26: 654-660<br />
64 Eble JN, Sauter G, Epstein JI, Sesterhenn IAE. <strong>World</strong><br />
Health Organization Classification <strong>of</strong> Tumours. Pathology<br />
and Genetics <strong>of</strong> Tumours <strong>of</strong> the Urinary System and Male<br />
Genital Organs, 2004<br />
65 Bennington JL. Proceedings: Cancer <strong>of</strong> the kidney--etiology,<br />
epidemiology, and pathology. Cancer 1973; 32: 1017-1029<br />
66 Delahunt B, Velickovic M, Grebe SK. Evolving classification <strong>of</strong><br />
renal cell neoplasia. Expert Rev Anticancer Ther 2001; 1: 576-584<br />
67 Störkel S. [Epithelial tumors <strong>of</strong> the kidney. Pathological<br />
subtyping and cytogenetic correlation] Urologe A 1999; 38:<br />
425-432<br />
68 Kiyoshima K, Oda Y, Nakamura T, Migita T, Okumura<br />
K, Naito S, Tsuneyoshi M. Multicentric papillary renal cell<br />
carcinoma associated with renal adenomatosis. Pathol Int<br />
2004; 54: 266-272<br />
69 Picken MM, Curry JL, Lindgren V, Clark JI, Eble JN. Metanephric<br />
adenosarcoma in a young adult: morphologic,<br />
immunophenotypic, ultrastructural, and fluorescence in<br />
situ hybridization analyses: a case report and review <strong>of</strong> the<br />
WJR|www.wjgnet.com<br />
Ignee A et al . CEUS <strong>of</strong> renal masses<br />
literature. Am J Surg Pathol 2001; 25: 1451-1457<br />
70 Arroyo MR, Green DM, Perlman EJ, Beckwith JB, Argani<br />
P. The spectrum <strong>of</strong> metanephric aden<strong>of</strong>ibroma and related<br />
lesions: clinicopathologic study <strong>of</strong> 25 cases from the<br />
National Wilms Tumor Study Group Pathology Center. Am<br />
J Surg Pathol 2001; 25: 433-444<br />
71 Tickoo SK, Reuter VE, Amin MB, Srigley JR, Epstein JI, Min<br />
KW, Rubin MA, Ro JY. Renal oncocytosis: a morphologic<br />
study <strong>of</strong> fourteen cases. Am J Surg Pathol 1999; 23: 1094-1101<br />
72 Van der Kwast T, Perez-Ordoñez B. Renal oncocytoma, yet<br />
another tumour that does not fit in the dualistic benign/<br />
malignant paradigm? J Clin Pathol 2007; 60: 585-586<br />
73 Breda A, Treat EG, Haft-Candell L, Leppert JT, Harper JD,<br />
Said J, Raman S, Smith RB, Belldegrun AS, Schulam PG.<br />
Comparison <strong>of</strong> accuracy <strong>of</strong> 14-, 18- and 20-G needles in exvivo<br />
renal mass biopsy: a prospective, blinded study. BJU<br />
Int 2009; Epub ahead <strong>of</strong> print<br />
74 Al-Saleem T, Cairns P, Dulaimi EA, Feder M, Testa JR,<br />
Uzzo RG. The genetics <strong>of</strong> renal oncocytosis: a possible<br />
model for neoplastic progression. Cancer Genet Cytogenet<br />
2004; 152: 23-28<br />
75 Amin R, Anthony P. Metastatic renal oncocytoma: A case<br />
report and review <strong>of</strong> the literature. Clin Oncol (R Coll<br />
Radiol) 1999; 11: 277-279<br />
76 Perez-Ordonez B, Hamed G, Campbell S, Erlandson RA,<br />
Russo P, Gaudin PB, Reuter VE. Renal oncocytoma: a<br />
clinicopathologic study <strong>of</strong> 70 cases. Am J Surg Pathol 1997;<br />
21: 871-883<br />
77 Choudhary S, Rajesh A, Mayer NJ, Mulcahy KA, Haroon A.<br />
Renal oncocytoma: CT features cannot reliably distinguish<br />
oncocytoma from other renal neoplasms. Clin Radiol 2009;<br />
64: 517-522<br />
78 Wink MH, de la Rosette JJ, Laguna P, Lagerveld BW,<br />
Wijkstra H. Ultrasonography <strong>of</strong> renal masses using contrast<br />
pulse sequence imaging: a pilot study. J Endourol 2007; 21:<br />
466-472<br />
79 Jiang J, Chen Y, Zhou Y, Zhang H. Clear cell renal cell<br />
carcinoma: Contrast-enhanced ultrasound features relation<br />
to tumor size. Eur J Radiol 2008; Epub ahead <strong>of</strong> print<br />
80 Tamai H, Takiguchi Y, Oka M, Shingaki N, Enomoto S,<br />
Shiraki T, Furuta M, Inoue I, Iguchi M, Yanaoka K, Arii<br />
K, Shimizu Y, Nakata H, Shinka T, Sanke T, Ichinose M.<br />
Contrast-enhanced ultrasonography in the diagnosis <strong>of</strong><br />
solid renal tumors. J Ultrasound Med 2005; 24: 1635-1640<br />
81 Yeh HC, Halton KP, Shapiro RS, Rabinowitz JG, Mitty HA.<br />
Junctional parenchyma: revised definition <strong>of</strong> hypertrophic<br />
column <strong>of</strong> Bertin. <strong>Radiology</strong> 1992; 185: 725-732<br />
82 Patriquin H, Lefaivre JF, Lafortune M, Russo P, Boisvert J.<br />
Fetal lobation. An anatomo-ultrasonographic correlation. J<br />
Ultrasound Med 1990; 9: 191-197<br />
83 Leekam RN, Matzinger MA, Brunelle M, Gray RR, Grosman<br />
H. The sonography <strong>of</strong> renal columnar hypertrophy. J Clin<br />
Ultrasound 1983; 11: 491-494<br />
84 Ascenti G, Zimbaro G, Mazziotti S, Gaeta M, Lamberto<br />
S, Scribano E. Contrast-enhanced power Doppler US in<br />
the diagnosis <strong>of</strong> renal pseudotumors. Eur Radiol 2001; 11:<br />
2496-2499<br />
85 Ascenti G, Zimbaro G, Mazziotti S, Visalli C, Racchiusa S,<br />
Vinci S, Scribano E. [Doppler power with contrast media in<br />
the characterization <strong>of</strong> renal masses] Radiol Med 2000; 100:<br />
168-174<br />
86 Bono AV, Lovisolo JA. Renal cell carcinoma--diagnosis and<br />
treatment: state <strong>of</strong> the art. Eur Urol 1997; 31 Suppl 1: 47-55<br />
87 Clevert DA, Stock K, Klein B, Slotta-Huspenina J, Prantl L,<br />
Heemann U, Reiser M. Evaluation <strong>of</strong> Acoustic Radiation<br />
Force Impulse (ARFI) imaging and contrast-enhanced ultrasound<br />
in renal tumors <strong>of</strong> unknown etiology in comparison to<br />
histological findings. Clin Hemorheol Microcirc 2009; 43: 95-107<br />
88 Jinzaki M, Ohkuma K, Tanimoto A, Mukai M, Hiramatsu<br />
29 January 28, 2010|Volume 2|Issue 1|
Ignee A et al . CEUS <strong>of</strong> renal masses<br />
K, Murai M, Hata J. Small solid renal lesions: usefulness <strong>of</strong><br />
power Doppler US. <strong>Radiology</strong> 1998; 209: 543-550<br />
89 Setola SV, Catalano O, Sandomenico F, Siani A. Contrastenhanced<br />
sonography <strong>of</strong> the kidney. Abdom Imaging 2007; 32:<br />
21-28<br />
90 Yang DM, Yoon MH, Kim HS, Kim HS, Shin DB. Intrarenal<br />
pseudoaneurysms complicating renal choriocarcinoma<br />
metastases: treatment with coil embolization. Clin Imaging<br />
2000; 24: 217-220<br />
91 Maresca G, Summaria V, De Gaetano AM, Danza FM,<br />
Valentini AL, Marano P. [Color Doppler echography in the<br />
tissue characterization <strong>of</strong> renal masses] Radiol Med 1995; 89:<br />
470-480<br />
92 Spahn M, Portillo FJ, Michel MS, Siegsmund M, Gaa J, Alken<br />
P, Jünemann KP. Color Duplex sonography vs. computed<br />
tomography: accuracy in the preoperative evaluation <strong>of</strong> renal<br />
cell carcinoma. Eur Urol 2001; 40: 337-342<br />
93 Dong XQ, Shen Y, Xu LW, Xu CM, Bi W, Wang XM. Contrastenhanced<br />
ultrasound for detection and diagnosis <strong>of</strong> renal<br />
clear cell carcinoma. Chin Med J (Engl) 2009; 122: 1179-1183<br />
94 Kitamura H, Fujimoto H, Tobisu K, Mizuguchi Y, Maeda T,<br />
Matsuoka N, Komiyama M, Nakagawa T, Kakizoe T. Dynamic<br />
computed tomography and color Doppler ultrasound <strong>of</strong> renal<br />
parenchymal neoplasms: correlations with histopathological<br />
findings. Jpn J Clin Oncol 2004; 34: 78-81<br />
95 Dietrich CF, Ignee A, Trojan J, Fellbaum C, Schuessler G.<br />
Improved characterisation <strong>of</strong> histologically proven liver<br />
tumours by contrast enhanced ultrasonography during the<br />
portal venous and specific late phase <strong>of</strong> SHU 508A. Gut<br />
2004; 53: 401-405<br />
96 Dietrich CF, Braden B, Hocke M, Ott M, Ignee A. Improved<br />
characterisation <strong>of</strong> solitary solid pancreatic tumours using<br />
contrast enhanced transabdominal ultrasound. J Cancer Res<br />
Clin Oncol 2008; 134: 635-643<br />
97 Mindrup SR, Pierre JS, Dahmoush L, Konety BR. The<br />
prevalence <strong>of</strong> renal cell carcinoma diagnosed at autopsy.<br />
BJU Int 2005; 95: 31-33<br />
98 Xipell JM. The incidence <strong>of</strong> benign renal nodules (a<br />
clinicopathologic study). J Urol 1971; 106: 503-506<br />
99 Reis M, Faria V, Lindoro J, Adolfo A. The small cystic and<br />
noncystic noninflammatory renal nodules: a postmortem<br />
study. J Urol 1988; 140: 721-724<br />
100 Frank I, Blute ML, Cheville JC, Lohse CM, Weaver AL,<br />
Zincke H. Solid renal tumors: an analysis <strong>of</strong> pathological<br />
features related to tumor size. J Urol 2003; 170: 2217-2220<br />
101 Silver DA, Morash C, Brenner P, Campbell S, Russo P.<br />
Pathologic findings at the time <strong>of</strong> nephrectomy for renal<br />
mass. Ann Surg Oncol 1997; 4: 570-574<br />
102 Tuncali K, vanSonnenberg E, Shankar S, Mortele KJ, Cibas ES,<br />
Silverman SG. Evaluation <strong>of</strong> patients referred for percutaneous<br />
ablation <strong>of</strong> renal tumors: importance <strong>of</strong> a preprocedural<br />
diagnosis. AJR Am J Roentgenol 2004; 183: 575-582<br />
103 Raj GV, Bach AM, Iasonos A, Korets R, Blitstein J, Hann<br />
L, Russo P. Predicting the histology <strong>of</strong> renal masses using<br />
preoperative Doppler ultrasonography. J Urol 2007; 177: 53-58<br />
104 Filippone A, Muzi M, Basilico R, Di Giandomenico V,<br />
Trapani AR, Bonomo L. Color Doppler flow imaging <strong>of</strong><br />
renal disease. Value <strong>of</strong> a new intravenous contrast agent:<br />
SH U 508 A (Levovist). Radiol Med 1994; 87: 50-58<br />
105 Somani BK, Nabi G, Thorpe P, N’Dow J, Swami S, McClinton<br />
S. Image-guided biopsy-diagnosed renal cell carcinoma:<br />
critical appraisal <strong>of</strong> technique and long-term follow-up. Eur<br />
Urol 2007; 51: 1289-1295; discussion 1296-1297<br />
106 Ascenti G, Gaeta M, Magno C, Mazziotti S, Blandino A,<br />
Melloni D, Zimbaro G. Contrast-enhanced second-harmonic<br />
sonography in the detection <strong>of</strong> pseudocapsule in renal cell<br />
carcinoma. AJR Am J Roentgenol 2004; 182: 1525-1530<br />
107 Silverman SG, Lee BY, Seltzer SE, Bloom DA, Corless CL,<br />
Adams DF. Small (< or = 3 cm) renal masses: correlation<br />
WJR|www.wjgnet.com<br />
<strong>of</strong> spiral CT features and pathologic findings. AJR Am J<br />
Roentgenol 1994; 163: 597-605<br />
108 Duchene DA, Lotan Y, Cadeddu JA, Sagalowsky AI,<br />
Koeneman KS. Histopathology <strong>of</strong> surgically managed renal<br />
tumors: analysis <strong>of</strong> a contemporary series. Urology 2003; 62:<br />
827-830<br />
109 Toprak U, Erdoğan A, Gülbay M, Karademir MA, Paşaoğlu E,<br />
Akar OE. Preoperative evaluation <strong>of</strong> renal anatomy and renal<br />
masses with helical CT, 3D-CT and 3D-CT angiography.<br />
Diagn Interv Radiol 2005; 11: 35-40<br />
110 Schmidbauer J, Remzi M, Memarsadeghi M, Haitel A,<br />
Klingler HC, Katzenbeisser D, Wiener H, Marberger M.<br />
Diagnostic accuracy <strong>of</strong> computed tomography-guided percutaneous<br />
biopsy <strong>of</strong> renal masses. Eur Urol 2008; 53: 1003-1011<br />
111 Caoili EM, Bude RO, Higgins EJ, H<strong>of</strong>f DL, Nghiem HV.<br />
Evaluation <strong>of</strong> sonographically guided percutaneous core<br />
biopsy <strong>of</strong> renal masses. AJR Am J Roentgenol 2002; 179:<br />
373-378<br />
112 Jaff A, Molinié V, Mellot F, Guth A, Lebret T, Scherrer A.<br />
Evaluation <strong>of</strong> imaging-guided fine-needle percutaneous<br />
biopsy <strong>of</strong> renal masses. Eur Radiol 2005; 15: 1721-1726<br />
113 Tsuboi N, Horiuchi K, Kimura G, Kondoh Y, Yoshida K,<br />
Nishimura T, Akimoto M, Miyashita T, Subosawa T. Renal<br />
masses detected by general health checkup. Int J Urol 2000; 7:<br />
404-408<br />
114 Campbell SC, Fichtner J, Novick AC, Steinbach F, Stöckle<br />
M, Klein EA, Filipas D, Levin HS, Störkel S, Schweden<br />
F, Obuchowski NA, Hale J. Intraoperative evaluation <strong>of</strong><br />
renal cell carcinoma: a prospective study <strong>of</strong> the role <strong>of</strong><br />
ultrasonography and histopathological frozen sections. J Urol<br />
1996; 155: 1191-1195<br />
115 Remzi M, Katzenbeisser D, Waldert M, Klingler HC, Susani<br />
M, Memarsadeghi M, Heinz-Peer G, Haitel A, Herwig R,<br />
Marberger M. Renal tumour size measured radiologically<br />
before surgery is an unreliable variable for predicting<br />
histopathological features: benign tumours are not necessarily<br />
small. BJU Int 2007; 99: 1002-1006<br />
116 Shannon BA, Cohen RJ, de Bruto H, Davies RJ. The value<br />
<strong>of</strong> preoperative needle core biopsy for diagnosing benign<br />
lesions among small, incidentally detected renal masses. J<br />
Urol 2008; 180: 1257-1261; discussion 1261<br />
117 Kramer BA, Whelan CM, Vestal JC, Schwartz BF. Increasing<br />
the number <strong>of</strong> biopsy cores before renal cryoablation<br />
increases the diagnostic yield. J Endourol 2009; 23: 283-286<br />
118 Habboub HK, Abu-Yousef MM, Williams RD, See WA,<br />
Schweiger GD. Accuracy <strong>of</strong> color Doppler sonography in<br />
assessing venous thrombus extension in renal cell carcinoma.<br />
AJR Am J Roentgenol 1997; 168: 267-271<br />
119 Tranquart F, Correas JM, Martegani A, Greppi B, Bokor D.<br />
[Feasability <strong>of</strong> real time contrast enhanced ultrasound in<br />
renal disease] J Radiol 2004; 85: 31-36<br />
120 Kabakci N, Igci E, Secil M, Yorukoglu K, Mungan U,<br />
Celebi I, Kirkali Z. Echo contrast-enhanced power Doppler<br />
ultrasonography for assessment <strong>of</strong> angiogenesis in renal cell<br />
carcinoma. J Ultrasound Med 2005; 24: 747-753<br />
121 Kawata N, Igarashi T, Ichinose T, Hirakata H, Hachiya T,<br />
Takimoto Y, Ogawa M. Usefulness <strong>of</strong> contrast-enhanced<br />
ultrasound for the diagnosis <strong>of</strong> recurrent renal cell carcinoma<br />
in contralateral kidney. Int J Urol 2006; 13: 325-328<br />
122 Lam JS, Belldegrun AS, Pantuck AJ. Long-term outcomes<br />
<strong>of</strong> the surgical management <strong>of</strong> renal cell carcinoma. <strong>World</strong> J<br />
Urol 2006; 24: 255-266<br />
123 Margulis V, Tamboli P, Matin SF, Meisner M, Swanson DA,<br />
Wood CG. Redefining pT3 renal cell carcinoma in the modern<br />
era: a proposal for a revision <strong>of</strong> the current TNM primary<br />
tumor classification system. Cancer 2007; 109: 2439-2444<br />
124 Kim HL, Zisman A, Han KR, Figlin RA, Belldegrun AS.<br />
Prognostic significance <strong>of</strong> venous thrombus in renal cell<br />
carcinoma. Are renal vein and inferior vena cava involvement<br />
30 January 28, 2010|Volume 2|Issue 1|
different? J Urol 2004; 171: 588-591<br />
125 Moinzadeh A, Libertino JA. Prognostic significance <strong>of</strong><br />
tumor thrombus level in patients with renal cell carcinoma<br />
and venous tumor thrombus extension. Is all T3b the same?<br />
J Urol 2004; 171: 598-601<br />
126 Bos SD, Mensink HJ. Can duplex Doppler ultrasound<br />
replace computerized tomography in staging patients with<br />
renal cell carcinoma? Scand J Urol Nephrol 1998; 32: 87-91<br />
127 Gupta NP, Ansari MS, Khaitan A, Sivaramakrishna MS,<br />
Hemal AK, Dogra PN, Seth A. Impact <strong>of</strong> imaging and<br />
thrombus level in management <strong>of</strong> renal cell carcinoma<br />
extending to veins. Urol Int 2004; 72: 129-134<br />
128 Roy C, Tuchmann C, Morel M, Saussine C, Jacqmin D, Tongio<br />
J. Is there still a place for angiography in the management <strong>of</strong><br />
renal mass lesions? Eur Radiol 1999; 9: 329-335<br />
129 Wink MH, Lagerveld BW, Laguna MP, de la Rosette JJ,<br />
Wijkstra H. Cryotherapy for renal-cell cancer: diagnosis,<br />
treatment, and contrast-enhanced ultrasonography for<br />
follow-up. J Endourol 2006; 20: 456-458; discussion 458-459<br />
130 Bosniak MA. Diagnosis and management <strong>of</strong> patients<br />
with complicated cystic lesions <strong>of</strong> the kidney. AJR Am J<br />
Roentgenol 1997; 169: 819-821<br />
131 Bosniak MA. Cystic renal masses: a reevaluation <strong>of</strong> the<br />
usefullness <strong>of</strong> the Bosniak Classification System. Acad Radiol<br />
1996; 3: 981-984<br />
132 Israel GM, Hindman N, Bosniak MA. Evaluation <strong>of</strong> cystic<br />
renal masses: comparison <strong>of</strong> CT and MR imaging by using<br />
the Bosniak classification system. <strong>Radiology</strong> 2004; 231: 365-371<br />
133 Israel GM, Bosniak MA. Calcification in cystic renal masses:<br />
is it important in diagnosis? <strong>Radiology</strong> 2003; 226: 47-52<br />
134 Dietrich CF, Tuma J. Echokontrastmittel in der Sonographie<br />
des Urogenitalsystems. In: Tuma J, Trinkler FB, editors.<br />
Sonographische Differenzialdiagnose (Krankheiten des<br />
Urogenitalsystems). Köln: Deutscher Ärzteverlag, 2009:<br />
519-533<br />
135 Harisinghani MG, Maher MM, Gervais DA, McGovern<br />
F, Hahn P, Jhaveri K, Varghese J, Mueller PR. Incidence<br />
<strong>of</strong> malignancy in complex cystic renal masses (Bosniak<br />
WJR|www.wjgnet.com<br />
Ignee A et al . CEUS <strong>of</strong> renal masses<br />
category III): should imaging-guided biopsy precede<br />
surgery? AJR Am J Roentgenol 2003; 180: 755-758<br />
136 Curry NS, Cochran ST, Bissada NK. Cystic renal masses:<br />
accurate Bosniak classification requires adequate renal CT.<br />
AJR Am J Roentgenol 2000; 175: 339-342<br />
137 Aronson S, Frazier HA, Baluch JD, Hartman DS, Christenson<br />
PJ. Cystic renal masses: usefulness <strong>of</strong> the Bosniak classification.<br />
Urol Radiol 1991; 13: 83-90<br />
138 Siegel CL, McFarland EG, Brink JA, Fisher AJ, Humphrey P,<br />
Heiken JP. CT <strong>of</strong> cystic renal masses: analysis <strong>of</strong> diagnostic<br />
performance and interobserver variation. AJR Am J Roentgenol<br />
1997; 169: 813-818<br />
139 Hirai T, Ohishi H, Yamada R, Imai Y, Hirohashi S, Hirohashi<br />
R, Honda N, Uchida H. Usefulness <strong>of</strong> color Doppler flow<br />
imaging in differential diagnosis <strong>of</strong> multilocular cystic lesions<br />
<strong>of</strong> the kidney. J Ultrasound Med 1995; 14: 771-776<br />
140 Park BK, Kim B, Kim SH, Ko K, Lee HM, Choi HY. Assessment<br />
<strong>of</strong> cystic renal masses based on Bosniak classification:<br />
comparison <strong>of</strong> CT and contrast-enhanced US. Eur J Radiol<br />
2007; 61: 310-314<br />
141 Quaia E, Bertolotto M, Ci<strong>of</strong>fi V, Rossi A, Baratella E, Pizzolato<br />
R, Cov MA. Comparison <strong>of</strong> contrast-enhanced sonography<br />
with unenhanced sonography and contrast-enhanced CT in<br />
the diagnosis <strong>of</strong> malignancy in complex cystic renal masses.<br />
AJR Am J Roentgenol 2008; 191: 1239-1249<br />
142 Clevert DA, Minaifar N, Weckbach S, Jung EM, Stock K,<br />
Reiser M, Staehler M. Multislice computed tomography<br />
versus contrast-enhanced ultrasound in evaluation <strong>of</strong><br />
complex cystic renal masses using the Bosniak classification<br />
system. Clin Hemorheol Microcirc 2008; 39: 171-178<br />
143 Dietrich CF, Ignee A, Barreiros AP, Schreiber-Dietrich<br />
D, Sienz M, Bojunga J, Braden B. Contrast-Enhanced<br />
Ultrasound for Imaging <strong>of</strong> Adrenal Masses. Ultraschall Med<br />
2009; Epub ahead <strong>of</strong> print<br />
144 Dietrich CF, Ignee A, Braden B, Barreiros AP, Ott M, Hocke<br />
M. Improved differentiation <strong>of</strong> pancreatic tumors using<br />
contrast-enhanced endoscopic ultrasound. Clin Gastroenterol<br />
Hepatol 2008; 6: 590-597.e1<br />
S- Editor Cheng JX L- Editor Cant MR E- Editor Ma WH<br />
31 January 28, 2010|Volume 2|Issue 1|
W J R<br />
Online Submissions: http://www.wjgnet.com/1949-8470<strong>of</strong>fice<br />
wjr@wjgnet.com<br />
doi:10.4329/wjr.v2.i1.32<br />
Hui-Xiong Xu, MD, PhD, Series Editor<br />
TOPIC HIGHLIGHT<br />
Diagnosis <strong>of</strong> liver cirrhosis with contrast-enhanced ultrasound<br />
Guang-Jian Liu, Ming-De Lu<br />
Guang-Jian Liu, Department <strong>of</strong> Medical Ultrasonics, Institute<br />
<strong>of</strong> Diagnostic and Interventional Ultrasound, The First Affiliated<br />
Hospital <strong>of</strong> Sun Yat-Sen University, Guangzhou 510080, Guangdong<br />
Province, China<br />
Ming-De Lu, Department <strong>of</strong> Hepatobiliary Surgery, Institute <strong>of</strong><br />
Diagnostic and Interventional Ultrasound, The First Affiliated<br />
Hospital <strong>of</strong> Sun Yat-Sen University, Guangzhou 510080, Guangdong<br />
Province, China<br />
Correspondence to: Ming-De Lu, MD, DMSc, Department <strong>of</strong><br />
Hepatobiliary Surgery, The First Affiliated Hospital <strong>of</strong> Sun Yat-Sen<br />
University, No. 58 Zhongshan Road 2, Guangzhou 510080, Guangdong<br />
Province, China. lumd@21cn.com<br />
Telephone: +86-20-87765183 Fax: +86-20-87765183<br />
Received: December 2, 2009 Revised: December 30, 2009<br />
Accepted: January 4, 2010<br />
Published online: January 28, 2010<br />
Abstract<br />
The assessment <strong>of</strong> the extent <strong>of</strong> liver fibrosis is very<br />
important for the prognosis and clinical management<br />
<strong>of</strong> chronic liver diseases. Although liver biopsy is the<br />
gold standard for the assessment <strong>of</strong> liver fibrosis, new<br />
non-invasive diagnostic methods are urgently needed<br />
in clinical work due to certain limitations and complications<br />
<strong>of</strong> biopsy. Noninvasive imaging studies play an<br />
important role in the diagnosis <strong>of</strong> focal liver disease and<br />
diffuse liver diseases. Among them, ultrasonography<br />
is the first choice for study <strong>of</strong> the liver in clinical work.<br />
With the development <strong>of</strong> ultrasound contrast agents<br />
and contrast specific imaging techniques, contrastenhanced<br />
ultrasound (CEUS) shows good performance<br />
and great potential in the evaluation <strong>of</strong> liver fibrosis.<br />
Researchers have tried different kinds <strong>of</strong> contrast agent<br />
and imaging method, such as arrival time <strong>of</strong> contrast<br />
agent in the hepatic vein, and quantitative analysis <strong>of</strong><br />
the enhancement level <strong>of</strong> liver parenchyma, to evaluate<br />
the degree <strong>of</strong> liver fibrosis during the past 10 years.<br />
This review mainly summarizes the clinical studies concerning<br />
the assessment <strong>of</strong> liver fibrosis using CEUS.<br />
© 2010 Baishideng. All rights reserved.<br />
WJR|www.wjgnet.com<br />
<strong>World</strong> <strong>Journal</strong> <strong>of</strong><br />
<strong>Radiology</strong><br />
<strong>World</strong> J Radiol 2010 January 28; 2(1): 32-36<br />
ISSN 1949-8470 (online)<br />
© 2010 Baishideng. All rights reserved.<br />
Key words: Diagnosis; Liver cirrhosis; Contrast media;<br />
Ultrasound<br />
Peer reviewer: Djordjije Saranovic, MD, PhD, Pr<strong>of</strong>essor, Department<br />
<strong>of</strong> Digestive <strong>Radiology</strong> (First Surgical Clinic), Institute <strong>of</strong><br />
<strong>Radiology</strong>, Clinical Center <strong>of</strong> Serbia, Koste Todorovica 6, 11000<br />
Belgrade, Serbia<br />
Liu GJ, Lu MD. Diagnosis <strong>of</strong> liver cirrhosis with contrast-enhanced<br />
ultrasound. <strong>World</strong> J Radiol 2010; 2(1): 32-36 Available from:<br />
URL: http://www.wjgnet.com/1949-8470/full/v2/i1/32.htm<br />
DOI: http://dx.doi.org/10.4329/wjr.v2.i1.32<br />
INTRODUCTION<br />
Liver fibrosis is mainly caused by chronic liver diseases<br />
such as chronic hepatitis and alcoholic liver disease. Biopsy<br />
is considered as the gold standard for estimation <strong>of</strong><br />
fibrosis. Owing to its limitations <strong>of</strong> sampling error, interobserver<br />
disagreement, and the risks and complications<br />
<strong>of</strong> this invasive procedure, new, reliable noninvasive diagnostic<br />
methods are necessary to take the place <strong>of</strong> liver<br />
biopsy as the first line assessment <strong>of</strong> fibrosis during clinical<br />
work [1-7] . Biochemical tests and imaging techniques are<br />
the two most active research areas for the noninvasive<br />
assessment <strong>of</strong> liver fibrosis. The biochemical tests which<br />
are based on the evaluation <strong>of</strong> a large numbers <strong>of</strong> serological<br />
markers show good performance in predicting<br />
the degree <strong>of</strong> liver fibrosis. However, there are still some<br />
limits, especially in cases <strong>of</strong> Gilbert syndrome, hemolysis<br />
and acute inflammation. Therefore, biomarkers alone are<br />
not sufficient for making a definite decision in a given<br />
patient, and the clinical data must be taken into account [8] .<br />
As to the imaging methods, ultrasonography, computed<br />
tomography (CT) and magnetic resonance imaging (MRI)<br />
are the most traditional and popular, and transient elastography<br />
is a newly developed technique which can rapidly<br />
and noninvasively measure mean tissue stiffness.<br />
Conventional grey scale ultrasound is the first-line<br />
imaging modality in screening <strong>of</strong> liver cirrhosis. Blunt<br />
32 January 28, 2010|Volume 2|Issue 1|
liver edge, liver parenchymal abnormalities, and liver<br />
morphological changes are the direct signs for diagnosis<br />
<strong>of</strong> liver cirrhosis on grey scale ultrasound. Color Doppler<br />
ultrasound can supply some valuable parameters for<br />
different blood vessels in diagnosis <strong>of</strong> liver cirrhosis, but<br />
the reliability and reproducibility <strong>of</strong> the technique limits its<br />
clinical usage in noninvasive diagnosis and assessment <strong>of</strong><br />
severity <strong>of</strong> hepatic fibrosis [9-13] . Conventional CT and MRI<br />
scans can identify irregular or nodular liver surface, liver<br />
parenchymal abnormalities and portal hypertension which<br />
are very important signs for diagnosis <strong>of</strong> hepatic cirrhosis.<br />
The diagnostic accuracies for liver cirrhosis using these<br />
imaging modalities were reported in a recent study as<br />
70.3% for MRI, 67.0% for CT and 64.0% for ultrasound,<br />
and the sensitivities and specificities were 86.7%, 84.3%,<br />
52.4% and 53.9%, 52.9%, 73.5%, respectively [14] . With the<br />
development <strong>of</strong> super-paramagnetic iron oxide contrast<br />
agents for MRI, Kupffer-specific imaging may prove to be<br />
a new point <strong>of</strong> view with which to diagnose and evaluate<br />
the severity <strong>of</strong> the liver cirrhosis on MRI scan [15-17] .<br />
CONTRAST-ENHANCED ULTRASOUND<br />
Newly developed ultrasound contrast agents (UCAs) and<br />
contrast-enhanced ultrasound (CEUS) techniques show<br />
great potential in the diagnosis <strong>of</strong> focal and diffuse liver<br />
disease [18,19] . Currently, the UCAs used in clinical CEUS<br />
examination are characterized by a microbubble structure<br />
consisting <strong>of</strong> gas bubbles stabilized by a shell. Globally,<br />
there are three kinds <strong>of</strong> UCA which can be used<br />
in liver imaging : Levovist (air with a galactose/palmitic<br />
acid surfactant; SH U 508A; Schering, Berlin, Germany),<br />
SonoVue (sulfur hexafluoride with a phospholipid shell;<br />
BR1; Bracco, Milan, Italy) and Sonazoid (perfluorobutane<br />
with a lipid shell; NC100100; Amersham Health,<br />
Oslo, Norway) [18,19] . SonoVue (sulfur hexafluoride) and<br />
Sonazoid (perfluorobutane) contain low solubility gases<br />
and show higher microbubble stability than Levovist<br />
which contains air. After intravenous injection <strong>of</strong> UCA,<br />
the microbubbles act as blood pool tracers, strongly increase<br />
the ultrasound backscatter and are therefore useful<br />
for enhancement <strong>of</strong> blood echogenicity and for the<br />
assessment <strong>of</strong> blood flow in the vasculature. In addition,<br />
Levovist and Sonazoid have been proved by both in vivo<br />
and in vitro studies to be phagocytosed by the reticuloendothelial<br />
system <strong>of</strong> the liver and spleen. The liver parenchyma<br />
specific imaging can be obtained 10 min after<br />
administration <strong>of</strong> the contrast agents [20-24] .<br />
The visualization <strong>of</strong> enhancement caused by microbubbles<br />
requires contrast specific imaging techniques,<br />
which are generally based on the cancellation and/or separation<br />
<strong>of</strong> linear US signals from tissue and utilization <strong>of</strong><br />
the nonlinear response from microbubbles. A non-linear<br />
response from microbubbles could not only be induced<br />
by microbubble disruption at high acoustic pressure but<br />
also by oscillations at low acoustic pressure. When Levovist<br />
is used as contrast agent, high mechanical index (MI)<br />
intermittent imaging with low frame rates should be used,<br />
due to the lower resistance to acoustic pressure <strong>of</strong> the air<br />
WJR|www.wjgnet.com<br />
Liu GJ et al . Diagnosis <strong>of</strong> liver cirrhosis with CEUS<br />
filled microbubble. When SonoVue or Sonazoid is used<br />
as contrast agent, low MI imaging could be used, which<br />
enables minimal disruption <strong>of</strong> microbubbles, real time<br />
and effective investigations <strong>of</strong> the dynamic enhancement<br />
pattern, and effective tissue signal suppression [18,19] .<br />
CEUS IN DIAGNOSIS OF LIVER CIRRHOSIS<br />
Contrast enhanced ultrasound has been used in the diagnosis<br />
and evaluation <strong>of</strong> liver cirrhosis during the past<br />
10 years. Researchers mainly focused their studies on the<br />
hemodynamic changes and kupffer cell function changes<br />
followed by liver fibrosis, and tried to find and prove these<br />
changes using different kinds <strong>of</strong> CEUS techniques and<br />
UCAs [25-36] .<br />
Hepatic vein arrival time<br />
The hemodynamic changes which accompany hepatic<br />
cirrhosis mainly include arterialization <strong>of</strong> the liver, intrahepatic<br />
shunts, pulmonary arteriovenous shunts, and a<br />
hyperdynamic circulatory state. All <strong>of</strong> these changes will<br />
make the hepatic first pass <strong>of</strong> contrast agent injected into<br />
a peripheral vein faster in a cirrhotic liver compared with<br />
normal liver.<br />
Albrecht et al [25] studied the hepatic vein transit time<br />
using continuous spectral Doppler ultrasonography and<br />
Levovist. They found patients with cirrhosis showed<br />
a much earlier onset <strong>of</strong> enhancement (arrival time;<br />
mean 18.3 s) and peak enhancement (mean 55.5 s) than<br />
controls (49.8 s and 97.5 s) or patients with non-cirrhotic<br />
diffuse liver disease (35.8 s and 79.7 s). All patients with<br />
cirrhosis had an arrival time <strong>of</strong> the bolus <strong>of</strong> less than<br />
24 s, whereas the arrival time was 24 s or more in 22 <strong>of</strong><br />
the 23 other participants. Taking a hepatic vein arrival<br />
time <strong>of</strong> 24 s as the diagnostic criteria for liver cirrhosis,<br />
the sensitivity and specificity were 100% and 96%,<br />
respectively. They also found that peak enhancement was<br />
higher in patients with cirrhosis (mean 48.7 units) than in<br />
the other two groups (12.5 and 12.3 units, respectively).<br />
They concluded that analysis <strong>of</strong> liver transit time <strong>of</strong><br />
a bolus <strong>of</strong> UCA provides useful information about<br />
haemodynamic changes in patients with cirrhosis, and<br />
measurement <strong>of</strong> the arrival time <strong>of</strong> the bolus allows<br />
discrimination <strong>of</strong> patients with cirrhosis from controls<br />
and from patients with non-cirrhotic diffuse liver disease,<br />
and has potential as a non-invasive test for cirrhosis. Bang<br />
et al [26] compared pulse inversion imaging with spectral<br />
Doppler quantification in assessment <strong>of</strong> the arrival <strong>of</strong> a<br />
contrast agent in the hepatic veins in six patients. They<br />
found the hepatic vein arrival times measured by two<br />
different methods were within 2 s apart in five patients<br />
and within 5 s apart in one patient. They believe pulse<br />
inversion imaging will be a simple and accurate method<br />
for evaluation <strong>of</strong> hepatic vein arrival time. Sugimoto et al [27]<br />
evaluated hepatic vein arrival time using Levovist and<br />
pulse inversion imaging in 15 patients. They found that<br />
the time-acoustic intensity curves for hepatic vein could<br />
be classified as a gradual-rising curve which was seen in<br />
33 January 28, 2010|Volume 2|Issue 1|
Liu GJ et al . Diagnosis <strong>of</strong> liver cirrhosis with CEUS<br />
all controls and non-cirrhotic patients and a rapid-rising<br />
curve which was seen in all cirrhotic patients. They also<br />
showed that the hepatic vein arrival time was significantly<br />
earlier in cirrhotic patients compared with normal and<br />
hepatitis patients (18 s vs 31 s, 30 s), respectively. They<br />
believe CEUS and hepatic vein transit time is a useful<br />
noninvasive diagnosis method for liver cirrhosis with<br />
high sensitivity and specificity.<br />
With the development <strong>of</strong> contrast specific techniques<br />
and the emergence <strong>of</strong> new generation contrast agent,<br />
real-time CEUS became a powerful tool for evaluation<br />
<strong>of</strong> liver cirrhosis. Ridolfi et al [28] tried to use low MI<br />
CEUS with SonoVue to evaluate the severity <strong>of</strong> chronic<br />
hepatitis C. They found the mean hepatic vein arrival<br />
time decreased progressively with increasing severity <strong>of</strong><br />
liver disease, all patients with liver cirrhosis had a hepatic<br />
vein arrival time <strong>of</strong> 17 s or less, whereas values <strong>of</strong> 18 s<br />
or more were recorded for all controls and for almost<br />
all patients (20/22) with non-cirrhotic liver disease.<br />
But within the group <strong>of</strong> chronic hepatitis C, Metavir<br />
scores <strong>of</strong> fibrosis and necro-inflammatory changes had<br />
no significant effect on hepatic vein arrival times. They<br />
concluded that hepatic vein arrival time might be a simple<br />
and non-invasive method for reliably excluding cirrhosis<br />
with signs <strong>of</strong> portal hypertension, but not for assessing<br />
the severity <strong>of</strong> either chronic hepatitis C or cirrhosis. Lim<br />
et al [29] compared Levovist and SonoVue in evaluation<br />
<strong>of</strong> hepatic vein arrival time in 40 hepatitis C-related<br />
liver disease patients and 25 normal volunteers. They<br />
found that mean hepatic vein arrival times in control,<br />
mild hepatitis, moderate or severe hepatitis, and cirrhosis<br />
groups were 38.3, 47.5, 29.5 and 17.6 s, respectively, with<br />
Levovist; and 29.4, 27.4, 22.9 and 16.4 s, respectively,<br />
with SonoVue. The hepatic vein arrival time decreased as<br />
severity increased in imaging with both contrast agents.<br />
There was no significant difference in hepatic vein arrival<br />
time between mild and moderate hepatitis groups with<br />
SonoVue; however, there were significant differences<br />
in hepatic vein arrival time between all patient groups<br />
using Levovist. Hepatic vein arrival time <strong>of</strong> SonoVue<br />
was shorter than that <strong>of</strong> Levovist in all groups except<br />
the cirrhosis group where the hepatic vein arrival time<br />
<strong>of</strong> the two contrast agents was similar. Although hepatic<br />
vein arrival time seems to fulfill the task <strong>of</strong> diagnosis<br />
<strong>of</strong> liver cirrhosis, some researchers also found that the<br />
hepatic vein transit time was accelerated in the liver with<br />
metastatic liver tumors [37-39] . This is the main limitation <strong>of</strong><br />
using hepatic vein transit time to diagnose liver cirrhosis<br />
since there may be many other situations which will also<br />
result in similar hemodynamic changes.<br />
Some researchers also studied the micro-hemodynamic<br />
changes which follow liver cirrhosis using CEUS.<br />
Giuseppetti et al [33] used the destruction and replenishment<br />
CEUS technique to evaluate the changes in hepatic<br />
parenchymal blood flow in cirrhotic patients and normal<br />
patients. Pulse inversion harmonic imaging was obtained<br />
at progressively increasing pulse intervals <strong>of</strong> 2, 4, 7 and<br />
10 s in the same scan plane during infusion <strong>of</strong> Levo-<br />
WJR|www.wjgnet.com<br />
vist (300 mg/mL, 150 mL/h). Pulse intervals vs signal<br />
intensity (PI-SI) plots were made to illustrate the speed<br />
<strong>of</strong> blood in the liver parenchyma. They found the slope<br />
<strong>of</strong> the PI-SI plot <strong>of</strong> the Child A cirrhotic patients was<br />
significantly lower than the slope <strong>of</strong> the normal controls<br />
and <strong>of</strong> the Child C cirrhotic patients; conversely, no<br />
significant differences were found between the slope <strong>of</strong><br />
the patients with Child C cirrhosis and <strong>of</strong> the normal<br />
controls. The slope <strong>of</strong> the patients with liver cirrhosis<br />
presented with a significantly higher variability than was<br />
observed in the normal controls. They explained their<br />
findings by suggesting the slope <strong>of</strong> the PI-SI plot obtained<br />
by placing the ROI in a region <strong>of</strong> parenchyma<br />
reflects the average speed <strong>of</strong> both the arterial and the venous<br />
components <strong>of</strong> the microcirculation. They thought<br />
that liver perfusion was provided mainly by the portal<br />
circulation in most patients with Child A cirrhosis, and<br />
because the velocity <strong>of</strong> the portal blood flow is reduced,<br />
an overall reduction <strong>of</strong> the average velocity <strong>of</strong> the parenchymal<br />
blood is observed. In patients with Child<br />
C cirrhosis and advanced disease, however, the portal<br />
component <strong>of</strong> the hepatic blood flow can be markedly<br />
reduced, with increased arterial perfusion and significant<br />
portosystemic venous and arteriovenous shunting. These<br />
hemodynamic changes can cause a prevalence <strong>of</strong> the<br />
arterial component <strong>of</strong> the microcirculation, with higher<br />
velocity flows, causing an overall increase <strong>of</strong> the average<br />
velocity <strong>of</strong> the parenchymal blood.<br />
Enhancement level <strong>of</strong> liver parenchyma<br />
Some researchers have tried to use enhancement level<br />
<strong>of</strong> liver parenchyma on CEUS to diagnose liver cirrhosis<br />
based on the theory <strong>of</strong> diminished or function damage<br />
<strong>of</strong> Kupffer cells accompanied with the hepatic cirrhosis.<br />
Fujita et al [34] used Levovist and stimulated acoustic emission<br />
imaging, and studied 114 patients with alcoholic<br />
liver disease and other chronic liver disease. They compared<br />
the enhancement level <strong>of</strong> the hepatic parenchyma<br />
and right kidney at 20 s, 90 s, and 5 min after injection<br />
<strong>of</strong> Levovist. The contrast patterns <strong>of</strong> the liver and kidney<br />
were divided into three patterns. In pattern A, only<br />
the kidney was strongly enhanced at 20 s, both liver and<br />
kidney were strongly enhanced at 90 s, and only the liver<br />
was enhanced at 5 min. In pattern B, both the liver and<br />
the kidney were strongly enhanced at 20 s and 90 s, but<br />
only the liver was strongly enhanced at 5 min. In pattern<br />
C, both the liver and the kidney were strongly enhanced<br />
at 20 s and 90 s, and both organs were weakly enhanced<br />
at 5 min. They found 83% <strong>of</strong> normal livers showed<br />
pattern A, whereas pattern B was found in 60%-86%<br />
<strong>of</strong> patients with chronic liver disease, and almost all <strong>of</strong><br />
the patients with alcoholic liver cirrhosis had pattern C.<br />
They supposed that Kupffer cell dysfunction in liver cirrhosis<br />
resulted in slower clearance <strong>of</strong> contrast agent and<br />
thus weak enhancement <strong>of</strong> liver parenchyma in pattern C.<br />
Gasparini et al [35] studied 10 normal volunteers, 16 Child<br />
A and 16 Child C cirrhotic patients with CEUS using<br />
Levovist. They found the enhancement level <strong>of</strong> liver<br />
34 January 28, 2010|Volume 2|Issue 1|
parenchyma in late phase (7 min after administration <strong>of</strong><br />
contrast agent) decreased significantly both in patients<br />
with Child A (P < 0.05) and Child C (P < 0.001) cirrhosis<br />
compared with normal liver, and a statistically significant<br />
signal intensity decrease was also observed from the<br />
patients with Child A to those with Child C cirrhosis<br />
(P < 0.01). Their explanation was that the decreased<br />
uptake <strong>of</strong> the Levovist microbubbles by the reticuloendothelial<br />
system in cirrhotic liver due to impaired<br />
functional capacity <strong>of</strong> the Kupffer cells secondary to increased<br />
portosystemic shunting <strong>of</strong> blood resulted in the<br />
observed difference between the groups. Kaneko et al [36]<br />
compared the parenchyma enhancement with the degree<br />
<strong>of</strong> liver dysfunction using pulse-inversion ultrasonography<br />
and Levovist. They found there was a significant<br />
inverse correlation between the gray scale <strong>of</strong> the liver<br />
parenchyma and the hepatic fibrosis index (r = -0.809,<br />
P < 0.01). The average signal intensity <strong>of</strong> the liver parenchyma<br />
was 144.5 in a normal liver, 133.6 in chronic<br />
hepatitis, and 102.6 in liver cirrhosis, demonstrating a<br />
significant difference between a normal and cirrhotic<br />
liver (P < 0.01). They concluded that the signal intensity<br />
<strong>of</strong> a microbubble disruption <strong>of</strong> the liver parenchyma in<br />
the late phase <strong>of</strong> enhancement with Levovist could reflect<br />
the degree <strong>of</strong> hepatic fibrosis.<br />
CONCLUSION<br />
In conclusion, hepatic vein arrival time and enhancement<br />
level <strong>of</strong> liver parenchyma in late phase may be valuable<br />
clues for the diagnosis <strong>of</strong> liver cirrhosis. Most researchers<br />
believe that the hemodynamic changes in cirrhotic liver<br />
mainly happen within the liver which results in faster<br />
hepatic vein transit time on CEUS compared with normal<br />
liver. Taking a hepatic vein arrival time <strong>of</strong> less than 21 s as<br />
the diagnostic criteria, the sensitivity, specificity, positive<br />
predictive value and negative predictive value <strong>of</strong> CEUS<br />
in diagnosis <strong>of</strong> liver cirrhosis was 100%, 80%, 74% and<br />
100%, respectively. Many researchers also pointed out<br />
that the hepatic vein arrival time correlated with the<br />
severity <strong>of</strong> liver fibrosis. Different contrast agents result in<br />
different hepatic vein arrival time on CEUS. The second<br />
generation contrast agent SonoVue, has faster hepatic<br />
vein arrival time than Levovist in normal and hepatitis<br />
patients. Finally, hepatic metastasis will also result in a<br />
faster hepatic vein arrival time on CEUS, which is another<br />
limitation <strong>of</strong> hepatic vein arrival time in the diagnosis <strong>of</strong><br />
liver cirrhosis. Enhancement level <strong>of</strong> liver parenchyma<br />
in late phase <strong>of</strong> CEUS shows a negative correlation with<br />
the severity <strong>of</strong> liver cirrhosis. Due to dysfunction <strong>of</strong><br />
Kupffer cells in cirrhotic liver, the enhancement <strong>of</strong> liver<br />
parenchyma in late phase was much darker than normal<br />
liver. In conclusion, CEUS may be an easy and valuable<br />
non-invasive method for diagnosis and assessment <strong>of</strong> liver<br />
cirrhosis.<br />
REFERENCES<br />
1 Bravo AA, Sheth SG, Chopra S. Liver biopsy. N Engl J Med<br />
2001; 344: 495-500<br />
WJR|www.wjgnet.com<br />
Liu GJ et al . Diagnosis <strong>of</strong> liver cirrhosis with CEUS<br />
2 Regev A, Berho M, Jeffers LJ, Milikowski C, Molina EG,<br />
Pyrsopoulos NT, Feng ZZ, Reddy KR, Schiff ER. Sampling<br />
error and intraobserver variation in liver biopsy in patients<br />
with chronic HCV infection. Am J Gastroenterol 2002; 97:<br />
2614-2618<br />
3 Colloredo G, Guido M, Sonzogni A, Leandro G. Impact <strong>of</strong><br />
liver biopsy size on histological evaluation <strong>of</strong> chronic viral<br />
hepatitis: the smaller the sample, the milder the disease. J<br />
Hepatol 2003; 39: 239-244<br />
4 Bedossa P, Dargère D, Paradis V. Sampling variability <strong>of</strong><br />
liver fibrosis in chronic hepatitis C. Hepatology 2003; 38:<br />
1449-1457<br />
5 Ratziu V, Charlotte F, Heurtier A, Gombert S, Giral P,<br />
Bruckert E, Grimaldi A, Capron F, Poynard T. Sampling<br />
variability <strong>of</strong> liver biopsy in nonalcoholic fatty liver disease.<br />
<strong>Gastroenterology</strong> 2005; 128: 1898-1906<br />
6 Bedossa P, Poynard T, Naveau S, Martin ED, Agostini<br />
H, Chaput JC. Observer variation in assessment <strong>of</strong> liver<br />
biopsies <strong>of</strong> alcoholic patients. Alcohol Clin Exp Res 1988; 12:<br />
173-178<br />
7 Poynard T, Ratziu V, Bedossa P. Appropriateness <strong>of</strong> liver<br />
biopsy. Can J Gastroenterol 2000; 14: 543-548<br />
8 Poynard T, Morra R, Ingiliz P, Imbert-Bismut F, Thabut D,<br />
Messous D, Munteanu M, Massard J, Benhamou Y, Ratziu<br />
V. Assessment <strong>of</strong> liver fibrosis: noninvasive means. Saudi J<br />
Gastroenterol 2008; 14: 163-173<br />
9 Lim AK, Patel N, Eckersley RJ, Kuo YT, Goldin RD, Thomas<br />
HC, Cosgrove DO, Taylor-Robinson SD, Blomley MJ. Can<br />
Doppler sonography grade the severity <strong>of</strong> hepatitis C-related<br />
liver disease? AJR Am J Roentgenol 2005; 184: 1848-1853<br />
10 Zoli M, Magalotti D, Bianchi G, Ghigi G, Orlandini C,<br />
Grimaldi M, Marchesini G, Pisi E. Functional hepatic flow<br />
and Doppler-assessed total hepatic flow in control subjects<br />
and in patients with cirrhosis. J Hepatol 1995; 23: 129-134<br />
11 Colli A, Cocciolo M, Riva C, Martinez E, Prisco A, Pirola<br />
M, Bratina G. Abnormalities <strong>of</strong> Doppler waveform <strong>of</strong><br />
the hepatic veins in patients with chronic liver disease:<br />
correlation with histologic findings. AJR Am J Roentgenol<br />
1994; 162: 833-837<br />
12 Iwao T, Toyonaga A, Shigemori H, Oho K, Sakai T, Tayama<br />
C, Masumoto H, Sato M, Tanikawa K. Hepatic artery<br />
hemodynamic responsiveness to altered portal blood flow<br />
in normal and cirrhotic livers. <strong>Radiology</strong> 1996; 200: 793-798<br />
13 Piscaglia F, Gaiani S, Zironi G, Gramantieri L, Casali A,<br />
Siringo S, Serra C, Bolondi L. Intra- and extrahepatic arterial<br />
resistances in chronic hepatitis and liver cirrhosis. Ultrasound<br />
Med Biol 1997; 23: 675-682<br />
14 Kudo M, Zheng RQ, Kim SR, Okabe Y, Osaki Y, Iijima H, Itani<br />
T, Kasugai H, Kanematsu M, Ito K, Usuki N, Shimamatsu K,<br />
Kage M, Kojiro M. Diagnostic accuracy <strong>of</strong> imaging for liver<br />
cirrhosis compared to histologically proven liver cirrhosis. A<br />
multicenter collaborative study. Intervirology 2008; 51 Suppl 1:<br />
17-26<br />
15 Elizondo G, Weissleder R, Stark DD, Guerra J, Garza J, Fretz<br />
CJ, Todd LE, Ferrucci JT. Hepatic cirrhosis and hepatitis:<br />
MR imaging enhanced with superparamagnetic iron oxide.<br />
<strong>Radiology</strong> 1990; 174: 797-801<br />
16 Tanimoto A, Yuasa Y, Shinmoto H, Jinzaki M, Imai Y, Okuda<br />
S, Kuribayashi S. Superparamagnetic iron oxide-mediated<br />
hepatic signal intensity change in patients with and without<br />
cirrhosis: pulse sequence effects and Kupffer cell function.<br />
<strong>Radiology</strong> 2002; 222: 661-666<br />
17 Aguirre DA, Behling CA, Alpert E, Hassanein TI, Sirlin CB.<br />
Liver fibrosis: noninvasive diagnosis with double contrast<br />
material-enhanced MR imaging. <strong>Radiology</strong> 2006; 239: 425-437<br />
18 Albrecht T, Blomley M, Bolondi L, Claudon M, Correas JM,<br />
Cosgrove D, Greiner L, Jäger K, Jong ND, Leen E, Lencioni R,<br />
Lindsell D, Martegani A, Solbiati L, Thorelius L, Tranquart<br />
F, Weskott HP, Whittingham T. Guidelines for the use <strong>of</strong><br />
contrast agents in ultrasound. January 2004. Ultraschall Med<br />
2004; 25: 249-256<br />
35 January 28, 2010|Volume 2|Issue 1|
Liu GJ et al . Diagnosis <strong>of</strong> liver cirrhosis with CEUS<br />
19 Claudon M, Cosgrove D, Albrecht T, Bolondi L, Bosio M,<br />
Calliada F, Correas JM, Darge K, Dietrich C, D'On<strong>of</strong>rio<br />
M, Evans DH, Filice C, Greiner L, Jäger K, Jong N, Leen<br />
E, Lencioni R, Lindsell D, Martegani A, Meairs S, Nolsøe<br />
C, Piscaglia F, Ricci P, Seidel G, Skjoldbye B, Solbiati L,<br />
Thorelius L, Tranquart F, Weskott HP, Whittingham T.<br />
Guidelines and good clinical practice recommendations<br />
for contrast enhanced ultrasound (CEUS) - update 2008.<br />
Ultraschall Med 2008; 29: 28-44<br />
20 Blomley MJ, Albrecht T, Cosgrove DO, Eckersley RJ, Butler-<br />
Barnes J, Jayaram V, Patel N, Heckemann RA, Bauer A,<br />
Schlief R. Stimulated acoustic emission to image a late liver<br />
and spleen-specific phase <strong>of</strong> Levovist in normal volunteers<br />
and patients with and without liver disease. Ultrasound Med<br />
Biol 1999; 25: 1341-1352<br />
21 Suzuki S, Iijima H, Moriyasu F, Sasaki S, Yanagisawa K,<br />
Miyahara T, Oguma K, Yoshida M, Horibe T, Ito N, Kakizaki<br />
D, Abe K, Tsuchiya K. Differential diagnosis <strong>of</strong> hepatic<br />
nodules using delayed parenchymal phase imaging <strong>of</strong><br />
levovist contrast ultrasound: comparative study with SPIO-<br />
MRI. Hepatol Res 2004; 29: 122-126<br />
22 Watanabe R, Matsumura M, Munemasa T, Fujimaki M,<br />
Suematsu M. Mechanism <strong>of</strong> hepatic parenchyma-specific<br />
contrast <strong>of</strong> microbubble-based contrast agent for ultrasonography:<br />
microscopic studies in rat liver. Invest Radiol 2007; 42:<br />
643-651<br />
23 Yanagisawa K, Moriyasu F, Miyahara T, Yuki M, Iijima H.<br />
Phagocytosis <strong>of</strong> ultrasound contrast agent microbubbles by<br />
Kupffer cells. Ultrasound Med Biol 2007; 33: 318-325<br />
24 Iijima H, Moriyasu F, Miyahara T, Yanagisawa K. Ultrasound<br />
contrast agent, Levovist microbubbles are phagocytosed by<br />
Kupffer cells-In vitro and in vivo studies. Hepatol Res 2006; 35:<br />
235-237<br />
25 Albrecht T, Blomley MJ, Cosgrove DO, Taylor-Robinson SD,<br />
Jayaram V, Eckersley R, Urbank A, Butler-Barnes J, Patel N.<br />
Non-invasive diagnosis <strong>of</strong> hepatic cirrhosis by transit-time<br />
analysis <strong>of</strong> an ultrasound contrast agent. Lancet 1999; 353:<br />
1579-1583<br />
26 Bang N, Nielsen MB, Rasmussen AN, Osterhammel PA,<br />
Pedersen JF. Hepatic vein transit time <strong>of</strong> an ultrasound<br />
contrast agent: simplified procedure using pulse inversion<br />
imaging. Br J Radiol 2001; 74: 752-755<br />
27 Sugimoto H, Kaneko T, Hirota M, Tezel E, Nakao A. Earlier<br />
hepatic vein transit-time measured by contrast ultrasonography<br />
reflects intrahepatic hemodynamic changes accompanying<br />
cirrhosis. J Hepatol 2002; 37: 578-583<br />
28 Ridolfi F, Abbattista T, Marini F, Vedovelli A, Quagliarini<br />
P, Busilacchi P, Brunelli E. Contrast-enhanced ultrasound<br />
WJR|www.wjgnet.com<br />
to evaluate the severity <strong>of</strong> chronic hepatitis C. Dig Liver Dis<br />
2007; 39: 929-935<br />
29 Lim AK, Patel N, Eckersley RJ, Goldin RD, Thomas HC,<br />
Cosgrove DO, Taylor-Robinson SD, Blomley MJ. Hepatic<br />
vein transit time <strong>of</strong> SonoVue: a comparative study with<br />
Levovist. <strong>Radiology</strong> 2006; 240: 130-135<br />
30 Lim AK, Taylor-Robinson SD, Patel N, Eckersley RJ, Goldin<br />
RD, Hamilton G, Foster GR, Thomas HC, Cosgrove DO,<br />
Blomley MJ. Hepatic vein transit times using a microbubble<br />
agent can predict disease severity non-invasively in patients<br />
with hepatitis C. Gut 2005; 54: 128-133<br />
31 Blomley MJ, Lim AK, Harvey CJ, Patel N, Eckersley RJ,<br />
Basilico R, Heckemann R, Urbank A, Cosgrove DO, Taylor-<br />
Robinson SD. Liver microbubble transit time compared with<br />
histology and Child-Pugh score in diffuse liver disease: a<br />
cross sectional study. Gut 2003; 52: 1188-1193<br />
32 Gaiani S, Serra C, Piscaglia F, Celli N, Rasciti L, Miglioli M,<br />
Bolondi L. Effect <strong>of</strong> Levovist on splanchnic hemodynamics<br />
in cirrhotic patients. Ultrasound Med Biol 2003; 29: 643-648<br />
33 Giuseppetti GM, Argalia G, Abbattista T. Liver cirrhosis:<br />
evaluation <strong>of</strong> haemodynamic changes using an ultrasound<br />
contrast agent. Eur J Radiol 2004; 51: 27-33<br />
34 Fujita Y, Watanabe M, Sasao K, Wakui N, Shinohara M, Ishii<br />
K, Sumino Y. Investigation <strong>of</strong> liver parenchymal flow using<br />
contrast-enhanced ultrasound in patients with alcoholic<br />
liver disease. Alcohol Clin Exp Res 2004; 28: 169S-173S<br />
35 Gasparini C, Bertolotto M, Crocè SL, Perrone R, Quaia E,<br />
Tiribelli C. Evaluation <strong>of</strong> liver parenchymal blood flow with<br />
contrast-enhanced US: preliminary results in healthy and<br />
cirrhotic patients. Acad Radiol 2003; 10: 869-876<br />
36 Kaneko T, Teshigawara O, Sugimoto H, Hirota M, Inoue S,<br />
Takeda S, Nakao A. Signal intensity <strong>of</strong> the liver parenchyma<br />
in microbubble contrast agent in the late liver phase reflects<br />
advanced fibrosis <strong>of</strong> the liver. Liver Int 2005; 25: 288-293<br />
37 Blomley MJ, Albrecht T, Cosgrove DO, Jayaram V, Eckersley<br />
RJ, Patel N, Taylor-Robinson S, Bauer A, Schlief R. Liver<br />
vascular transit time analyzed with dynamic hepatic venography<br />
with bolus injections <strong>of</strong> an US contrast agent: early<br />
experience in seven patients with metastases. <strong>Radiology</strong> 1998;<br />
209: 862-866<br />
38 Zhou JH, Li AH, Cao LH, Jiang HH, Liu LZ, Pei XQ, Han<br />
F. Haemodynamic parameters <strong>of</strong> the hepatic artery and<br />
vein can detect liver metastases: assessment using contrastenhanced<br />
ultrasound. Br J Radiol 2008; 81: 113-119<br />
39 Bernatik T, Strobel D, Häusler J, Hahn EG, Becker D. [Hepatic<br />
transit time <strong>of</strong> an ultrasound echo enhancer indicating the<br />
presence <strong>of</strong> liver metastases - first clinical results] Ultraschall<br />
Med 2002; 23: 91-95<br />
S- Editor Cheng JX L- Editor Lalor PF E- Editor Zheng XM<br />
36 January 28, 2010|Volume 2|Issue 1|
W J R<br />
Online Submissions: http://www.wjgnet.com/1949-8470<strong>of</strong>fice<br />
wjr@wjgnet.com<br />
doi:10.4329/wjr.v2.i1.37<br />
Ewald Moser, PhD, Series Editor<br />
Ultra-high-field magnetic resonance: Why and when?<br />
Ewald Moser<br />
Ewald Moser, MR Center <strong>of</strong> Excellence, Center for Medical<br />
Physics and Biomedical Engineering, Medical University <strong>of</strong><br />
Vienna, A-1180 Vienna, Austria<br />
Author contributions: Moser E is the sole author <strong>of</strong> this editorial.<br />
Supported by An unrestricted research grant between Siemens<br />
Medical Solutions and the Medical University <strong>of</strong> Vienna, Vienna,<br />
Austria<br />
Correspondence to: Ewald Moser, PhD, MR Center <strong>of</strong> Excellence,<br />
Center for Medical Physics and Biomedical Engineering,<br />
Medical University <strong>of</strong> Vienna, A-1180 Vienna,<br />
Austria. ewald.moser@meduniwien.ac.at<br />
Telephone: +43-1-404006459 Fax: +43-1-404006475<br />
Received: December 11, 2009 Revised: January 10, 2010<br />
Accepted: January 13, 2010<br />
Published online: January 28, 2010<br />
Abstract<br />
This paper briefly summarizes the development <strong>of</strong><br />
magnetic resonance imaging and spectroscopy in<br />
medicine. Aspects <strong>of</strong> magnetic resonancephysics and<br />
-technology relevant at ultra-high magnetic fields as<br />
well as current limitations are highlighted. Based on<br />
the first promising studies, potential clinical applications<br />
at 7 Tesla are suggested. Other aims are to stimulate<br />
awareness <strong>of</strong> the potential <strong>of</strong> ultra-high field magnetic<br />
resonance and to stimulate active participation in much<br />
needed basic or clinical research at 7 Tesla or higher.<br />
© 2010 Baishideng. All rights reserved.<br />
Key words: Alzheimer’s disease; Brain tumors; Cartilage;<br />
Functional magnetic resonance imaging; Magnetic<br />
resonance; Magnetic resonance spectroscopy; Multiple<br />
sclerosis; Ultra-high field magnetic resonance methods<br />
Peer reviewer: Juebin Huang, MD, PhD, Assistant Pr<strong>of</strong>essor,<br />
Department <strong>of</strong> Neurology, The University <strong>of</strong> Mississippi Medical<br />
Center, 2500 N. State Street, Jackson, MS 39216, United States<br />
Moser E. Ultra-high-field magnetic resonance: Why and when?<br />
<strong>World</strong> J Radiol 2010; 2(1): 37-40 Available from: URL: http://<br />
WJR|www.wjgnet.com<br />
<strong>World</strong> <strong>Journal</strong> <strong>of</strong><br />
<strong>Radiology</strong><br />
<strong>World</strong> J Radiol 2010 January 28; 2(1): 37-40<br />
ISSN 1949-8470 (online)<br />
© 2010 Baishideng. All rights reserved.<br />
OBSERVATION<br />
www.wjgnet.com/1949-8470/full/v2/i1/37.htm DOI: http://<br />
dx.doi.org/10.4329/wjr.v2.i1.37<br />
From the very beginning, optimum field strength was a<br />
topic <strong>of</strong> debate in clinical proton magnetic resonance<br />
imaging (MRI) [1] . Earlier on it was even suggested that<br />
whole-body MRI would not be possible above 10 MHz<br />
or 0.24 Tesla [2] . Furthermore, based on ex vivo studies it<br />
was expected that T1-contrast between various tissues<br />
and pathologies in the human body would strongly<br />
diminish above 100 MHz, leading to reduced image<br />
contrast [3] . Diagnostic contrast based on relaxation times,<br />
in general, was shown to be strongest at very low fields.<br />
As we all know, however, the brilliance <strong>of</strong> high-field<br />
MRI (≥ 1.5 T) won the race and also benefited magnetic<br />
resonance spectroscopy (MRS) [4] . After a decade <strong>of</strong> highend<br />
clinical 1.5 T MRI, and based on initial experience<br />
at 4 T in a few laboratories, research at 3 T started and<br />
translated very well into clinical imaging [5,6] . Despite<br />
the fact that 3 T clinical MR-systems started selling<br />
spectacularly, physicists and engineers continued to work<br />
on 7 T and higher fields in human MR-research (following<br />
the leading chemical and biochemical NMR work as<br />
well as animal research, now operating at up to 20 T<br />
for small animals). Note, however, that the first 7 T/90<br />
cm magnet was already installed in 1999 demonstrating<br />
increasing signal-to-noise ratio (SNR) and more artifacts<br />
as compared to 4 T [7] .<br />
Still, it seems to be appropriate to ask whether or not<br />
patients will ever actually benefit from higher magnetic<br />
field strengths in clinical MRI and MRS, or will this field<br />
stay an academic playground? This paper will briefly<br />
review some MR-physics and -technology at around 7 T,<br />
and touch on current and future applications in clinical<br />
diagnostics.<br />
Basically, the application <strong>of</strong> MR is not simple but<br />
the technique is rather versatile [8] in stark contrast to<br />
computed tomography or positron-emission tomography<br />
(PET) where endogenous contrast manipulation is rather<br />
37 January 28, 2010|Volume 2|Issue 1|
Moser E. Ultra-high-field MR<br />
limited [i.e. image contrast is <strong>of</strong>ten achieved via exogenous<br />
contrast agents (CAs) or tracers]. In MR, three different<br />
magnetic fields (i.e. static, circular polarized, (linear)<br />
orthogonal gradients) have to interact properly and<br />
several data acquisition parameters need to be adjusted<br />
in a sensible way in order to obtain reliable diagnostic<br />
information. Furthermore, it is not so much the field<br />
strength (and corresponding resonance frequency) but<br />
the wavelength within the human body, which dictates<br />
interaction and, thus, information content. The lower the<br />
field strength the longer the length <strong>of</strong> RF-waves in the<br />
tissue will be, changing from about 1 m for protons at<br />
1.5 T to several centimeters at ≥ 7 T. It seems obvious<br />
that the much shorter wavelength in proton MRI - now<br />
in the range <strong>of</strong> body organ dimensions - will lead to<br />
changing interactions and artifacts. This leads to standing<br />
and traveling wave phenomena [9-11] depending on the<br />
dielectric properties <strong>of</strong> the sample causing, at least,<br />
B1-inhomogeneities and inhomogeneous sensitivity<br />
pr<strong>of</strong>iles (e.g. “center bright” in the brain). In addition,<br />
spin-lattice and spin-spin interactions, i.e. relaxation<br />
times, change with field strength and quite possibly, the<br />
various relaxation mechanisms for different nuclei may<br />
be weighted differently. Therefore, we cannot expect to<br />
simply copy-and-paste techniques developed at lower<br />
fields and just linearly adjust certain sequence parameters<br />
(e.g. flip angle, echo time, repetition time).<br />
Proton imaging at ≤ 3 T, the workhorse in clinical<br />
MRI, is currently rather advanced yet endures sensitivity<br />
limits for several applications. On the other hand,<br />
specific absorption rate (SAR) represents a legal limit,<br />
which is independent <strong>of</strong> the magnetic field strength<br />
and, thus, is more <strong>of</strong>ten met at higher fields as SAR<br />
increases with the square <strong>of</strong> the magnetic field strength.<br />
Therefore, and due to the lack <strong>of</strong> efficient whole body<br />
coils at 7 T or higher, local SAR replaces global SAR<br />
(Note: local SAR limit is about 5 times higher). As a rule<br />
<strong>of</strong> thumb, every application or pulse sequence hitting<br />
the SAR limit at 3 T cannot be used the same way at 7 T.<br />
On the other hand, any application lacking SNR should<br />
definitely be carried over to 7 T as long as SAR is not<br />
prohibitive. Alternatively, one could always try to change<br />
excitation pulse length (may cause <strong>of</strong>fsets, increasing<br />
chemical shift artifacts) or type (e.g. adiabatic pulses),<br />
and/or repetition time, to reduce SAR in a particular<br />
patient group.<br />
Imaging techniques originally developed at 1.5 T<br />
and already applicable at 7 T include high-resolution<br />
anatomical MRI [12,13] , BOLD-based functional MRI [13,14] ,<br />
functional MR-Angiography [13,15] , and susceptibility<br />
weighted imaging (SWI) [16,17] . In addition to standard<br />
magnitude images, phase images reveal new and additional<br />
information at 7 T [13,17,18] . Basically, these techniques do<br />
not use 180 o -pulses, which are critical in terms <strong>of</strong> SAR<br />
and B1-homogeneity, and gain from increased image SNR<br />
or time series SNR. The latter, relevant for functional<br />
MRI (fMRI), is limited by physiological noise [19] . On the<br />
other hand, high spatial resolution is not only possible<br />
WJR|www.wjgnet.com<br />
but a must at 7 T in order to fully exploit the advantages<br />
at high field strength [13,20-23] . As a consequence, 1 mm 3<br />
isotropic resolution is not only achievable for anatomical<br />
but also for functional MRI and this information may<br />
be mapped onto each other easily [13] . This enables brain<br />
research and pre-clinical tumor diagnosis to be performed<br />
at a new level, greatly helping neurosurgeons. As <strong>of</strong> today,<br />
there are first results available [13,24] and several applications<br />
are already close to clinical use. Of course, they still<br />
require confirmation by larger, multi-center studies:<br />
musculo-skeletal applications, in particular cartilage [13,25-27] ,<br />
multiple sclerosis [12,28] , and whole body imaging [13] . Based<br />
on these promising studies, I would expect preoperative<br />
brain tumor surgery planning, using high resolution fMRI,<br />
multiple sclerosis and Alzheimer’s disease, using high<br />
resolution MRI and SWI, and early diagnosis <strong>of</strong> defects<br />
in cartilage and vertebral discs to represent the first useful<br />
clinical applications <strong>of</strong> 7 T proton MRI.<br />
Imaging methods not gaining as much at 7 T include<br />
diffusion weighted imaging (DWI), which gains in SNR<br />
but not from the basic physical mechanism which is<br />
field independent, and contrast-enhanced MRI, when<br />
standard, gadolinium-based CAs are used. Of note, ironbased<br />
CAs like USPIO are now approved for human use<br />
and will do a much better job at 7 T. In addition to MRI,<br />
MRS is gaining substantially from the high field, which<br />
was known for a long time in ex vivo NMR and animal<br />
studies [4,13,29,30] . Non-proton techniques, employing, e.g.<br />
23 Na and 31 P nuclei, gain even more as they are lacking<br />
sensitivity at lower fields due to the lower gyromagnetic<br />
ratio and resonance frequency. Sodium imaging, which<br />
was developed at 1.5 T many years ago [31,32] , despite its<br />
general importance in many diseases like stroke or brain<br />
tumors, might become a useful clinical tool only at 7<br />
T or higher [13,33] . This may improve clinical diagnosis<br />
in stroke patients and help to better differentiate brain<br />
tumors and surrounding edema. I believe that 31 P-MRS<br />
will gain the most from higher fields. Why? Because<br />
for many applications 31 P-MRS and MRSI need better<br />
SNR than available at 3 T today and will pr<strong>of</strong>it also<br />
from the increased spectral dispersion (line splitting),<br />
enabling improved quantification <strong>of</strong> metabolites like<br />
phosphocreatine, adenosine triphosphate, inorganic<br />
phosphate, phosphomonoesters and phosphodiesters,<br />
relevant for energy metabolism. Furthermore, there is<br />
no nuisance background to be suppressed, like water<br />
and fat in proton-MRS. Finally, in a recent study, we<br />
demonstrated that metabolites’ T1-relaxation times in<br />
human skeletal muscle actually decreased with field<br />
strength [34] , as compared to 1.5 T and 3 T [35] , enabling<br />
faster scanning without loss in SNR (or saturation). This<br />
will enable fast, dynamic and localized 31 P-MRS [36,37] to<br />
study energy metabolism in patients and also higher<br />
resolution 31 P-MRSI (i.e. spectroscopic imaging), thus<br />
increasing specificity. In my opinion, 31 P relaxation times<br />
are also decreasing in human brain tissue if interpreted<br />
correctly [38] . Potential clinical applications are all kinds<br />
<strong>of</strong> metabolic disturbances <strong>of</strong> skeletal muscles based on<br />
38 January 28, 2010|Volume 2|Issue 1|
genetic or functional defects like muscle dystrophies or<br />
diabetes.<br />
What has been discussed so far, can be achieved on<br />
a “standard”, first generation 7 T system, i.e. with single<br />
channel transmit and local multi-array-receive coils (i.e.<br />
in the brain, skeletal muscle, joints, cartilage, etc.). When<br />
attempting to scan the body trunk, e.g. heart, liver,<br />
kidneys, multi-channel transmit techniques are inevitable<br />
and they also may improve brain and joint imaging to<br />
name a few. However, this technology is still under<br />
development and problems with inhomogeneous and<br />
inefficient body excitation, causing not only degraded<br />
image quality but also SAR problems, have to be solved<br />
within the next few years [9-11,13] . Furthermore, multiarray<br />
receive coils are far from mature today. Together<br />
with improved coil designs, dedicated artifact reduction<br />
techniques have to be developed to achieve robust and<br />
reliable imaging quality within legal SAR limits [13] . At the<br />
end, it will be the best possible combination <strong>of</strong> organ<br />
size and location, tissue structure and composition,<br />
Tx/Rx coil, imaging protocol and contrast mechanism<br />
that will provide the best data quality available in a given<br />
time. Much improved MRI and MRS at UHF may also<br />
help foster multi-modal imaging, e.g. MR-PET [8,13] . This<br />
novel hybrid technique may help to gain more relevant<br />
information to better characterize the complexity <strong>of</strong><br />
normal organ functions and, subsequently, characterize<br />
their breakdown, e.g. in brain tumors. This should pave<br />
the way towards novel and validated individualized<br />
therapies.<br />
To summarize, novel contrast mechanisms, applicable<br />
through advanced technology and a sound understanding<br />
<strong>of</strong> MR-physics and -technology, pave the way to novel<br />
clinical applications. However, there are not only technical<br />
challenges, clinicians will also have to rethink and expand<br />
their current knowledge used to interpret diagnostic<br />
images at 1.5 T and 3 T. In some areas, such as standard<br />
contrast agent applications or DWI, nothing may change<br />
dramatically and one could argue to stay with the current<br />
3 T systems. In other areas, however, only 7 T or even<br />
higher fields will enable scientists and clinicians to fully<br />
explore the potential <strong>of</strong> magnetic resonance techniques<br />
towards evidence based clinical diagnostics. Nevertheless,<br />
I would like to end this preliminary account on UHF-<br />
MR with a word <strong>of</strong> caution. We are only at the very<br />
beginning <strong>of</strong> UHF-MR applications and both hardware<br />
and measurement techniques are immature and need to be<br />
improved substantially before any sound conclusions on<br />
the clinical use <strong>of</strong> UHF-systems in general can be made.<br />
In particular, several safety issues have to be clarified,<br />
including the potential hazard <strong>of</strong> body implants, in order<br />
to minimize any risk to patients and operators.<br />
ACKNOWLEDGMENTS<br />
The author is grateful to all his colleagues working at 7 T<br />
for their support, interesting discussions and suggestions,<br />
and his coworkers in Vienna for their contributions.<br />
WJR|www.wjgnet.com<br />
REFERENCES<br />
Moser E. Ultra-high-field MR<br />
1 Hoult DI, Chen CN, Sank VJ. The field dependence <strong>of</strong><br />
NMR imaging. II. Arguments concerning an optimal field<br />
strength. Magn Reson Med 1986; 3: 730-746<br />
2 Hoult DI, Lauterbur PC. The sensitivity <strong>of</strong> the zeugmatographic<br />
experiment involving human samples. J Magn Reson 1979; 34:<br />
425-433<br />
3 Koenig SH, Brown RD 3rd, Adams D, Emerson D, Harrison<br />
CG. Magnetic field dependence <strong>of</strong> 1/T1 <strong>of</strong> protons in tissue.<br />
Invest Radiol 1984; 19: 76-81<br />
4 Uğurbil K, Garwood M, Ellermann J, Hendrich K, Hinke R,<br />
Hu X, Kim SG, Menon R, Merkle H, Ogawa S. Imaging at<br />
high magnetic fields: initial experiences at 4 T. Magn Reson<br />
Q 1993; 9: 259-277<br />
5 Moser E, Trattnig S. 3.0 Tesla MR systems. Invest Radiol<br />
2003; 38: 375-376<br />
6 Kramer H, Michaely HJ, Matschl V, Schmitt P, Reiser<br />
MF, Schoenberg SO. High-resolution magnetic resonance<br />
angiography <strong>of</strong> the lower extremities with a dedicated<br />
36-element matrix coil at 3 Tesla. Invest Radiol 2007; 42: 477-483<br />
7 Vaughan JT, Garwood M, Collins CM, Liu W, DelaBarre<br />
L, Adriany G, Andersen P, Merkle H, Goebel R, Smith MB,<br />
Ugurbil K. 7T vs. 4T: RF power, homogeneity, and signal-tonoise<br />
comparison in head images. Magn Reson Med 2001; 46:<br />
24-30<br />
8 Moser E, Stadlbauer A, Windischberger C, Quick HH, Ladd<br />
ME. Magnetic resonance imaging methodology. Eur J Nucl<br />
Med Mol Imaging 2009; 36 Suppl 1: S30-S41<br />
9 Yang QX, Wang J, Zhang X, Collins CM, Smith MB, Liu H,<br />
Zhu XH, Vaughan JT, Ugurbil K, Chen W. Analysis <strong>of</strong> wave<br />
behavior in lossy dielectric samples at high field. Magn<br />
Reson Med 2002; 47: 982-989<br />
10 Van de Moortele PF, Akgun C, Adriany G, Moeller S,<br />
Ritter J, Collins CM, Smith MB, Vaughan JT, Uğurbil K. B(1)<br />
destructive interferences and spatial phase patterns at 7 T<br />
with a head transceiver array coil. Magn Reson Med 2005; 54:<br />
1503-1518<br />
11 Brunner DO, De Zanche N, Fröhlich J, Paska J, Pruessmann<br />
KP. Travelling-wave nuclear magnetic resonance. Nature<br />
2009; 457: 994-998<br />
12 Metcalf M, Xu D, Okuda DT, Carvajal L, Srinivasan R,<br />
Kelley DA, Mukherjee P, Nelson SJ, Vigneron DB, Pelletier<br />
D. High-Resolution Phased-Array MRI <strong>of</strong> the Human Brain<br />
at 7 Tesla: Initial Experience in Multiple Sclerosis Patients. J<br />
Neuroimaging 2009; Epub ahead <strong>of</strong> print<br />
13 Siemens UHF-meeting; 2009 Sep 12-14; Leipzig, Germany<br />
14 Poser BA, Norris DG. Investigating the benefits <strong>of</strong> multiecho<br />
EPI for fMRI at 7 T. Neuroimage 2009; 45: 1162-1172<br />
15 Heverhagen JT, Bourekas E, Sammet S, Knopp MV, Schmalbrock<br />
P. Time-<strong>of</strong>-flight magnetic resonance angiography at<br />
7 Tesla. Invest Radiol 2008; 43: 568-573<br />
16 Lupo JM, Banerjee S, Kelley D, Xu D, Vigneron DB, Majumdar<br />
S, Nelson SJ. Partially-parallel, susceptibility-weighted<br />
MR imaging <strong>of</strong> brain vasculature at 7 Tesla using sensitivity<br />
encoding and an autocalibrating parallel technique. Conf<br />
Proc IEEE Eng Med Biol Soc 2006; 1: 747-750<br />
17 Deistung A, Rauscher A, Sedlacik J, Stadler J, Witoszynskyj<br />
S, Reichenbach JR. Susceptibility weighted imaging at ultra<br />
high magnetic field strengths: theoretical considerations and<br />
experimental results. Magn Reson Med 2008; 60: 1155-1168<br />
18 Duyn JH, van Gelderen P, Li TQ, de Zwart JA, Koretsky AP,<br />
Fukunaga M. High-field MRI <strong>of</strong> brain cortical substructure<br />
based on signal phase. Proc Natl Acad Sci USA 2007; 104:<br />
11796-11801<br />
19 Triantafyllou C, Hoge RD, Krueger G, Wiggins CJ, Potthast<br />
A, Wiggins GC, Wald LL. Comparison <strong>of</strong> physiological noise<br />
at 1.5 T, 3 T and 7 T and optimization <strong>of</strong> fMRI acquisition<br />
parameters. Neuroimage 2005; 26: 243-250<br />
20 Moser EV, Derntl B, Gerstl F, Robinson SD, Karlsson KÆ,<br />
39 January 28, 2010|Volume 2|Issue 1|
Moser E. Ultra-high-field MR<br />
Windischberger C. Functional MR-imaging <strong>of</strong> human<br />
emotions: towards single subject diagnosis. IFMBE Proc 2009;<br />
25: 19-22<br />
21 Windischberger C, Cunnington R, Lamm C, Lanzenberger R,<br />
Langenberger H, Deecke L, Bauer H, Moser E. Time-resolved<br />
analysis <strong>of</strong> fMRI signal changes using Brain Activation<br />
Movies. J Neurosci Methods 2008; 169: 222-230<br />
22 Windischberger C, Gerstl F, Fischmeister FPS, Schöpf V,<br />
Kaseß C, Moser E. Brain Activity Movie functional MRI with<br />
ultra-high temporal resolution at 7 Tesla. IFMBE Proc 2009; 25:<br />
192-194<br />
23 Windischberger C, Fischmeister FP, Schöpf V, Sladky R,<br />
Moser E. [Functional magnetic resonance imaging with<br />
ultra-high fields.] Radiologe 2009; Epub ahead <strong>of</strong> print<br />
24 Hennig J. Ultra high field MR: useful instruments or toys<br />
for the boys? Magn Reson Mater Phy 2008; 21: 1-3<br />
25 Behr B, Stadler J, Michaely HJ, Damert HG, Schneider W. MR<br />
imaging <strong>of</strong> the human hand and wrist at 7 T. Skeletal Radiol<br />
2009; 38: 911-917<br />
26 Krug R, Stehling C, Kelley DA, Majumdar S, Link TM.<br />
Imaging <strong>of</strong> the musculoskeletal system in vivo using ultrahigh<br />
field magnetic resonance at 7 T. Invest Radiol 2009; 44:<br />
613-618<br />
27 Welsch GH, Mamisch TC, Hughes T, Zilkens C, Quirbach S,<br />
Scheffler K, Kraff O, Schweitzer ME, Szomolanyi P, Trattnig S.<br />
In vivo biochemical 7.0 Tesla magnetic resonance: preliminary<br />
results <strong>of</strong> dGEMRIC, zonal T2, and T2* mapping <strong>of</strong> articular<br />
cartilage. Invest Radiol 2008; 43: 619-626<br />
28 Tallantyre EC, Brookes MJ, Dixon JE, Morgan PS, Evangelou N,<br />
Morris PG. Demonstrating the perivascular distribution <strong>of</strong> MS<br />
lesions in vivo with 7-Tesla MRI. Neurology 2008; 70: 2076-2078<br />
29 Otazo R, Mueller B, Ugurbil K, Wald L, Posse S. Signal-tonoise<br />
ratio and spectral linewidth improvements between 1.5<br />
and 7 Tesla in proton echo-planar spectroscopic imaging.<br />
WJR|www.wjgnet.com<br />
Magn Reson Med 2006; 56: 1200-1210<br />
30 Ratai E, Kok T, Wiggins C, Wiggins G, Grant E, Gagoski B,<br />
O'Neill G, Adalsteinsson E, Eichler F. Seven-Tesla proton<br />
magnetic resonance spectroscopic imaging in adult X-linked<br />
adrenoleukodystrophy. Arch Neurol 2008; 65: 1488-1494<br />
31 Hilal SK, Maudsley AA, Ra JB, Simon HE, Roschmann P,<br />
Wittekoek S, Cho ZH, Mun SK. In vivo NMR imaging <strong>of</strong><br />
sodium-23 in the human head. J Comput Assist Tomogr 1985; 9:<br />
1-7<br />
32 Winkler SS. Sodium-23 magnetic resonance brain imaging.<br />
Neuroradiology 1990; 32: 416-420<br />
33 Nagel AM, Schmitter1 S, Bock M, Moser E, Semmler W,<br />
Schad LR. Parameter Optimization for 7T 23Na-MRI. Proc<br />
Intl Soc Mag Reson Med 2009; 17: 2465<br />
34 Bogner W, Chmelik M, Schmid AI, Moser E, Trattnig S,<br />
Gruber S. Assessment <strong>of</strong> (31)P relaxation times in the human<br />
calf muscle: a comparison between 3 T and 7 T in vivo. Magn<br />
Reson Med 2009; 62: 574-582<br />
35 Meyerspeer M, Krssák M, Moser E. Relaxation times <strong>of</strong><br />
31P-metabolites in human calf muscle at 3 T. Magn Reson<br />
Med 2003; 49: 620-625<br />
36 Meyerspeer M, Mandl T, Scheenen T, Moser E. Dynamic 31P<br />
MRS <strong>of</strong> exercising human muscle in a 7T whole body system,<br />
with STEAM and semi-LASER localisation. Proc Intl Soc Mag<br />
Reson Med 2009; 17: 553<br />
37 Meyerspeer M, Kemp GJ, Mlynárik V, Krssák M, Szendroedi<br />
J, Nowotny P, Roden M, Moser E. Direct noninvasive quantification<br />
<strong>of</strong> lactate and high energy phosphates simultaneously<br />
in exercising human skeletal muscle by localized magnetic<br />
resonance spectroscopy. Magn Reson Med 2007; 57: 654-660<br />
38 Qiao H, Zhang X, Zhu XH, Du F, Chen W. In vivo 31P MRS<br />
<strong>of</strong> human brain at high/ultrahigh fields: a quantitative comparison<br />
<strong>of</strong> NMR detection sensitivity and spectral resolution<br />
between 4 T and 7 T. Magn Reson Imaging 2006; 24: 1281-1286<br />
S- Editor Cheng JX L- Editor Webster JR E- Editor Zheng XM<br />
40 January 28, 2010|Volume 2|Issue 1|
W J R<br />
Online Submissions: http://www.wjgnet.com/1949-8470<strong>of</strong>fice<br />
wjr@wjgnet.com<br />
doi:10.4329/wjr.v2.i1.41<br />
High attenuation mucoid impaction in allergic<br />
bronchopulmonary aspergillosis<br />
Ritesh Agarwal<br />
Ritesh Agarwal, Department <strong>of</strong> Pulmonary Medicine, Postgraduate<br />
Institute <strong>of</strong> Medical Education and Research Sector-12,<br />
Chandigarh 160012, India<br />
Author contributions: Agarwal R conceived the idea and drafted<br />
the manuscript.<br />
Correspondence to: Ritesh Agarwal, MD, DM, Assistant<br />
Pr<strong>of</strong>essor, Department <strong>of</strong> Pulmonary Medicine, Postgraduate<br />
Institute <strong>of</strong> Medical Education and Research Sector-12, Chandigarh<br />
160012, India. riteshpgi@gmail.com<br />
Telephone: +91-172-2756825 Fax: +91-172-2748215<br />
Received: December 15, 2009 Revised: January 20, 2010<br />
Accepted: January 22, 2010<br />
Published online: January 28, 2010<br />
Abstract<br />
Allergic bronchopulmonary aspergillosis (ABPA) is a<br />
complex hypersensitivity syndrome triggered against<br />
antigens <strong>of</strong> Aspergillus fumigatus , a fungus that most<br />
commonly colonizes the airways <strong>of</strong> patients with<br />
bronchial asthma and cystic fibrosis. It presents clinically<br />
with refractory asthma, hemoptysis and systemic<br />
manifestations including fever, malaise and weight loss.<br />
Radiologically, it presents with central bronchiectasis<br />
and recurrent episodes <strong>of</strong> mucus plugging. The mucus<br />
plugs in ABPA are generally hypodense but in up to<br />
20% <strong>of</strong> patients the mucus can be hyperdense on<br />
computed tomography. This paper reviews the literature<br />
on the clinical significance <strong>of</strong> hyperattenuated mucus in<br />
patients with ABPA.<br />
© 2010 Baishideng. All rights reserved.<br />
Key words: Allergic bronchopulmonary aspergillosis;<br />
Mucoid impaction; Hyperdense mucus; High attenuation<br />
mucus; Aspergillus<br />
Peer reviewers: Georgios A Plataniotis, MD, PhD, Clinical<br />
Oncologist, Department <strong>of</strong> Oncology, Aberdeen Royal Infirmary,<br />
Foresterhill, Aberdeen, AB25 2ZN, United Kingdom; Jai<br />
Soung Park, MD, PhD, Pr<strong>of</strong>essor, Department <strong>of</strong> <strong>Radiology</strong>,<br />
WJR|www.wjgnet.com<br />
<strong>World</strong> <strong>Journal</strong> <strong>of</strong><br />
<strong>Radiology</strong><br />
<strong>World</strong> J Radiol 2010 January 28; 2(1): 41-43<br />
ISSN 1949-8470 (online)<br />
© 2010 Baishideng. All rights reserved.<br />
GUIDELINES FOR CLINICAL PRACTICE<br />
Soonchunhyang University Buchen Hospital, 1174 jung-dong,<br />
Wonmi-gu, Bucheon, Gyeonggi-do 420-767, South Korea<br />
Agarwal R. High attenuation mucoid impaction in allergic<br />
bronchopulmonary aspergillosis. <strong>World</strong> J Radiol 2010; 2(1): 41<br />
-43 Available from: URL: http://www.wjgnet.com/1949-8470/<br />
full/v2/i1/41.htm DOI: http://dx.doi.org/10.4329/wjr.v2.i1.<br />
41<br />
Allergic bronchopulmonary aspergillosis (ABPA) is<br />
a complex immunologic syndrome complicating the<br />
course <strong>of</strong> various pulmonary disorders including bronchial<br />
asthma [1] . The disease was first described by Hinson<br />
et al [2] as an association <strong>of</strong> bronchial asthma with hypersensitivity<br />
to Aspergillus fumigatus. It manifests clinically<br />
with uncontrolled asthma, hemoptysis and systemic<br />
manifestations such as fever, weight loss, malaise and<br />
fatigue [1] . The interest in this entity stems from the fact<br />
that that the condition responds remarkably to glucocorticoid<br />
therapy, and early detection and treatment may<br />
eliminate the risk <strong>of</strong> progression to end-stage fibrotic<br />
lung disease [3] . Radiologically, it is characterized by central<br />
bronchiectasis (bronchiectasis limited to the medial<br />
half <strong>of</strong> the lung, at a point midway between the hilum<br />
and the chest wall) with distal tapering <strong>of</strong> bronchi and<br />
recurrent episodes <strong>of</strong> mucus plugging [4] . The bronchial<br />
mucus plugging in ABPA is generally hypodense; however,<br />
the mucus secretions can also have high attenuation<br />
computed tomography (CT) values [5] . High attenuation<br />
mucus is said to be present if the mucus plug is visually<br />
denser than the normal skeletal muscle (Figure 1).<br />
The occurrence <strong>of</strong> high attenuation mucoid impaction<br />
in ABPA was first described by Goyal et al [6] in 1992,<br />
and it is likely that this radiological diagnosis was missed<br />
previously [7] and even after 1992 [8,9] . Subsequently, Logan<br />
et al [10] described the occurrence <strong>of</strong> high density mucus<br />
plugs in 4 out <strong>of</strong> 14 (28%) patients with ABPA over a<br />
4 years period. Following this, numerous reports have<br />
41 January 28, 2010|Volume 2|Issue 1|
Agarwal R. Hyperdense mucus in ABPA<br />
*<br />
Figure 1 High-resolution computed tomography (CT) <strong>of</strong> the chest showing<br />
high attenuation mucus in a patient with allergic bronchopulmonary aspergillosis<br />
(solid arrow). The mucus is denser than the paraspinal skeletal muscle<br />
(asterisk).<br />
described the finding <strong>of</strong> high attenuation mucus in<br />
ABPA [11-15] . Currently, the presence <strong>of</strong> hyperdense mucus<br />
is considered a characteristic, if not a pathognomonic,<br />
finding in ABPA [16] . The constituents <strong>of</strong> hyperdense<br />
mucus are not entirely clear. The hyperattenuating mucus<br />
probably has a basis similar to that seen in patients with<br />
allergic fungal sinusitis [17,18] . An initial theory proposed<br />
the role <strong>of</strong> hemosiderin occurring within inspissated<br />
mucin as responsible for the areas <strong>of</strong> increased signal<br />
intensity. This was disputed by Zinreich et al [19] who were<br />
unable to identify increased hemosiderin within typical<br />
allergic fungal mucin. The hyperattenuating mucus<br />
plugging seen on CT scans is currently attributed to the<br />
presence <strong>of</strong> calcium salts and metals (the ions <strong>of</strong> iron and<br />
manganese) [20] or desiccated mucus [21] .<br />
The clinical significance <strong>of</strong> high-attenuation mucoid<br />
impaction in ABPA was hitherto unknown. However, in<br />
a recent study, we screened 755 patients with bronchial<br />
asthma for ABPA using the Aspergillus skin test. Two<br />
hundred and ninety one patients (38.5%) were found to<br />
be aspergillus skin test positive, and ABPA was diagnosed<br />
in 155 patients. In a multivariate analysis, both the severity<br />
<strong>of</strong> bronchiectasis and high-attenuation mucus predicted<br />
relapses <strong>of</strong> ABPA (OR: 1.23, 95% CI: 1.13-1.42 and OR:<br />
3.61, 95% CI: 1.23-10.61, respectively). However, failure<br />
to achieve long-term remission was influenced only by<br />
the severity <strong>of</strong> bronchiectasis but not by hyperdense<br />
mucus (OR: 1.55, 95% CI: 1.29-1.85 and OR: 3.41, 95%<br />
CI: 0.89-13.1, respectively) [14] . The exact reason why<br />
hyperdense mucus is associated with recurrent relapses<br />
remains unclear but one reason may be that the mucus<br />
is more impacted, and the higher attenuation points to<br />
a more inspissated type <strong>of</strong> mucus. It is also probable<br />
that it defines a subgroup <strong>of</strong> patients with more severe<br />
inflammation. Recently, interleukin-10 promoter and<br />
surfactant protein polymorphisms have been associated<br />
with genetic susceptibility to ABPA [22,23] . It may well be<br />
hypothesized that patients with hyperdense mucus have<br />
specific genetic alterations that lead to formation <strong>of</strong><br />
high attenuation mucus, and the genetic abnormalities<br />
WJR|www.wjgnet.com<br />
dictate a disease with more severe inflammation and<br />
poorer outcomes. However, more research is needed to<br />
investigate the exact reason for this association.<br />
High attenuation mucus also has an important connotation<br />
in patients with cystic fibrosis (CF). Unlike asthma,<br />
recognition <strong>of</strong> ABPA in CF is difficult as ABPA shares<br />
many clinical characteristics with poorly controlled CF<br />
lung disease without ABPA. Wheezing (due to intercurrent<br />
infections), transient pulmonary infiltrates, bronchiectasis<br />
and mucus plugging are common manifestations<br />
<strong>of</strong> CF-related pulmonary disease with or without<br />
ABPA [3] . The finding <strong>of</strong> hyperdense mucus with CT in<br />
patients with CF suggests that the lung disease is due to<br />
ABPA rather than CF per se [15] .<br />
REFERENCES<br />
1 Agarwal R. Allergic bronchopulmonary aspergillosis. Chest<br />
2009; 135: 805-826<br />
2 Hinson KF, Moon AJ, Plummer NS. Broncho-pulmonary<br />
aspergillosis; a review and a report <strong>of</strong> eight new cases. Thorax<br />
1952; 7: 317-333<br />
3 Agarwal R. Controversies in allergic bronchopulmonary<br />
aspergillosis. Int J Respir Care 2010; In press<br />
4 Shah A. Allergic bronchopulmonary and sinus aspergillosis:<br />
the roentgenologic spectrum. Front Biosci 2003; 8: e138-e146<br />
5 Agarwal R, Gupta D, Aggarwal AN, Behera D, Jindal SK.<br />
Allergic bronchopulmonary aspergillosis: lessons from 126<br />
patients attending a chest clinic in north India. Chest 2006;<br />
130: 442-448<br />
6 Goyal R, White CS, Templeton PA, Britt EJ, Rubin LJ. High<br />
attenuation mucous plugs in allergic bronchopulmonary<br />
aspergillosis: CT appearance. J Comput Assist Tomogr 1992;<br />
16: 649-650<br />
7 Fraser RG, Pare JAP, Pare PD, Fraser RS, Genereux GP.<br />
Mycotic and Actinomycotic pleuropulmonary infections. In:<br />
Diagnosis <strong>of</strong> Diseases <strong>of</strong> the Chest. 3rd ed. Philadelphia: WB<br />
Saunders, 1989: 940-1022<br />
8 Sandhu M, Mukhopadhyay S, Sharma SK. Allergic bronchopulmonary<br />
aspergillosis: a comparative evaluation <strong>of</strong><br />
computed tomography with plain chest radiography. Australas<br />
Radiol 1994; 38: 288-293<br />
9 Aquino SL, Kee ST, Warnock ML, Gamsu G. Pulmonary<br />
aspergillosis: imaging findings with pathologic correlation.<br />
AJR Am J Roentgenol 1994; 163: 811-815<br />
10 Logan PM, Müller NL. High-attenuation mucous plugging<br />
in allergic bronchopulmonary aspergillosis. Can Assoc Radiol<br />
J 1996; 47: 374-377<br />
11 Karunaratne N, Baraket M, Lim S, Ridley L. Case quiz. Thoracic<br />
CT illustrating hyperdense bronchial mucous plugging:<br />
allergic bronchopulmonary aspergillosis. Australas Radiol<br />
2003; 47: 336-338<br />
12 Molinari M, Ruiu A, Biondi M, Zompatori M. Hyperdense<br />
mucoid impaction in allergic bronchopulmonary aspergillosis:<br />
CT appearance. Monaldi Arch Chest Dis 2004; 61: 62-64<br />
13 Agarwal R, Aggarwal AN, Gupta D. High-attenuation<br />
mucus in allergic bronchopulmonary aspergillosis: another<br />
cause <strong>of</strong> diffuse high-attenuation pulmonary abnormality.<br />
AJR Am J Roentgenol 2006; 186: 904<br />
14 Agarwal R, Gupta D, Aggarwal AN, Saxena AK, Chakrabarti<br />
A, Jindal SK. Clinical significance <strong>of</strong> hyperattenuating mucoid<br />
impaction in allergic bronchopulmonary aspergillosis: an<br />
analysis <strong>of</strong> 155 patients. Chest 2007; 132: 1183-1190<br />
15 Morozov A, Applegate KE, Brown S, Howenstine M. Highattenuation<br />
mucus plugs on MDCT in a child with cystic<br />
fibrosis: potential cause and differential diagnosis. Pediatr<br />
42 January 28, 2010|Volume 2|Issue 1|
Radiol 2007; 37: 592-595<br />
16 Webb WR, Muller NL, Naidich DP. Airway diseases. In:<br />
Webb WR, editor. High-resolution CT <strong>of</strong> the lung. 4th ed.<br />
Philadelphia: LWW, 2009: 492-554<br />
17 Manning SC, Merkel M, Kriesel K, Vuitch F, Marple B.<br />
Computed tomography and magnetic resonance diagnosis<br />
<strong>of</strong> allergic fungal sinusitis. Laryngoscope 1997; 107: 170-176<br />
18 Mukherji SK, Figueroa RE, Ginsberg LE, Zeifer BA, Marple<br />
BF, Alley JG, Cooper LL, Nemzek WR, Yousem DM, Jones<br />
KR, Kupferberg SB, Castillo M. Allergic fungal sinusitis: CT<br />
findings. <strong>Radiology</strong> 1998; 207: 417-422<br />
19 Zinreich SJ, Kennedy DW, Malat J, Curtin HD, Epstein JI,<br />
Huff LC, Kumar AJ, Johns ME, Rosenbaum AE. Fungal<br />
sinusitis: diagnosis with CT and MR imaging. <strong>Radiology</strong> 1988;<br />
169: 439-444<br />
20 Kopp W, Fotter R, Steiner H, Beaufort F, Stammberger H.<br />
WJR|www.wjgnet.com<br />
Agarwal R. Hyperdense mucus in ABPA<br />
Aspergillosis <strong>of</strong> the paranasal sinuses. <strong>Radiology</strong> 1985; 156:<br />
715-716<br />
21 Dillon WP, Som PM, Fullerton GD. Hypointense MR signal<br />
in chronically inspissated sinonasal secretions. <strong>Radiology</strong><br />
1990; 174: 73-78<br />
22 Saxena S, Madan T, Shah A, Muralidhar K, Sarma PU.<br />
Association <strong>of</strong> polymorphisms in the collagen region <strong>of</strong><br />
SP-A2 with increased levels <strong>of</strong> total IgE antibodies and<br />
eosinophilia in patients with allergic bronchopulmonary<br />
aspergillosis. J Allergy Clin Immunol 2003; 111: 1001-1007<br />
23 Brouard J, Knauer N, Boelle PY, Corvol H, Henrion-<br />
Caude A, Flamant C, Bremont F, Delaisi B, Duhamel JF,<br />
Marguet C, Roussey M, Miesch MC, Chadelat K, Boule M,<br />
Fauroux B, Ratjen F, Grasemann H, Clement A. Influence <strong>of</strong><br />
interleukin-10 on Aspergillus fumigatus infection in patients<br />
with cystic fibrosis. J Infect Dis 2005; 191: 1988-1991<br />
S- Editor Cheng JX L- Editor Lutze M E- Editor Zheng XM<br />
43 January 28, 2010|Volume 2|Issue 1|
W J R<br />
Online Submissions: http://www.wjgnet.com/1949-8470<strong>of</strong>fice<br />
wjr@wjgnet.com<br />
doi:10.4329/wjr.v2.i1.44<br />
REVIEW<br />
Non-invasive MRI assessment <strong>of</strong> the articular cartilage in<br />
clinical studies and experimental settings<br />
Yi-Xiang J Wang, James F Griffith, Anil T Ahuja<br />
Yi-Xiang J Wang, James F Griffith, Anil T Ahuja, Department<br />
<strong>of</strong> Diagnostic <strong>Radiology</strong> and Organ Imaging, The Chinese<br />
University <strong>of</strong> Hong Kong, Prince <strong>of</strong> Wales Hospital, Shatin,<br />
Hong Kong, China<br />
Author contributions: Wang YXJ guaranteed the integrity <strong>of</strong><br />
the paper; Wang YXJ, Griffith JF and Ahuja AT searched the<br />
literature, drafted and revised the manuscript for important<br />
intellectual content.<br />
Correspondence to: Dr. Yi-Xiang J Wang, Department <strong>of</strong><br />
Diagnostic <strong>Radiology</strong> and Organ Imaging, The Chinese University<br />
<strong>of</strong> Hong Kong, Prince <strong>of</strong> Wales Hospital, Shatin, Hong Kong,<br />
China. yixiang_wang@cuhk.edu.hk<br />
Telephone: +852-26322289 Fax: +852-26360012<br />
Received: December 7, 2009 Revised: January 12, 2010<br />
Accepted: January 20, 2010<br />
Published online: January 28, 2010<br />
Abstract<br />
Attrition and eventual loss <strong>of</strong> articular cartilage are<br />
important elements in the pathophysiology <strong>of</strong> osteoarthritis<br />
(OA). Preventing the breakdown <strong>of</strong> cartilage<br />
is believed to be critical to preserve the functional<br />
integrity <strong>of</strong> a joint. Chondral injuries are also common<br />
in the knee joint, and many patients benefit from cartilage<br />
repair. Magnetic resonance imaging (MRI) and advanced<br />
digital post-processing techniques have opened<br />
possibilities for in vivo analysis <strong>of</strong> cartilage morphology,<br />
structure, and function in healthy and diseased<br />
knee joints. Techniques <strong>of</strong> semi-quantitative scoring<br />
<strong>of</strong> human knee cartilage pathology and quantitative<br />
assessment <strong>of</strong> human cartilage have been developed.<br />
Cartilage thickness and volume have been quantified<br />
in humans as well as in small animals. MRI detected<br />
cartilage loss has been shown to be more sensitive<br />
than radiographs detecting joint space narrowing. It is<br />
possible to longitudinally study knee cartilage morphology<br />
with enough accuracy to follow the disease-caused<br />
changes and also evaluate the therapeutic effects <strong>of</strong><br />
chondro-protective drugs. There are also several MRI<br />
methods that may allow evaluation <strong>of</strong> the glycosaminoglycan<br />
matrix or collagen network <strong>of</strong> articular car-<br />
WJR|www.wjgnet.com<br />
<strong>World</strong> <strong>Journal</strong> <strong>of</strong><br />
<strong>Radiology</strong><br />
tilage, and may be more sensitive for the detection <strong>of</strong><br />
early changes. The clinical relevance <strong>of</strong> these methods<br />
is being validated. With the development <strong>of</strong> new therapies<br />
for OA and cartilage injury, MR images will play an<br />
important role in the diagnosis, staging, and evaluation<br />
<strong>of</strong> the effectiveness <strong>of</strong> these therapies.<br />
© 2010 Baishideng. All rights reserved.<br />
Key words: Animal model; Cartilage; Osteoarthritis; Joint<br />
space narrowing; Knee; Magnetic resonance imaging;<br />
Radiography<br />
Peer reviewer: AAK Abdel Razek, MD, Pr<strong>of</strong>essor, Diagnostic<br />
<strong>Radiology</strong> Department, 62 El Nokri St, Meet Hadr, Mansoura<br />
Faculty <strong>of</strong> Medicine, Mansoura, Egypt<br />
Wang YXJ, Griffith JF, Ahuja AT. Non-invasive MRI assessment<br />
<strong>of</strong> the articular cartilage in clinical studies and experimental<br />
settings. <strong>World</strong> J Radiol 2010; 2(1): 44-54 Available from:<br />
URL: http://www.wjgnet.com/1949-8470/full/v2/i1/44.htm<br />
DOI: http://dx.doi.org/10.4329/wjr.v2.i1.44<br />
INTRODUCTION<br />
<strong>World</strong> J Radiol 2010 January 28; 2(1): 44-54<br />
ISSN 1949-8470 (online)<br />
© 2010 Baishideng. All rights reserved.<br />
Osteoarthritis (OA) is viewed as the clinical and pathological<br />
outcome <strong>of</strong> a range <strong>of</strong> disorders that result in<br />
structural degradation and functional failure <strong>of</strong> synovial<br />
joints. OA occurs when the dynamic equilibrium between<br />
the breakdown and repair <strong>of</strong> joint tissues becomes<br />
unbalanced, <strong>of</strong>ten in a situation in which the mechanical<br />
loads applied exceed those that can be tolerated by the<br />
joint tissues. This progressive joint failure may cause pain<br />
and disability and is being ranked as the leading cause <strong>of</strong><br />
disability in the elderly. Although articular cartilage lacks<br />
nerves, recent studies have shown that cartilage pathology<br />
is associated with clinical symptoms [1,2] . Currently,<br />
no well accepted medical treatment for OA with structure<br />
or disease modification efficacy exists. Attrition and<br />
eventual loss <strong>of</strong> articular cartilage are crucial elements<br />
44 January 28, 2010|Volume 2|Issue 1|
in the pathophysiology <strong>of</strong> OA. Because <strong>of</strong> the avascular<br />
nature and small chondrocyte population in adults, the<br />
capacity <strong>of</strong> injured or degenerated cartilage to synthesize<br />
and secrete its extracellular matrix is poor. The healing<br />
response to cartilage injury and degeneration also decreases<br />
with age. Preventing the breakdown <strong>of</strong> cartilage<br />
is believed to be critical to preserve the functional integrity<br />
<strong>of</strong> a joint. Chondral injuries are common in the knee<br />
joint, and many patients benefit from cartilage repair.<br />
A number <strong>of</strong> promising therapeutic agents and surgical<br />
procedures are currently under development in this<br />
regard. In addition to investigating the pathophysiology<br />
<strong>of</strong> cartilage generation, there is a significant need for a<br />
non-invasive method <strong>of</strong> monitoring OA to judge the<br />
success <strong>of</strong> potential chondroregenerative and surgical<br />
treatments. Magnetic resonance imaging (MRI) <strong>of</strong>fers a<br />
unique opportunity to characterize various pathologies<br />
<strong>of</strong> articular cartilage in vivo.<br />
MRI detected cartilage loss has been shown to be<br />
more sensitive than radiographs detecting joint space<br />
narrowing (JSN). Amin et al [3] reported that cartilage<br />
loss was significantly associated with semi-quantitatively<br />
graded JSN <strong>of</strong> weight-bearing radiographs in the femoraltibia<br />
joint, however, there was a substantial proportion<br />
<strong>of</strong> knees in which cartilage loss was detected with MRI<br />
but no radiographic JSN was observed. Raynauld et al [4]<br />
described no significant change in the medial femoral-tibia<br />
compartment <strong>of</strong> weight-bearing semiflexed radiographs<br />
positioned with fluoroscopy in 32 patients with OA<br />
over 2 years, but reported a highly significant change<br />
in cartilage volume from MRI both in the medial and<br />
lateral femoral-tibia compartment. The knee is the largest<br />
weight-bearing joint in the body and therefore most<br />
commonly affected by OA. Chondral injury is a frequent<br />
cause <strong>of</strong> pain and knee-function limitation. Cartilage<br />
repair surgery is a highly dynamic research field, and there<br />
is a pressing need for reliable and objective monitoring in<br />
order to evaluate and compare various surgical treatment<br />
options. This review discusses in vivo MRI methodology<br />
<strong>of</strong> the morphological assessment <strong>of</strong> knee cartilage,<br />
both in clinical studies and experimental settings. Novel<br />
techniques with potential <strong>of</strong> assessing macromolecular<br />
matrix <strong>of</strong> cartilage are also briefly discussed.<br />
MR IMage aCqUIsITION TeChNIqUes<br />
fOR hUMaN kNee<br />
MR images capable <strong>of</strong> resolving various structures <strong>of</strong><br />
the knee joint require a good signal-to-noise ratio, good<br />
spatial resolution, and good tissue contrast. Given that<br />
knee cartilage is only 1.3-2.5 mm thick in healthy human<br />
subjects, and because <strong>of</strong> its complex morphology, knee<br />
cartilage presents a challenge in MRI [5-8] . The challenges<br />
are even greater in OA patients, as a decrease in signal<br />
and thinning make delineation <strong>of</strong> the articular cartilage<br />
more difficult.<br />
MRI assessment <strong>of</strong> cartilage repair requires cartilagesensitive<br />
sequences such as fat-suppressed (FS) 3D T1-<br />
WJR|www.wjgnet.com<br />
Wang YXJ et al . MRI assessment <strong>of</strong> the articular cartilage<br />
weighted gradient echo (GE) sequences and protondensity<br />
and T2- or intermediate weighted fast spin echo<br />
(FSE) techniques. The pattern <strong>of</strong> joint structures as seen<br />
on MR images can be modified in various ways by the<br />
choice <strong>of</strong> MR pulse sequences. The MR sequences that<br />
have been most commonly used for cartilage assessment<br />
are FS T1-weighted spoiled GE sequences. FS is important<br />
for increasing the dynamic range between cartilage<br />
and adjacent structures and to eliminate chemical shift<br />
artifacts at the cartilage-bone interface. FS enhances<br />
the contrast for the cartilage and it has been reported<br />
that it can lead to better reproducibility for volumetric<br />
measurements [9] . GE sequences allow very short time<br />
<strong>of</strong> echo (TE), and this improves signal sensitivity when<br />
small structures are imaged. FS GE sequences with short<br />
TEs and relatively large flip angles provide T1-weighted<br />
images where the intra-articular fluid is less intense than<br />
the cartilage and fat is suppressed therefore maximizing<br />
the contrast between cartilage, fluid and marrow, with<br />
cartilage showing a bright signal. Because <strong>of</strong> the relatively<br />
short T2 relaxation times in articular cartilage, especially<br />
in deep cartilage adjacent to the bone interface,<br />
MR sequences for quantitative volume measurements<br />
should be used with TE as short as possible, preferably<br />
below 10 ms. A longer TE leads to cartilage signal decay.<br />
Eckstein et al [10] reported a significant underestimation<br />
<strong>of</strong> tibial cartilage thickness compared to CT arthrography,<br />
when using a GE sequence with a TE <strong>of</strong> 11 ms. It<br />
is particularly important to avoid this confounding effect<br />
<strong>of</strong> T2 relaxation on volume measurement in longitudinal<br />
studies <strong>of</strong> OA progression.<br />
In general, 3D-GE sequences with FS allow the<br />
exact depiction <strong>of</strong> the thickness and surface <strong>of</strong> cartilage,<br />
whereas dual FSE sequences outline the normal and<br />
abnormal internal structure <strong>of</strong> hyaline cartilage. Cartilage<br />
demonstrates intermediate signals in intermediate - and<br />
T2-weighted sequences, whereas synovial fluid is bright<br />
and the internal structure <strong>of</strong> the cartilage displays a<br />
more heterogeneous signal and ‘internal’ pathological<br />
changes may be more readily displayed (Figure 1).<br />
Sagittal scan plane is commonly used for cartilage<br />
evaluation. Although there is no current consensus on<br />
the optimal resolution for imaging knees in OA, 1.5 mm<br />
section thickness and 0.3 mm in-plane resolution has<br />
been commonly used, as these allow total coverage <strong>of</strong> the<br />
knee with imaging times <strong>of</strong> 10-12 min. Rubenstein et al [11]<br />
demonstrated that a voxel size under 300 μm is required<br />
to reveal fraying <strong>of</strong> the articular surface <strong>of</strong> cartilage. In<br />
a systematic comparison <strong>of</strong> images with different inplane<br />
resolutions, Hardya et al [12] reported significantly<br />
larger precision errors for cartilage volume measurements<br />
derived from the lower-resolution (0.55 mm × 0.55 mm)<br />
images than for those from the higher-resolution (0.28 mm<br />
× 0.28 mm) images in the femur and tibia. Wluka et al [13]<br />
and Cicuttini et al [14] measured the rate <strong>of</strong> progression<br />
in tibial cartilage using sagittal images and also using<br />
reformatted coronal images. They reported a higher rate<br />
<strong>of</strong> progression <strong>of</strong> tibial cartilage loss in the reformatted<br />
coronal vs original sagittal images. These findings indicate<br />
45 January 28, 2010|Volume 2|Issue 1|
A<br />
B<br />
Wang YXJ et al . MRI assessment <strong>of</strong> the articular cartilage<br />
Figure 1 Comparison <strong>of</strong> gradient echo (GE) sequence and fat-suppressed<br />
(FS) sequence in depicting intra-cartilage lesion. A: Sagittal fat saturated<br />
spoiled GE image <strong>of</strong> the knee in a patient with early OA and a cartilage fissure<br />
(arrow); B: Sagittal FS intermediate weighted image <strong>of</strong> the same patient with<br />
the fissure (arrow). Note the difference in contrast with bright cartilage signal<br />
in (A) and intermediate cartilage signal in (B). Joint effusion in (B) with bright<br />
signal improves visualization <strong>of</strong> the cartilage fissure (Reproduced by permission<br />
<strong>of</strong> John Wiley & Sons, Ltd from Reference 8).<br />
that changes may be more readily detected in coronal views<br />
<strong>of</strong> the knee. Which protocol (sagittal or a combination<br />
<strong>of</strong> axial and coronal scans) is preferable remains to be<br />
confirmed by future studies.<br />
For human studies, MR images should be acquired<br />
within reasonable examination times (< 20 min per pulse<br />
sequence), in order to avoid movement artifacts, maintain<br />
patient comfort, and contain costs. Recently developed<br />
high-resolution 3D isotropic cartilage-sensitive sequences<br />
at 3 Tesla will further improve the assessment <strong>of</strong> quantitative<br />
morphologic aspects <strong>of</strong> volumetric cartilage [15] . New<br />
coil technologies with multi-element design allow the<br />
use <strong>of</strong> parallel imaging, which can additionally decrease<br />
the scan time. Higher magnetic field could potentially<br />
increase the quality <strong>of</strong> cartilage images, while scan times<br />
can be kept well below 10 min. At 3.0T, it was found that<br />
the signal to noise ratio and contrast to noise ratio efficiency<br />
for cartilage increased by a factor <strong>of</strong> 1.8 vs 1.5T<br />
for spoiled GE sequences. Cartilage volume and thickness<br />
measurements at 3.0T showed only small (non-significant)<br />
differences as compared with measurements at 1.5T [16,17] .<br />
Using a porcine model <strong>of</strong> artificial cartilage lesions, it was<br />
reported that the highest lesion detection rate was found<br />
with an intermediate-weighted FSE sequence at 3.0T (90%<br />
vs 62% at 1.5T), whereas the lesion grade was most accu-<br />
WJR|www.wjgnet.com<br />
rately evaluated with spoiled GE sequences at 3.0T (83%<br />
vs 70% at 1.5T). Receiver operator characteristics analyses<br />
in the same model confirmed improved diagnostic performance<br />
in detecting cartilage lesions at 3.0T if highresolution<br />
imaging protocols (slice thickness ≤ 2 mm<br />
and in-plane resolution ≤ 0.39 mm) were used [18,19] . Lowfield<br />
systems should not be used for cartilage imaging as<br />
previous studies have shown that low-field MR scanners<br />
operating at field strengths <strong>of</strong> 0.18-0.20T have substantial<br />
limitations compared to high-field systems (1.5T) in visualizing<br />
cartilage pathology [20] . Further studies to improve<br />
both spatial and contrast resolution using novelly designed<br />
sequences are still ongoing [20,21] .<br />
Studies have shown that knee bends and squatting<br />
can cause a reduction <strong>of</strong> approx. Five percent in patellar<br />
cartilage volume and thickness and this effect can last for<br />
approx. 90 min [6] . To avoid differences in subject conditions<br />
due to differences in levels <strong>of</strong> physical activity prior<br />
to imaging, for cartilage volume and thickness measurements,<br />
study subjects need to rest for 1 h prior to image<br />
acquisition.<br />
MR IMage aCqUIsITION TeChNIqUes<br />
fOR aNIMaL kNee<br />
A number <strong>of</strong> animal models have been devised to investigate<br />
the pathogenesis <strong>of</strong> OA and cartilage trauma.<br />
It is a great advantage for research that the time course<br />
<strong>of</strong> OA in animal models is much more rapid than the<br />
development <strong>of</strong> OA pathology in humans. The knee<br />
is the mostly used joint for OA induction. MRI has already<br />
been applied to investigate a variety <strong>of</strong> OA animal<br />
models, including mouse, rat, guinea pig, rabbit, monkey,<br />
goat and dog [5] . The high resolution requirement for<br />
small animal knee MRI demands high performance <strong>of</strong><br />
MR instruments. For imaging <strong>of</strong> large animals like dog<br />
and goat, clinical human scanners are commonly used,<br />
mostly together with a RF coil designed for human<br />
knees or wrists. For signal optimization, suitable RF coils<br />
for animal knee can be custom-made and interfaced to<br />
clinical human scanners.<br />
High field research MR scanners, usually with a<br />
magnetic field <strong>of</strong> 4.7T or 7T, tend to be equipped with<br />
small bores which can hold up to the size <strong>of</strong> rabbits or<br />
rats. The RF coils are usually home-made, or made by<br />
some small specialist companies. The most commonly<br />
used is single-turn solenoid RF coils [8] . They are designed<br />
to open at the top. Animals can be placed on a Perspex<br />
platform with one hind leg extending through the RF<br />
coil, with the knee centered in it. While designed to<br />
completely cover the knee joint <strong>of</strong> the animal species<br />
imaged, the length and diameter <strong>of</strong> the coil are optimized<br />
to minimize the image field <strong>of</strong> view so as to obtain a<br />
good filling factor. To prevent motion, the animal’s paw<br />
on the leg being scanned can be secured to a secondary<br />
lower platform. With clinical scanners, RF coils suitable<br />
for imaging human fingers can be used for imaging rat<br />
knee, although quantification <strong>of</strong> cartilage thickness or<br />
volume using this set-up remains challenging.<br />
46 January 28, 2010|Volume 2|Issue 1|
Similar MR sequences for human studies are used for<br />
animal studies. With high field MR scanners it is feasible<br />
to obtain 3D data sets <strong>of</strong> less than 100 micro meter<br />
resolution with scanning duration less than 1 h [22,23] .<br />
In the study by Tessier et al [24] , MR image acquisition<br />
protocol for guinea pig knee cartilage evaluation was<br />
detailed. A 4.7T magnet and an FS 3D-GE sequence<br />
were used. The length and diameter <strong>of</strong> the solenoid RF<br />
coil used were optimized to minimize the image field <strong>of</strong><br />
view (30 mm × 30 mm × 30 mm). A transverse image <strong>of</strong><br />
the knee was used to select the orientation <strong>of</strong> the sagittal<br />
view <strong>of</strong> the 3D images such that they were parallel to<br />
the medial condyle. The image matrix was zero-filled<br />
to 512 × 256 × 128 after 3D Fourier transform and an<br />
apparent image resolution <strong>of</strong> 59 mm × 117 mm ×<br />
234 mm was achieved. The highest resolution (59 mm)<br />
was chosen across the cartilage thickness (approx 330 mm).<br />
For assessment <strong>of</strong> rat knee joint, Wang et al [22] used a<br />
4.7T magnet; the RF coil was an in-house built doublebalanced<br />
matched 3 cm diameter copper sheet solenoid,<br />
and was 1 cm in length. 3D data set at the sagittal<br />
plane was acquired using a spoiled multi-echo FS<br />
3D-GE (TR = 75 ms, flip angle = 30°, 5 echoes TE1 =<br />
2.8 ms, TE2 = 6.0 ms, TE3 = 9.2 ms, TE4 = 12.5 ms,<br />
TE5 = 15.7 ms). Echo summation provided a means<br />
<strong>of</strong> enhancing SNR and enabled acquisition <strong>of</strong> a high<br />
resolution 3D image <strong>of</strong> the rat knee in approximately<br />
50 min. The images covered the entire knee joint with a<br />
resolution <strong>of</strong> 59 mm × 117 mm × 234 mm.<br />
TeChNIqUes fOR assessINg<br />
CaRTILage COMPOsITION<br />
During the early stages <strong>of</strong> OA, articular cartilage constituents<br />
may degenerate before any substantial morphological<br />
changes occur. In recent years, a significant amount <strong>of</strong><br />
research has been directed toward the development <strong>of</strong><br />
techniques for assessing the loss <strong>of</strong> the macromolecular<br />
matrix <strong>of</strong> articular cartilage in the absence <strong>of</strong> macroscopic<br />
lesions. One <strong>of</strong> the main motivations behind this work<br />
has been the ongoing development <strong>of</strong> drugs designed to<br />
slow or reverse the development <strong>of</strong> OA at this early stage.<br />
During disease progression, changes in the tissue MR relaxation<br />
values [T1, T2, and T1 rho (or, T1 in the rotating<br />
frame)], diffusion-coefficient, magnetic transfer, sodium<br />
MRI and ultra-short TE imaging, and delayed gadolinium<br />
enhanced MRI <strong>of</strong> cartilage (dGEMRIC) may reflect early<br />
alterations in the tissue architecture and biochemical composition<br />
[5,25-27] . Among them, the most promising three<br />
techniques include (1) dGEMRIC; (2) T1 rho (spin-lock)<br />
imaging, and (3) T2 maps [20,21,25,28] .<br />
dGEMRIC works by allowing negatively charged<br />
gadolinium-diethylenetriamine pentaacetic acid (DTPA) -2<br />
to distribute in cartilage in inverse proportion to the<br />
negatively charged glycosaminoglycans. One <strong>of</strong> the<br />
most common MR contrast agents, gadopentetate<br />
dimeglumine (Gd-DTPA -2 ; Magnevist ® , Schering, Berlin,<br />
Germany), has a negative charge and will therefore<br />
WJR|www.wjgnet.com<br />
Wang YXJ et al . MRI assessment <strong>of</strong> the articular cartilage<br />
show a lower concentration in cartilage areas <strong>of</strong> high<br />
glycosaminoglycan concentrations following penetration<br />
via diffusion. Double-dose Gd-DTPA -2 is injected intravenously,<br />
and a delay <strong>of</strong> 90 min is used to allow the contrast<br />
material to diffuse into the cartilage. A map <strong>of</strong> the<br />
T1s in the cartilage can be computed, which reflects the<br />
underlying glycosaminoglycan content. Areas <strong>of</strong> glycosaminoglycan<br />
depletion can be seen in diseased cartilage.<br />
T1 rho (spin-lock) imaging employs a long, low-power,<br />
RF pulse at the resonant frequency that follows a 90°<br />
pulse and that is applied along the axis <strong>of</strong> the magnetization<br />
vector in the transverse plane. This pulse serves to<br />
“lock” the spins along the pulse, reducing the T2 decay<br />
that would normally cause the magnetization to dephase<br />
in the plane. Despite the reduction <strong>of</strong> T2 decay, there<br />
is still a loss <strong>of</strong> magnitude <strong>of</strong> the magnetization that is<br />
characterized by the time constant T1 rho (i.e. “T1 in the<br />
rotating frame”). This sequence is sensitive to the loss<br />
<strong>of</strong> proteoglycans, which is detected as an increase in T1<br />
rho. The actual calculation <strong>of</strong> the spatial distribution <strong>of</strong><br />
T1 rho values (maps) requires that the sequence be repeated<br />
several times while systematically varying the time<br />
length that the spin-lock pulse is applied. The T2 maps<br />
<strong>of</strong> articular cartilage are a function <strong>of</strong> the water content<br />
<strong>of</strong> the tissue. Measurement <strong>of</strong> the spatial distribution <strong>of</strong><br />
the T2 may reveal areas <strong>of</strong> increased or decreased water<br />
content, which correlate with cartilage damage. Focal increases<br />
in T2 within cartilage have been associated with<br />
matrix damage, particularly loss <strong>of</strong> the collagen matrix.<br />
Intuitively, compositional measures may have a significant<br />
role to play in examining changes that occur in<br />
early disease before gross defects are apparent, whereas<br />
morphologic measures - both semiquantitative and<br />
quantitative - may have a greater role in the later stages<br />
<strong>of</strong> disease. Overall, these cartilage composition imaging<br />
techniques require dedicated staff and careful attention<br />
to the MRI parameters and timings. The major drawback<br />
<strong>of</strong> the dGEMRIC technique is the long period <strong>of</strong><br />
time, between the time <strong>of</strong> contrast agent injection and<br />
the commencement <strong>of</strong> imaging, needed to allow diffusion<br />
<strong>of</strong> the contrast into the cartilage. A lesser problem<br />
is the relatively long acquisition time needed to acquire<br />
sufficient data to create the T1 maps using a series <strong>of</strong><br />
inversion-recovery sequences, during which the subject<br />
must remain motionless. The one limitation <strong>of</strong> T1 rho<br />
technique is that it is not commonly available on commercial<br />
MR systems. Custom s<strong>of</strong>tware is also necessary<br />
to reconstruct and view the T1 rho maps. With T2 maps,<br />
correlation between T2 times and the changes in the<br />
macromolecular matrix is less certain. Further research<br />
is needed to show how clinically feasible these new biomarkers<br />
are as measures <strong>of</strong> early cartilage degeneration.<br />
Which <strong>of</strong> these techniques alone or perhaps in combination<br />
will prove most useful remains to be determined.<br />
Particularly for supposedly ‘early’ changes <strong>of</strong> OA, however,<br />
the natural course <strong>of</strong> these changes and the relationship<br />
with clinical outcome remain to be established.<br />
Additional research and validation is needed to guide<br />
interpretation <strong>of</strong> the results <strong>of</strong> these techniques.<br />
47 January 28, 2010|Volume 2|Issue 1|
Wang YXJ et al . MRI assessment <strong>of</strong> the articular cartilage<br />
MORPhOLOgICaL eVaLUaTION Of<br />
hUMaN kNee CaRTILage<br />
Conventional radiography is the least expensive method<br />
for imaging joint structure. The progression <strong>of</strong> knee OA<br />
has been assessed by measuring changes in the width<br />
<strong>of</strong> the space between the medial femoral condyle and<br />
medial tibial plateau on plain radiographs, as the medial<br />
femorotibial compartment is the most common site<br />
<strong>of</strong> involvement in knee OA. A reduction in cartilage<br />
thickness is inferred from a reduction in this space.<br />
Observational studies show a weak relationship between<br />
radiographic structural change, pain, and function in<br />
OA [29] . Measurement errors related to the variability in<br />
knee positioning required considerable effort for the<br />
standardization <strong>of</strong> radiographic protocols, including the<br />
use <strong>of</strong> fluoroscopy. Progression in JSN also reflects OA<br />
changes in joint tissues other than articular cartilage,<br />
particularly extrusion and degenerative changes <strong>of</strong> the<br />
menisci. Data also suggest that knee pain itself can<br />
modify the appearance <strong>of</strong> joint space width in weightbearing<br />
extended view radiographs [30] .<br />
Knee cartilage morphological evaluation with MRI<br />
includes qualitative assessment <strong>of</strong> articular cartilage<br />
pathology, semi-quantitative scoring <strong>of</strong> articular cartilage<br />
pathology, and quantitative assessment <strong>of</strong> articular<br />
cartilage volume and thickness. It has been reported that<br />
MRI based volume measurement <strong>of</strong> knee cartilage can<br />
demonstrate change undetectable with radiographs [4] .<br />
Using MRI assessment as the gold standard for cartilage<br />
loss, the specificity <strong>of</strong> radiography in detecting cartilage<br />
loss in the medial compartment was 91%; however, the<br />
sensitivity was only 23% [31] . MRI also has important<br />
applications in the study <strong>of</strong> cartilage repair. Specifically,<br />
MRI may (1) help to estimate the size, nature, and location<br />
<strong>of</strong> lesions preoperatively, in order to optimize surgical<br />
planning; (2) help to evaluate the quality and success <strong>of</strong><br />
tissue repair processes after surgical treatment; and (3)<br />
allow one to monitor changes in the joint after cartilage<br />
repair. An excellent review on MRI monitoring <strong>of</strong> surgical<br />
repair <strong>of</strong> cartilage has been reported elsewhere [32] .<br />
Early degenerative disease may be seen on MRI as<br />
early alterations in cartilage contour morphology (fibrillation,<br />
surface irregularity); changes in cartilage thickness,<br />
including cartilage thinning or thickening, which<br />
may be an early feature predating cartilage volume loss;<br />
or intrachondral alterations in signal intensity potentially<br />
related to premorphologic intrasubstance collagen degeneration<br />
and increased free-water content. Advanced<br />
degenerative chondral lesions typically manifest on MRI<br />
as multiple areas <strong>of</strong> cartilage thinning <strong>of</strong> varying depth<br />
and size, usually seen on opposing surfaces <strong>of</strong> an articulation.<br />
Cartilage defects typically illustrate obtuse margins<br />
and may be associated with corresponding subchondral<br />
regions <strong>of</strong> increased T2-weighted signal reflective<br />
<strong>of</strong> subchondral edema or cysts or a low signal intensity<br />
reflective <strong>of</strong> subchondral fibrosis or trabecular sclerosis.<br />
Other associated MRI findings <strong>of</strong> degenerative cartilage<br />
disease include central and marginal articular osteo-<br />
WJR|www.wjgnet.com<br />
phytes, joint effusion, and synovitis. Traumatic cartilage<br />
fragments may remain in situ, become partially detached,<br />
or become loose and displaced into the joint space.<br />
Quantitative measurements <strong>of</strong> cartilage lesion<br />
depth, diameter, area, and volume have been validated<br />
in a porcine experimental model <strong>of</strong> OA [33] . Satisfactory<br />
specificity and sensitivity for detecting chondral lesions<br />
have been demonstrated in knee specimens and in vivo<br />
with arthroscopic verification. Bredella et al [34] reported a<br />
sensitivity <strong>of</strong> 93% and a specificity <strong>of</strong> 99% in detecting<br />
chondral lesions with MRI vs athroscopy when axial and<br />
coronal images were combined, and values <strong>of</strong> 94% and<br />
99% when images in all three planes were used. In that<br />
study, accuracy was highest for severe cartilage lesions<br />
and lowest for smaller lesions, particularly for signal intensity<br />
alterations. In human knee cartilage, the mean difference<br />
between measured and actual artificial cartilage<br />
defect diameters was reported to be < 0.1 mm, whereas<br />
the lesion depth was underestimated in MRI by ><br />
0.4 mm [35] . Graichen et al [36] reported an overestimation<br />
<strong>of</strong> the true size <strong>of</strong> artificial cartilage defects in the human<br />
knee, which decreased from 42% in 3 mm defects<br />
to 4% in 8 mm defects. It is expected as MRI field and<br />
gradient strength increase and RF coil techniques and<br />
sequences improve, the performance <strong>of</strong> lesion detection<br />
with MRI will further increase.<br />
Semi-quantitative scoring <strong>of</strong> human knee cartilage<br />
pathology<br />
A number <strong>of</strong> semi-quantitative scoring methods have<br />
been developed for evaluation <strong>of</strong> articular cartilage<br />
on MR images [37,38] . Most <strong>of</strong> these methods grade the<br />
severity <strong>of</strong> cartilage thinning from 0 to 3 or 4 based<br />
on subjective evaluations by one or more experienced<br />
readers. These systems commonly differentiate between<br />
cartilage lesions <strong>of</strong> < 50% depth, > 50% depth and full<br />
thickness cartilage lesions.<br />
In an observer-dependent semi-quantitative manner,<br />
novel scoring approaches are used to assess a variety <strong>of</strong><br />
features that are currently believed to be relevant to the<br />
functional integrity <strong>of</strong> the knee or potentially involved<br />
in the pathophysiology <strong>of</strong> OA. Peterfy et al [39] described<br />
a scoring system in which cartilage lesions are graded<br />
according to both depth and extent along the joint surface.<br />
This score is part <strong>of</strong> a more comprehensive scoring<br />
system, in which multiple features are graded within<br />
the knee, such as articular cartilage integrity, subarticular<br />
bone marrow abnormality, subarticular cysts, subarticular<br />
bone attrition and marginal osteophytes. The surface<br />
areas <strong>of</strong> the knee joint are subdivided into 15 different<br />
regional anatomical landmarks in the extended knee.<br />
Cartilage signal and morphology are scored in each <strong>of</strong><br />
the articular-surface regions using FS T2-weighted FSE<br />
images and the FS 3D spoiled GE images. An eight-point<br />
scale for semi-quantitative scoring <strong>of</strong> articular cartilage<br />
signal and morphology was used [27] : 0 = normal thickness<br />
and signal; 1 = normal thickness but increased signal on<br />
T2-weighted MR images; 2.0 = partial-thickness focal<br />
defect < 1 cm in greatest width; 2.5 = full-thickness fo-<br />
48 January 28, 2010|Volume 2|Issue 1|
Figure 2 3D GE fat suppressed magnetic resonance imaging (MRI) at the<br />
sagittal plane. Bone cortex, bone marrow, and fat tissue appear to have a dark<br />
signal. Muscle appears to have a gray signal and cartilage a bright signal. The<br />
femur cartilage has been manually segmented at this slice.<br />
cal defect < 1 cm in greatest width; 3 = multiple areas<br />
<strong>of</strong> partial-thickness (grade 2.0) defects intermixed with<br />
areas <strong>of</strong> normal thickness, or a grade 2.0 defect wider<br />
than 1 cm but < 75% <strong>of</strong> the region; 4 = diffuse (≥ 75%<br />
<strong>of</strong> the region) partial-thickness loss; 5 = multiple areas<br />
<strong>of</strong> full-thickness loss (grade 2.5) or a grade 2.5 lesion<br />
wider than 1 cm but < 75% <strong>of</strong> the region; 6 = diffuse<br />
(≥ 75% <strong>of</strong> the region) full-thickness loss. Peterfy et al [39]<br />
reported that despite the complexity <strong>of</strong> the system, the<br />
inter-observer agreement among two trained readers<br />
was high. However, Conaghan et al [40] reported some<br />
limitations when applying the WORMS grading system<br />
to knees <strong>of</strong> 336 subjects assessed by three readers. The<br />
authors commented that adding up individual scoring<br />
subscales, as recommended by WORMS, is problematic,<br />
and that several subscales (in particular those for cartilage<br />
signal and morphology and for osteophytes) may need<br />
to be redeveloped [40] . Other compartment-based knee<br />
OA scoring systems have also been published. Kornaat et<br />
al [41] reported a knee OA scoring system termed KOSS,<br />
with intraobserver reproducibility <strong>of</strong> 0.76-0.96 (intraclass<br />
correlation coefficient: ICC) and interobserver reproducibility<br />
amongst two independent observers <strong>of</strong> 0.63-0.91.<br />
In a recent report the reliability <strong>of</strong> a further novel MRI<br />
scoring system for evaluating OA <strong>of</strong> the knee was explored<br />
[42] . Nine intra-articular anatomical divisions and<br />
eight items were tested, including features <strong>of</strong> cartilage,<br />
bone-marrow lesions (BML), osteophytes, synovitis, effusions,<br />
and ligaments, and a scale <strong>of</strong> 0-3 was applied for<br />
each <strong>of</strong> these to yield the Boston-Leeds Osteoarthritis<br />
Knee Score (BLOKS). A series <strong>of</strong> iterative reliability<br />
exercises was performed to reduce the initial items. The<br />
interreader reliability for the final BLOKS items ranged<br />
from 0.51 for meniscal extrusion to 0.79 for meniscal<br />
tear, with that for cartilage morphology being 0.72. In<br />
another sample, both BLOKS and WORMS were used to<br />
score BML. Maximum BML size in BLOKS had a positive<br />
linear relationship with pain, whereas in WORMS it<br />
did not. Baseline BML was associated with cartilage loss<br />
on both the BLOKS and WORMS scale, but the association<br />
was stronger for BLOKS than for WORMS. These<br />
WJR|www.wjgnet.com<br />
Wang YXJ et al . MRI assessment <strong>of</strong> the articular cartilage<br />
MRI semi-quantitative scoring approaches on OA have<br />
shown the ability to detect lesion progression over 1-2<br />
years [43] . Although the sensitivity to change observed can<br />
sometimes be small [44] , the ability to measure individual<br />
characteristics <strong>of</strong> OA is appealing in delineating structural<br />
risk factors for both pain and OA progression. The<br />
identification <strong>of</strong> early pathology in the course <strong>of</strong> disease<br />
may be enhanced by using these measures. For example,<br />
recent data suggest that full thickness defects may occur<br />
as part <strong>of</strong> early disease and that quantitative morphometry<br />
appears most useful (sensitive to change) in persons<br />
with late stage disease [45,46] .<br />
Quantitative assessment <strong>of</strong> human cartilage<br />
Due to the relatively low contrast in some areas <strong>of</strong> the<br />
joint surface, fully automated segmentation <strong>of</strong> knee<br />
cartilage volume from MR images has not yet been<br />
achieved. Computer-generated measurements based on<br />
signal intensity or predefined shape is not always reliable.<br />
Editing <strong>of</strong> automatically generated segmentations, or<br />
complete manual segmentation by experienced readers,<br />
is frequently necessary, therefore cartilage segmentation<br />
remains time-consuming (Figure 2). After segmentation,<br />
computation <strong>of</strong> the cartilage volume is achieved by<br />
simply summing the voxels attributed to the segmented<br />
cartilage (Figure 3). Osteophytes are excluded from segmentation.<br />
In the absence <strong>of</strong> OA, Hudelmaier et al [7,47] reported<br />
a 0.3%-0.5% reduction <strong>of</strong> cartilage thickness per annum<br />
due to cartilage thinning during normal aging. Other<br />
authors reported a faster rate <strong>of</strong> cartilage loss. Hanna<br />
et al [48] found a significant (-2.8% annual) reduction in<br />
total tibial cartilage volume over a 2 years period. With<br />
data summarized from studies on OA patients in the<br />
published literature, Eckstein et al [8] reported that the<br />
annual loss <strong>of</strong> cartilage volume was -136 μL (-4.1%) in the<br />
patella, -90 μL (-5.6%) in the medial tibia, and -107 μL<br />
(-6.0%) in the lateral tibia. The annual changes in cartilage<br />
volume/thickness exceeded the precision errors and<br />
appeared to be associated with clinical symptoms as well<br />
as with time to knee arthroplasty. However, results varied<br />
between published studies, the annual rate <strong>of</strong> change<br />
ranged from -0.3% to -7.4% in the medial tibia [8] . It has<br />
been reported that in early OA, cartilage may not be thin<br />
but rather thicker and swollen with water [49,50] .<br />
Because attrition in cartilage volume occurs at a very<br />
slow rate, measurement precision is <strong>of</strong> critical importance.<br />
Precision errors can be expressed as the standard<br />
deviation (SD) or coefficient <strong>of</strong> variation (CV%, SD<br />
divided by the mean value) <strong>of</strong> repeated measurements.<br />
Use <strong>of</strong> the CV% is most appropriate when SD is proportional<br />
to volume, for instance when comparing precision<br />
in different joint surfaces <strong>of</strong> the knee (i.e. medial<br />
tibia vs total femur). If the SD is independent <strong>of</strong> volume,<br />
it is more appropriate to compare SD values directly. It<br />
should be noted that when examining patients with severe<br />
OA, the CV% will be larger than that in healthy volunteers,<br />
even if the absolute error (SD) is similar. This<br />
is because patients with severe OA have less cartilage<br />
49 January 28, 2010|Volume 2|Issue 1|
A<br />
C<br />
Wang YXJ et al . MRI assessment <strong>of</strong> the articular cartilage<br />
volume. CV% <strong>of</strong> cartilage volume in the medial tibia in<br />
healthy volunteers has been reported to be in the range<br />
<strong>of</strong> 2%-3.5%. Precision errors for cartilage volume across<br />
studies at 1.5T for each cartilage component have been<br />
recently summarized [8] . Several studies examined the<br />
inter-observer and intra-observer precision <strong>of</strong> repeated<br />
analyses. It has been confirmed that segmenting all images<br />
in a subject’s series by the same skilled reader is<br />
more accurate than segmenting by different readers. To<br />
alleviate reader bias, the results <strong>of</strong> several readers can be<br />
averaged. Re-segmentation <strong>of</strong> the same data sets over a<br />
period <strong>of</strong> 1 year by the same user involved larger errors<br />
than those involved by segmentation <strong>of</strong> different data<br />
sets immediately after each other [46] . Therefore, to ensure<br />
the smallest coefficient <strong>of</strong> variation, in longitudinal studies<br />
comparative analyses should be performed in one<br />
post-processing session. Blinding the user to the order<br />
<strong>of</strong> the exams is necessary in order to avoid bias.<br />
Cartilage volume provides a first step in the analysis<br />
<strong>of</strong> cartilage morphology. More comprehensive information<br />
can be derived from separating the cartilage volume<br />
into its two factors, namely the cartilage thickness and<br />
the size <strong>of</strong> the joint surface area. Specific algorithms are<br />
required to differentiate between these factors. Other<br />
variables such as percent cartilaginous (or denuded)<br />
joint surface area, cartilage surface curvature, lesion size<br />
and depth can also be investigated. As overall volume<br />
and mean thickness for an entire cartilage plate may be<br />
relatively insensitive to regional/focal changes, several<br />
investigators developed techniques for displaying regional<br />
thickness patterns. Measuring cartilage volume in<br />
regions <strong>of</strong> the knee (e.g. medial tibia) and regional mean<br />
thickness as distinct from focal measures <strong>of</strong> change (re-<br />
WJR|www.wjgnet.com<br />
B<br />
D<br />
Figure 3 Quantitative 3D analysis <strong>of</strong> cartilage<br />
morphology from MRI. A: Sagittal MR image <strong>of</strong><br />
human knee obtained with a fat-suppressed GE<br />
sequence, femoral cartilage is segmented; B: 3D<br />
volume reconstruction <strong>of</strong> the femoral cartilage; C:<br />
Analysis <strong>of</strong> joint surface area by a triangulation<br />
technique; D: Computation <strong>of</strong> 3D thickness distribution,<br />
independent <strong>of</strong> section orientation. (Reproduced<br />
from reference 6, with kind permission <strong>of</strong><br />
Springer Science and Business Media).<br />
gion <strong>of</strong> interest analysis centered around focal defects)<br />
and measures <strong>of</strong> denuded cartilage may provide very<br />
different measurements about the important pathologic<br />
changes occurring in early disease. Distinguishing what<br />
measures are most discriminatory at each stage <strong>of</strong> the<br />
disease process is essential for utilizing these measures<br />
appropriately. Kshirsagar et al [51] suggested that analyzing<br />
subvolumes within the joint surface by such techniques<br />
can reduce precision errors relative to those from analyses<br />
<strong>of</strong> the entire cartilage plate and this was recently confirmed<br />
in a study by Koo et al [52] for the central weightbearing<br />
regions <strong>of</strong> the femoral condyles. These types<br />
<strong>of</strong> ‘local’ approaches to measuring changes in cartilage<br />
morphology are technically challenging, but they can be<br />
important, because the overall cartilage volume can remain<br />
constant even if there are focal changes in cartilage<br />
thickness and denuded bone. In order to track local/regional<br />
thickness changes over time, the bone interfaces<br />
from two data sets are “matched”, so that the thickness<br />
distribution can be compared on a point-by-point basis.<br />
Koo et al [52] suggested a ‘trimmed’ region defined to avoid<br />
errors arising at the edges <strong>of</strong> articulating surfaces, which<br />
are difficult to segment yet may be involved to only a<br />
minor degree in the disease process.<br />
A substantial percentage <strong>of</strong> the variability in cartilage<br />
volume is determined by joint surface area [53] . Wang<br />
et al [54] demonstrated that the medial and lateral tibial<br />
plateau area increased over a 2-year period (2.2% and<br />
1.5% per annum, respectively), with increases at the<br />
medial (but not lateral) tibia being stronger in male<br />
patients, in participants with high body mass index, and<br />
in patients with higher baseline grade <strong>of</strong> medial JSN.<br />
Metaphyseal enlargement with age and OA might create<br />
50 January 28, 2010|Volume 2|Issue 1|
A<br />
Figure 4 Sagittal view MRI at 4.7T <strong>of</strong> a rat knee with medial meniscal tear<br />
(A) and a rat with sham operation (B). A: Parts <strong>of</strong> the tibia cartilage become<br />
much thinner (white arrows). B: Normal tibia cartilage (white arrows). This<br />
animal model has been described in reference 22 (Wang et al [22] 2006).<br />
A<br />
Wang YXJ et al . MRI assessment <strong>of</strong> the articular cartilage<br />
MTC<br />
MFC<br />
B<br />
MFC<br />
Figure 5 High resolution MRI demonstrates cartilage erosion and<br />
proliferation in rat knee joint. A: Sagittal view MRI <strong>of</strong> a rat knee with a medial<br />
meniscal tear. White arrow shows neo-cartilage proliferation and black arrow<br />
shows articular cartilage loss; B: Histology section <strong>of</strong> the medial tibial condyle<br />
stained with Toluidine blue (× 100), 28 d after meniscal tear. Cartilage erosion<br />
(black arrow) and neo-cartilage proliferation (white arrow) are seen in the tibia<br />
cartilage. MTC: Medial tibia condyle; MFC: Media femur condyle. This animal<br />
model has been described in reference 22 (Wang et al [22] 2006).<br />
In animal based studies, MRI can be used to carry<br />
out in vivo longitudinal follow-up in the same animal<br />
and track the disease, monitor its progress and see<br />
how it responds to potential treatments [5] . In a recent<br />
study <strong>of</strong> a mono-iodoacetate induced arthritis model in<br />
rats [64] , MRI demonstrated that intra-articular s<strong>of</strong>t tissue<br />
inflammatory changes peaked at day 3 and then started<br />
to regress; bony damage appeared at day 14, peaked at<br />
day 21, with hallmarks <strong>of</strong> repair visible by day 35. A<br />
similar bi-phase pain response was observed clinically<br />
with the 1 mg mono-iodoacetate dose group, peaking at<br />
days 3 and 21. Therefore, MRI was able to characterize<br />
the pathological course <strong>of</strong> the arthritis model which<br />
enabled a link to be established between the structural<br />
changes and joint clinical discomfort. There are several<br />
“disease” or “structure” modifying OA drugs under<br />
clinical development. Although JSN on weight-bearing<br />
radiographs is still the accepted surrogate marker for<br />
demonstrating structural change by regulatory agencies,<br />
this is expected to change in the near future, given the<br />
limitations <strong>of</strong> radiography [3,4] , and MRI will very likely<br />
B<br />
WJR|www.wjgnet.com<br />
MTC<br />
A<br />
Figure 6 One example <strong>of</strong> the pitfalls in interpreting normal rat knee high<br />
resolution MR images. A: H&E-stained sections <strong>of</strong> a normal 3 mo rat knee, a<br />
mid-section through the femur. Dotted black arrow denotes the area <strong>of</strong> fibrous<br />
components together with their matrix, which are continuous with the cartilaginous<br />
component <strong>of</strong> the joint surface, and there is no bony component seen<br />
within this region. This region may appear as a notch or a cyst on MR images<br />
due to its higher signal; B: Sagittal MR image <strong>of</strong> a normal 3 mo old rat knee.<br />
White arrow in B denotes a gray area possibly composed <strong>of</strong> a mixture <strong>of</strong> cartilage<br />
and bone components.<br />
replace radiography in this context. As the validation<br />
<strong>of</strong> MRI endpoints for OA trials in human studies is still<br />
incomplete, the design and interpretation <strong>of</strong> a clinical<br />
trial will be strengthened if the effect <strong>of</strong> the drug is<br />
shown by the same endpoint in a valid animal model.<br />
By measuring the volume <strong>of</strong> medial tibia cartilage in a<br />
spontaneous OA guinea pig model, MRI demonstrated<br />
that doxycycline treatment halved the cartilage loss as<br />
compared to the vehicle treatment [65] .<br />
CONCLUsION<br />
MRI can semi-quantitatively assess cartilage morphology,<br />
and quantitatively evaluate regional cartilage volume and<br />
thickness. Other cartilage parameters including cartilage<br />
quality, cartilage surface smoothness, cartilage coverage,<br />
and distribution <strong>of</strong> change can also be evaluated.<br />
Progress made in MRI technology in the last few years<br />
allows longitudinal studies <strong>of</strong> human knee cartilage<br />
morphology with enough accuracy to follow the diseasecaused<br />
changes and also evaluate the therapeutic effects<br />
<strong>of</strong> chondro-protective drugs [66] . For cartilage repair<br />
patients, future studies will be needed to determine<br />
whether MRI is prognostic <strong>of</strong> clinical outcome and can<br />
replace arthroscopic biopsy for monitoring repair-tissue<br />
histology. In animal experimental settings, high field MRI<br />
can non-invasively provide detailed images <strong>of</strong> joints and<br />
can be used to carry out in vivo longitudinal follow-up<br />
in the same animal and track the disease as well as see<br />
how it responds to potential treatments. There are also<br />
several MRI methods that may allow evaluation <strong>of</strong> the<br />
glycosaminoglycan matrix or collagen network <strong>of</strong> articular<br />
cartilage and may be the most sensitive method for the<br />
detection <strong>of</strong> early changes. These techniques are being<br />
further explored and validated. With the development <strong>of</strong><br />
new therapies for OA and cartilage injury, MRI will play<br />
an important role in the diagnosis, staging, and evaluation<br />
<strong>of</strong> the effectiveness <strong>of</strong> these therapies.<br />
52 January 28, 2010|Volume 2|Issue 1|<br />
B
RefeReNCes<br />
1 Link TM, Steinbach LS, Ghosh S, Ries M, Lu Y, Lane N,<br />
Majumdar S. Osteoarthritis: MR imaging findings in different<br />
stages <strong>of</strong> disease and correlation with clinical findings.<br />
<strong>Radiology</strong> 2003; 226: 373-381<br />
2 Sowers MF, Hayes C, Jamadar D, Capul D, Lachance<br />
L, Jannausch M, Welch G. Magnetic resonance-detected<br />
subchondral bone marrow and cartilage defect characteristics<br />
associated with pain and X-ray-defined knee osteoarthritis.<br />
Osteoarthritis Cartilage 2003; 11: 387-393<br />
3 Amin S, LaValley MP, Guermazi A, Grigoryan M, Hunter<br />
DJ, Clancy M, Niu J, Gale DR, Felson DT. The relationship<br />
between cartilage loss on magnetic resonance imaging and<br />
radiographic progression in men and women with knee<br />
osteoarthritis. Arthritis Rheum 2005; 52: 3152-3159<br />
4 Raynauld JP, Martel-Pelletier J, Berthiaume MJ, Labonté F,<br />
Beaudoin G, de Guise JA, Bloch DA, Choquette D, Haraoui B,<br />
Altman RD, Hochberg MC, Meyer JM, Cline GA, Pelletier JP.<br />
Quantitative magnetic resonance imaging evaluation <strong>of</strong> knee<br />
osteoarthritis progression over two years and correlation<br />
with clinical symptoms and radiologic changes. Arthritis<br />
Rheum 2004; 50: 476-487<br />
5 Wang YX. In vivo magnetic resonance imaging <strong>of</strong> animal<br />
models <strong>of</strong> knee osteoarthritis. Lab Anim 2008; 42: 246-264<br />
6 Eckstein F, Reiser M, Englmeier KH, Putz R. In vivo<br />
morphometry and functional analysis <strong>of</strong> human articular<br />
cartilage with quantitative magnetic resonance imaging-from<br />
image to data, from data to theory. Anat Embryol (Berl)<br />
2001; 203: 147-173<br />
7 Hudelmaier M, Glaser C, Hohe J, Englmeier KH, Reiser M,<br />
Putz R, Eckstein F. Age-related changes in the morphology<br />
and deformational behavior <strong>of</strong> knee joint cartilage. Arthritis<br />
Rheum 2001; 44: 2556-2561<br />
8 Eckstein F, Burstein D, Link TM. Quantitative MRI <strong>of</strong><br />
cartilage and bone: degenerative changes in osteoarthritis.<br />
NMR Biomed 2006; 19: 822-854<br />
9 Sittek H, Eckstein F, Gavazzeni A, Milz S, Kiefer B, Schulte<br />
E, Reiser M. Assessment <strong>of</strong> normal patellar cartilage volume<br />
and thickness using MRI: an analysis <strong>of</strong> currently available<br />
pulse sequences. Skeletal Radiol 1996; 25: 55-62<br />
10 Eckstein F, Stammberger T, Priebsch J, Englmeier KH, Reiser<br />
M. Effect <strong>of</strong> gradient and section orientation on quantitative<br />
analysis <strong>of</strong> knee joint cartilage. J Magn Reson Imaging 2000; 11:<br />
161-167<br />
11 Rubenstein JD, Li JG, Majumdar S, Henkelman RM. Image<br />
resolution and signal-to-noise ratio requirements for MR<br />
imaging <strong>of</strong> degenerative cartilage. AJR Am J Roentgenol 1997;<br />
169: 1089-1096<br />
12 Hardya PA, Newmark R, Liu YM, Meier D, Norris S, Piraino<br />
DW, Shah A. The influence <strong>of</strong> the resolution and contrast<br />
on measuring the articular cartilage volume in magnetic<br />
resonance images. Magn Reson Imaging 2000; 18: 965-972<br />
13 Wluka AE, Stuckey S, Snaddon J, Cicuttini FM. The determinants<br />
<strong>of</strong> change in tibial cartilage volume in osteoarthritic<br />
knees. Arthritis Rheum 2002; 46: 2065-2072<br />
14 Cicuttini FM, Wluka AE, Wang Y, Stuckey SL. Longitudinal<br />
study <strong>of</strong> changes in tibial and femoral cartilage in knee<br />
osteoarthritis. Arthritis Rheum 2004; 50: 94-97<br />
15 Eckstein F, Hudelmaier M, Wirth W, Kiefer B, Jackson R, Yu<br />
J, Eaton CB, Schneider E. Double echo steady state magnetic<br />
resonance imaging <strong>of</strong> knee articular cartilage at 3 Tesla: a<br />
pilot study for the Osteoarthritis Initiative. Ann Rheum Dis<br />
2006; 65: 433-441<br />
16 Kornaat PR, Reeder SB, Koo S, Brittain JH, Yu H, Andriacchi<br />
TP, Gold GE. MR imaging <strong>of</strong> articular cartilage at 1.5T and<br />
3.0T: comparison <strong>of</strong> SPGR and SSFP sequences. Osteoarthritis<br />
Cartilage 2005; 13: 338-344<br />
17 Eckstein F, Charles HC, Buck RJ, Kraus VB, Remmers<br />
AE, Hudelmaier M, Wirth W, Evelhoch JL. Accuracy and<br />
precision <strong>of</strong> quantitative assessment <strong>of</strong> cartilage morphology<br />
WJR|www.wjgnet.com<br />
Wang YXJ et al . MRI assessment <strong>of</strong> the articular cartilage<br />
by magnetic resonance imaging at 3.0T. Arthritis Rheum 2005;<br />
52: 3132-3136<br />
18 Masi JN, Sell CA, Phan C, Han E, Newitt D, Steinbach L,<br />
Majumdar S, Link TM. Cartilage MR imaging at 3.0 versus that<br />
at 1.5 T: preliminary results in a porcine model. <strong>Radiology</strong> 2005;<br />
236: 140-150<br />
19 Link TM, Sell CA, Masi JN, Phan C, Newitt D, Lu Y, Steinbach<br />
L, Majumdar S. 3.0 vs 1.5 T MRI in the detection <strong>of</strong> focal<br />
cartilage pathology--ROC analysis in an experimental model.<br />
Osteoarthritis Cartilage 2006; 14: 63-70<br />
20 Gold GE, McCauley TR, Gray ML, Disler DG. What's new<br />
in cartilage? Radiographics 2003; 23: 1227-1242<br />
21 Kneeland JB, Reddy R. Frontiers in musculoskeletal MRI:<br />
articular cartilage. J Magn Reson Imaging 2007; 25: 339-344<br />
22 Wang YX, Westwood FR, Moores SM, Ball A, Heapy C,<br />
Pickford R, Tessier JJ, Bowyer J. In vivo high-resolution<br />
three-dimensional magnetic resonance imaging <strong>of</strong> a rat<br />
knee osteoarthritis model induced by meniscal transection.<br />
Proceedings <strong>of</strong> the International Society for Magnetic<br />
Resonance in Medicine, Seattle, 2006: No. 3633<br />
23 Faure P, Doan BT, Beloeil JC. In-vivo high resolution threedimensional<br />
MRI studies <strong>of</strong> rat joints at 7 T. NMR Biomed<br />
2003; 16: 484-493<br />
24 Tessier JJ, Bowyer J, Brownrigg NJ, Peers IS, Westwood FR,<br />
Waterton JC, Maciewicz RA. Characterisation <strong>of</strong> the guinea<br />
pig model <strong>of</strong> osteoarthritis by in vivo three-dimensional<br />
magnetic resonance imaging. Osteoarthritis Cartilage 2003; 11:<br />
845-853<br />
25 Eckstein F, Mosher T, Hunter D. Imaging <strong>of</strong> knee osteoarthritis:<br />
data beyond the beauty. Curr Opin Rheumatol 2007;<br />
19: 435-443<br />
26 Gray ML, Burstein D. Molecular (and functional) imaging<br />
<strong>of</strong> articular cartilage. J Musculoskelet Neuronal Interact 2004; 4:<br />
365-368<br />
27 Roos EM, Dahlberg L. Positive effects <strong>of</strong> moderate exercise<br />
on glycosaminoglycan content in knee cartilage: a fourmonth,<br />
randomized, controlled trial in patients at risk <strong>of</strong><br />
osteoarthritis. Arthritis Rheum 2005; 52: 3507-3514<br />
28 Link TM, Stahl R, Woertler K. Cartilage imaging: motivation,<br />
techniques, current and future significance. Eur Radiol 2007;<br />
17: 1135-1146<br />
29 Creamer P. Osteoarthritis pain and its treatment. Curr Opin<br />
Rheumatol 2000; 12: 450-455<br />
30 Mazzuca SA, Brandt KD, Lane KA, Katz BP. Knee pain reduces<br />
joint space width in conventional standing anteroposterior<br />
radiographs <strong>of</strong> osteoarthritic knees. Arthritis Rheum<br />
2002; 46: 1223-1227<br />
31 Amin S, LaValley MP, Guermazi A, Grigoryan M, Hunter<br />
DJ, Clancy M, Niu J, Gale DR, Felson DT. The relationship<br />
between cartilage loss on magnetic resonance imaging and<br />
radiographic progression in men and women with knee<br />
osteoarthritis. Arthritis Rheum 2005; 52: 3152-3159<br />
32 Recht MP, Goodwin DW, Winalski CS, White LM. MRI<br />
<strong>of</strong> articular cartilage: revisiting current status and future<br />
directions. AJR Am J Roentgenol 2005; 185: 899-914<br />
33 Lee KY, Masi JN, Sell CA, Schier R, Link TM, Steinbach LS,<br />
Safran M, Ma B, Majumdar S. Computer-aided quantification<br />
<strong>of</strong> focal cartilage lesions using MRI: accuracy and initial<br />
arthroscopic comparison. Osteoarthritis Cartilage 2005; 13:<br />
728-737<br />
34 Bredella MA, Tirman PF, Peterfy CG, Zarlingo M, Feller JF,<br />
Bost FW, Belzer JP, Wischer TK, Genant HK. Accuracy <strong>of</strong><br />
T2-weighted fast spin-echo MR imaging with fat saturation<br />
in detecting cartilage defects in the knee: comparison with<br />
arthroscopy in 130 patients. AJR Am J Roentgenol 1999; 172:<br />
1073-1080<br />
35 McGibbon CA, Trahan CA. Measurement accuracy <strong>of</strong> focal<br />
cartilage defects from MRI and correlation <strong>of</strong> MRI graded<br />
lesions with histology: a preliminary study. Osteoarthritis<br />
Cartilage 2003; 11: 483-493<br />
36 Graichen H, Al-Shamari D, Hinterwimmer S, von Eisenhart-<br />
Rothe R, Vogl T, Eckstein F. Accuracy <strong>of</strong> quantitative magnetic<br />
53 January 28, 2010|Volume 2|Issue 1|
Wang YXJ et al . MRI assessment <strong>of</strong> the articular cartilage<br />
resonance imaging in the detection <strong>of</strong> ex vivo focal cartilage<br />
defects. Ann Rheum Dis 2005; 64: 1120-1125<br />
37 Drapé JL, Pessis E, Auleley GR, Chevrot A, Dougados M,<br />
Ayral X. Quantitative MR imaging evaluation <strong>of</strong> chondropathy<br />
in osteoarthritic knees. <strong>Radiology</strong> 1998; 208: 49-55<br />
38 Disler DG, McCauley TR, Kelman CG, Fuchs MD, Ratner LM,<br />
Wirth CR, Hospodar PP. Fat-suppressed three-dimensional<br />
spoiled gradient-echo MR imaging <strong>of</strong> hyaline cartilage defects<br />
in the knee: comparison with standard MR imaging and<br />
arthroscopy. AJR Am J Roentgenol 1996; 167: 127-132<br />
39 Peterfy CG, Guermazi A, Zaim S, Tirman PF, Miaux Y, White<br />
D, Kothari M, Lu Y, Fye K, Zhao S, Genant HK. Whole-Organ<br />
Magnetic Resonance Imaging Score (WORMS) <strong>of</strong> the knee in<br />
osteoarthritis. Osteoarthritis Cartilage 2004; 12: 177-190<br />
40 Conaghan PG, Hunter D, Tennant A, Amin S, Clancy M,<br />
Guermazi A, Peterfy C, Genant H, Felson DT. Evaluation<br />
an MRI scoring system for osteoarthritis <strong>of</strong> the knee using<br />
modern psychometric approaches. Osteoarthritis Cartilage<br />
2004; 12 (Suppl B): S119-S120<br />
41 Kornaat PR, Ceulemans RY, Kroon HM, Riyazi N,<br />
Kloppenburg M, Carter WO, Woodworth TG, Bloem JL.<br />
MRI assessment <strong>of</strong> knee osteoarthritis: Knee Osteoarthritis<br />
Scoring System (KOSS)--inter-observer and intra-observer<br />
reproducibility <strong>of</strong> a compartment-based scoring system.<br />
Skeletal Radiol 2005; 34: 95-102<br />
42 Hunter DJ, Lo GH, Gale D, Grainger AJ, Guermazi A,<br />
Conaghan PG. The reliability <strong>of</strong> a new scoring system for<br />
knee osteoarthritis MRI and the validity <strong>of</strong> bone marrow<br />
lesion assessment: BLOKS (Boston Leeds Osteoarthritis<br />
Knee Score). Ann Rheum Dis 2008; 67: 206-211<br />
43 Eckstein F, Cicuttini F, Raynauld JP, Waterton JC, Peterfy<br />
C. Magnetic resonance imaging (MRI) <strong>of</strong> articular cartilage<br />
in knee osteoarthritis (OA): morphological assessment.<br />
Osteoarthritis Cartilage 2006; 14 Suppl A: A46-A75<br />
44 Hunter DJ, Conaghan PG, Peterfy CG, Bloch D, Guermazi A,<br />
Woodworth T, Stevens R, Genant HK. Responsiveness, effect<br />
size, and smallest detectable difference <strong>of</strong> Magnetic Resonance<br />
Imaging in knee osteoarthritis. Osteoarthritis Cartilage 2006; 14<br />
Suppl A: A112-A115<br />
45 Hunter DJ, Niu JB, Zhang Y, LaValley M, McLennan CE,<br />
Hudelmaier M, Eckstein F, Felson DT. Premorbid knee osteoarthritis<br />
is not characterised by diffuse thinness: the Framingham<br />
Osteoarthritis Study. Ann Rheum Dis 2008; 67: 1545-1549<br />
46 Eckstein F, Heudorfer L, Faber SC, Burgkart R, Englmeier<br />
KH, Reiser M. Long-term and resegmentation precision <strong>of</strong><br />
quantitative cartilage MR imaging (qMRI). Osteoarthritis<br />
Cartilage 2002; 10: 922-928<br />
47 Hudelmaier M, Glaser C, Englmeier KH, Reiser M, Putz R,<br />
Eckstein F. Correlation <strong>of</strong> knee-joint cartilage morphology<br />
with muscle cross-sectional areas vs. anthropometric variables.<br />
Anat Rec A Discov Mol Cell Evol Biol 2003; 270: 175-184<br />
48 Hanna F, Ebeling PR, Wang Y, O'Sullivan R, Davis S, Wluka<br />
AE, Cicuttini FM. Factors influencing longitudinal change in<br />
knee cartilage volume measured from magnetic resonance<br />
imaging in healthy men. Ann Rheum Dis 2005; 64: 1038-1042<br />
49 Maroudas A, Bullough P. Permeability <strong>of</strong> articular cartilage.<br />
Nature 1968; 219: 1260-1261<br />
50 Mow V, Setton L. Mechanical properties <strong>of</strong> normal and<br />
osteoarthritis articular cartilage. In: Brandt K, Doherty M,<br />
Lohmander LS, editors. Osteoarthritis. New York: Oxford<br />
Medical Publications, 1998: 108-122<br />
51 Kshirsagar AA, Watson PJ, Tyler JA, Hall LD. Measurement<br />
<strong>of</strong> localized cartilage volume and thickness <strong>of</strong> human knee<br />
joints by computer analysis <strong>of</strong> three-dimensional magnetic<br />
resonance images. Invest Radiol 1998; 33: 289-299<br />
WJR|www.wjgnet.com<br />
52 Koo S, Gold GE, Andriacchi TP. Considerations in measuring<br />
cartilage thickness using MRI: factors influencing reproducibility<br />
and accuracy. Osteoarthritis Cartilage 2005; 13: 782-789<br />
53 Burgkart R, Glaser C, Hinterwimmer S, Hudelmaier M,<br />
Englmeier KH, Reiser M, Eckstein F. Feasibility <strong>of</strong> T and Z<br />
scores from magnetic resonance imaging data for quantification<br />
<strong>of</strong> cartilage loss in osteoarthritis. Arthritis Rheum 2003; 48:<br />
2829-2835<br />
54 Wang Y, Wluka AE, Cicuttini FM. The determinants <strong>of</strong><br />
change in tibial plateau bone area in osteoarthritic knees: a<br />
cohort study. Arthritis Res Ther 2005; 7: R687-R693<br />
55 Edinger DT, Hayashi K, Hongyu Y, Markel MD, Manley<br />
PA. Histomorphometric analysis <strong>of</strong> the proximal portion <strong>of</strong><br />
the femur in dogs with osteoarthritis. Am J Vet Res 2000; 61:<br />
1267-1272<br />
56 Calvo E, Palacios I, Delgado E, Ruiz-Cabello J, Hernández P,<br />
Sánchez-Pernaute O, Egido J, Herrero-Beaumont G. Highresolution<br />
MRI detects cartilage swelling at the early stages<br />
<strong>of</strong> experimental osteoarthritis. Osteoarthritis Cartilage 2001; 9:<br />
463-472<br />
57 Wang HH, Wang YX, Griffith JF, Sun YL, Zhang G, Chan<br />
CW, Qin L, Ahuja AT, Teng LS. Pitfalls in interpreting rat<br />
knee joint magnetic resonance images and their histological<br />
correlation. Acta Radiol 2009; 50: 1042-1048<br />
58 Kawahara Y, Uetani M, Nakahara N, Doiguchi Y, Nishiguchi<br />
M, Futagawa S, Kinoshita Y, Hayashi K. Fast spin-echo MR <strong>of</strong><br />
the articular cartilage in the osteoarthrotic knee. Correlation<br />
<strong>of</strong> MR and arthroscopic findings. Acta Radiol 1998; 39: 120-125<br />
59 Yoshioka H, Stevens K, Hargreaves BA, Steines D, Genovese<br />
M, Dillingham MF, Winalski CS, Lang P. Magnetic resonance<br />
imaging <strong>of</strong> articular cartilage <strong>of</strong> the knee: comparison<br />
between fat-suppressed three-dimensional SPGR imaging,<br />
fat-suppressed FSE imaging, and fat-suppressed threedimensional<br />
DEFT imaging, and correlation with arthroscopy.<br />
J Magn Reson Imaging 2004; 20: 857-864<br />
60 Ding C, Garnero P, Cicuttini F, Scott F, Cooley H, Jones G.<br />
Knee cartilage defects: association with early radiographic<br />
osteoarthritis, decreased cartilage volume, increased joint<br />
surface area and type II collagen breakdown. Osteoarthritis<br />
Cartilage 2005; 13: 198-205<br />
61 Ding C, Cicuttini F, Scott F, Cooley H, Jones G. Knee structural<br />
alteration and BMI: a cross-sectional study. Obes Res 2005; 13:<br />
350-361<br />
62 Hunter DJ, March L, Sambrook PN. The association <strong>of</strong><br />
cartilage volume with knee pain. Osteoarthritis Cartilage 2003;<br />
11: 725-729<br />
63 Wluka AE, Wolfe R, Stuckey S, Cicuttini FM. How does<br />
tibial cartilage volume relate to symptoms in subjects with<br />
knee osteoarthritis? Ann Rheum Dis 2004; 63: 264-268<br />
64 Wang YX, Heapy C, Pickford R, Tessier JJ, Ball A, Holmes<br />
A, Read SJ. MRI structural changes and joint discomfort: an<br />
investigation in the mono-iodoacetate induced arthritis model<br />
in rats. Proceedings <strong>of</strong> the European Society for Magnetic<br />
Resonance in Medicine and Biology, Basle, 2005: No. 283<br />
65 Tessier J, Bowyer J, Heapy C, Elliott J, Pickford R, Flannelly<br />
J, Maciewicz R. Doxycycline Slows MRI-Assessed Cartilage<br />
Volume Loss in the Guinea Pig Model <strong>of</strong> Osteoarthritis.<br />
Proceedings <strong>of</strong> the International Society for Magnetic<br />
Resonance in Medicine, Seattle, 2006: No. 61<br />
66 Berthiaume MJ, Raynauld JP, Martel-Pelletier J, Labonté F,<br />
Beaudoin G, Bloch DA, Choquette D, Haraoui B, Altman RD,<br />
Hochberg M, Meyer JM, Cline GA, Pelletier JP. Meniscal tear<br />
and extrusion are strongly associated with progression <strong>of</strong><br />
symptomatic knee osteoarthritis as assessed by quantitative<br />
magnetic resonance imaging. Ann Rheum Dis 2005; 64: 556-563<br />
S- Editor Cheng JX L- Editor Webster JR E- Editor Zheng XM<br />
54 January 28, 2010|Volume 2|Issue 1|
W J R<br />
Online Submissions: http://www.wjgnet.com/1949-8470<strong>of</strong>fice<br />
wjr@wjgnet.com<br />
www.wjgnet.com<br />
ACKNOWLEDGMENTS<br />
Acknowledgments to reviewers <strong>of</strong> <strong>World</strong> <strong>Journal</strong> <strong>of</strong><br />
<strong>Radiology</strong><br />
Many reviewers have contributed their expertise and<br />
time to the peer review, a critical process to ensure the<br />
quality <strong>of</strong> <strong>World</strong> <strong>Journal</strong> <strong>of</strong> <strong>Radiology</strong>. The editors and<br />
authors <strong>of</strong> the articles submitted to the journal are<br />
grateful to the following reviewers for evaluating the<br />
articles (including those published in this issue and those<br />
rejected for this issue) during the last editing time period.<br />
Herwig R Cerwenka, MD, Pr<strong>of</strong>essor, Department <strong>of</strong> Surgery,<br />
Medical University <strong>of</strong> Graz, Auenbruggerplatz 29, A-8036 Graz,<br />
Austria<br />
Patrick M Colletti, MD, Pr<strong>of</strong>essor <strong>of</strong> <strong>Radiology</strong> and Medicine,<br />
Director Nuclear Medicine Fellowship, USC Keck School <strong>of</strong><br />
Medicine, Pr<strong>of</strong>essor <strong>of</strong> Biokinesiology, Pr<strong>of</strong>essor <strong>of</strong> Pharmacology<br />
and Pharmaceutical Sciences, Chief <strong>of</strong> MRI, LAC+USC Imaging<br />
Science Center, University <strong>of</strong> Southern California, 1200 N State<br />
Street Room 3566, Los Angeles, CA 90033, United States<br />
Juebin Huang, MD, PhD, Assistant Pr<strong>of</strong>essor, Department <strong>of</strong><br />
Neurology, The University <strong>of</strong> Mississippi Medical Center, 2500 N.<br />
State Street, Jackson, MS 39216, United States<br />
Yasunori Minami, MD, PhD, Division <strong>of</strong> <strong>Gastroenterology</strong> and<br />
Hepatology, Department <strong>of</strong> Internal Medicine, 377-2 Ohno-higashi<br />
Osaka-sayama Osaka 589-8511, Japan<br />
百世登<br />
<strong>World</strong> <strong>Journal</strong> <strong>of</strong><br />
<strong>Radiology</strong><br />
<strong>World</strong> J Radiol 2010 January 28; 2(1): I<br />
ISSN 1949-8470 (online)<br />
© 2010 Baishideng. All rights reserved.<br />
Yahya Paksoy, MD, Pr<strong>of</strong>essor, Department <strong>of</strong> <strong>Radiology</strong>, Selcuk<br />
University Meram Chool <strong>of</strong> Medicine, 42085 Konya, Turkey<br />
Jai Soung Park, MD, PhD, Pr<strong>of</strong>essor, Department <strong>of</strong> <strong>Radiology</strong>,<br />
Soonchunhyang University Buchen Hospital, 1174 jung-dong,<br />
Wonmi-gu, Bucheon, Gyeonggi-do 420-767, South Korea<br />
Georgios A Plataniotis, MD, PhD, Clinical Oncologist,<br />
Department <strong>of</strong> Oncology, Aberdeen Royal Infirmary, Foresterhill,<br />
Aberdeen, AB25 2ZN, United Kingdom<br />
AAK Abdel Razek, MD, Pr<strong>of</strong>essor, Diagnostic <strong>Radiology</strong> Department,<br />
62 El Nokri St, Meet Hadr, Mansoura Faculty <strong>of</strong> Medicine,<br />
Mansoura, Egypt<br />
Djordjije Saranovic, MD, PhD, Pr<strong>of</strong>essor, Department <strong>of</strong><br />
Digestive <strong>Radiology</strong> (First Surgical Clinic), Institute <strong>of</strong> <strong>Radiology</strong>,<br />
Clinical Center <strong>of</strong> Serbia, Koste Todorovica 6, 11000 Belgrade, Serbia<br />
Lars Victor Baron von Engelhardt, MD, Department <strong>of</strong><br />
Orthopedic and Trauma Surgery, St. Josef Hospital - Ruhr-University<br />
Bochum, Gudrunstrasse 56, 44791 Bochum, Germany<br />
Hui-Xiong Xu, MD, PhD, Pr<strong>of</strong>essor, Department <strong>of</strong> Medical<br />
Ultrasonics, Institute <strong>of</strong> Diagnostic and Interventional Ultrasound,<br />
Sun Yat-Sen University, 58 Zhongshan Road 2, Guangzhou 510080,<br />
Guangdong Province, China<br />
TM©<br />
Baishideng WJR|www.wjgnet.com I<br />
January 28, 2010|Volume 2|Issue 1|
W J R<br />
Online Submissions: http://www.wjgnet.com/1949-8470<strong>of</strong>fice<br />
wjr@wjgnet.com<br />
www.wjgnet.com<br />
Meetings<br />
Events Calendar 2010<br />
January 4-8<br />
Beaver Creek, Colorado, United States<br />
18th Annual Winter Diagnostic<br />
Imaging Update<br />
January 7-9<br />
Leuven, Belgium<br />
4th Leuven Course on Ear Imaging<br />
January 16-17<br />
Hollywood, Florida, United States<br />
The Symposium on Clinical<br />
Interventional Oncology<br />
January 17-21<br />
Hollywood, Florida, United States<br />
The International Symposium on<br />
Endovascular Therapy<br />
January 21-22<br />
Cairo, Egypt<br />
BGICC Breast Gyne International<br />
Cancer Conference<br />
January 21-24<br />
Phoenix, AZ, United States<br />
13th Society for Cardiovascular<br />
Magnetic Resonance (SCMR) Annual<br />
Scientific Sessions<br />
January 23-23<br />
Atlanta, GA, United States<br />
Emory Winship Cancer Institute:<br />
Breast Cancer 2010: Advances in<br />
Science, Emerging Data, and Novel<br />
Therapeutics<br />
January 25-29<br />
Maui, HI, United States<br />
Musculoskeletal & Neuroradiology<br />
MR Imaging Update in Maui<br />
January 27-February 2<br />
Albuquerque, NM, United States<br />
2010 SNM Conjoint Mid-Winter<br />
Meetings<br />
January 29-30<br />
Barcelona, Spain<br />
7th European Congress: Perspectives<br />
in Gynecologic Oncology<br />
February 7-12<br />
Vail, CO, United States<br />
15th Annual Vail 2010: Multislice CT<br />
in Clinical Practice<br />
WJR|www.wjgnet.com<br />
<strong>World</strong> <strong>Journal</strong> <strong>of</strong><br />
<strong>Radiology</strong><br />
February 11-13<br />
Las Vegas, NV, United States<br />
5th Annual Symposium on PET/CT<br />
and Molecular Imaging<br />
February 16-19<br />
Park City, UT, United States<br />
6th Interventional/<br />
Neurointerventional Conference<br />
February 18-19<br />
London, United Kingdom<br />
Diagnostic and Interventional<br />
<strong>Radiology</strong><br />
February 18-21<br />
Las Vegas, NV, United States<br />
American Society <strong>of</strong> Spine <strong>Radiology</strong><br />
Annual Symposium<br />
February 20-20<br />
Jacksonville, Florida, United States<br />
Mayo Clinic Molecular Markers and<br />
Management <strong>of</strong> Breast Cancer<br />
February 20-21<br />
Bethesda, Maryland, United States<br />
25th Anniversary Washington<br />
Neuroradiology Review<br />
February 21-26<br />
Orlando, FL, United States<br />
The Abdominal <strong>Radiology</strong> Course<br />
February 21-27<br />
Snowmass, CO, United States<br />
16th Annual Snowmass 2010:<br />
Clinical Ultrasound<br />
February 22-26<br />
Bethesda, MD, United States<br />
48th Annual Dr. Kenneth M. Earle<br />
Memorial Neuropathology Review<br />
February 24-27<br />
Lake Buena Vista, FL, United States<br />
ACRO 2010 American College <strong>of</strong><br />
Radiation Oncology Symposium:<br />
Clinical Radiation Oncology<br />
Challenges<br />
February 25-27<br />
Chandler, AZ, United States<br />
Multidisciplinary Head and Neck<br />
Cancer Symposium<br />
February 26-27<br />
Brussels, Belgium<br />
10èmes Mises au Point en Imagerie<br />
Ostéo-Articulaire<br />
February 27-March 1<br />
Cairo, Egypt<br />
7th <strong>Gastroenterology</strong> Hepatology &<br />
Endoscopy Symposium<br />
I<br />
February 28-March 4<br />
Scottsdale, AZ, United States<br />
International Congress XXIII on<br />
Endovascular Interventions<br />
February 28-March 5<br />
Breckenridge, CO, United States<br />
5th Annual Breckenridge 2010:<br />
Musculoskeletal MRI<br />
March 3-6<br />
Las Vegas, Nevada, United States<br />
11th Annual Advances in Breast<br />
Imaging and Interventions<br />
March 4-8<br />
Vienna, Austria<br />
European Congress <strong>of</strong> <strong>Radiology</strong><br />
(ECR 2010) Annual Meeting<br />
March 5-7<br />
Mt Tremblant, QC, Canada<br />
Neuroimaging and Head & Neck<br />
<strong>Radiology</strong> Update in Mt Tremblant<br />
March 7-11<br />
San Diego, CA, United States<br />
SCBT-MR Masters in Body Imaging:<br />
"What's New, What's Hot, What You<br />
May Not Have Known"<br />
March 10-13<br />
San Antonio, Texas, United States<br />
Clinical Osteoporosis 2010: An<br />
ISCD-NOF Symposium<br />
March 11-13<br />
Barcelona, Spain<br />
EORTC Group Meeting: EORTC<br />
Radiation Oncology Group<br />
March 11-13<br />
Hannover, Germany<br />
40. Kongress der Deutschen<br />
Gesellschaft für Endoskopie und<br />
Bildgebende Verfahren e.V.<br />
March 13-18<br />
Tampa, FL, United states<br />
Society <strong>of</strong> interventional radiology<br />
35th Annual Scientific Meeting<br />
March 14-17<br />
Park City, UT, United States<br />
14th Annual Park City 2010: MRI in<br />
Clinical Practice<br />
March 22-26<br />
Beaver Creek, CO, United States<br />
NYU <strong>Radiology</strong> Spring Skiing<br />
Symposium in Beaver Creek<br />
March 22-26<br />
Maui, HI, United States<br />
18th Annual Spring Diagnostic<br />
Imaging Update<br />
<strong>World</strong> J Radiol 2010 January 28; 2(1): I<br />
ISSN 1949-8470 (online)<br />
© 2010 Baishideng. All rights reserved.<br />
March 24-27<br />
San Diego, California, United States<br />
2010 American institute <strong>of</strong> ultrasound<br />
in Medicine Annual Convention<br />
Preliminary Program<br />
March 24-27<br />
Barcelona, Spain<br />
7th European Breast Cancer<br />
Conference<br />
April 8-12<br />
Shanghai, China<br />
The 26th International Congress <strong>of</strong><br />
<strong>Radiology</strong><br />
September 8-12<br />
Guangzhou, China<br />
Chinese Society <strong>of</strong> Interventional<br />
<strong>Radiology</strong>, 2010 CSIR<br />
November 28-December 03<br />
Chicago, United States<br />
Radiological Society <strong>of</strong> North<br />
America: 2010 Annual Meeting<br />
January 28, 2010|Volume 2|Issue 1|
W J R<br />
Online Submissions: http://www.wjgnet.com/1949-8470<strong>of</strong>fice<br />
wjr@wjgnet.com<br />
www.wjgnet.com<br />
Instructions to authors<br />
GENERAL INFORMATION<br />
<strong>World</strong> <strong>Journal</strong> <strong>of</strong> <strong>Radiology</strong> (<strong>World</strong> J Radiol, WJR, online ISSN<br />
1949-8470, DOI: 10.4329), is a monthly, open-access (OA),<br />
peer-reviewed journal supported by an editorial board <strong>of</strong> 304<br />
experts in <strong>Radiology</strong> from 38 countries.<br />
The biggest advantage <strong>of</strong> the OA model is that it provides<br />
free, full-text articles in PDF and other formats for experts and<br />
the public without registration, which eliminates the obstacle that<br />
traditional journals possess and usually delays the speed <strong>of</strong> the<br />
propagation and communication <strong>of</strong> scientific research results.<br />
The open access model has been proven to be a true approach<br />
that may achieve the ultimate goal <strong>of</strong> the journals, i.e. the<br />
maximization <strong>of</strong> the value to the readers, authors and society.<br />
The role <strong>of</strong> academic journals is to exhibit the scientific<br />
levels <strong>of</strong> a country, a university, a center, a department,<br />
and even a scientist, and build an important bridge for<br />
communication between scientists and the public. As we<br />
all know, the significance <strong>of</strong> the publication <strong>of</strong> scientific<br />
articles lies not only in disseminating and communicating<br />
innovative scientific achievements and academic views, as well<br />
as promoting the application <strong>of</strong> scientific achievements, but<br />
also in formally recognizing the “priority” and “copyright”<br />
<strong>of</strong> innovative achievements published, as well as evaluating<br />
research performance and academic levels. So, to realize<br />
these desired attributes <strong>of</strong> WJR and create a well-recognized<br />
journal, the following four types <strong>of</strong> personal benefits should<br />
be maximized. The maximization <strong>of</strong> personal benefits refers<br />
to the pursuit <strong>of</strong> the maximum personal benefits in a wellconsidered<br />
optimal manner without violation <strong>of</strong> the laws,<br />
ethical rules and the benefits <strong>of</strong> others. (1) Maximization<br />
<strong>of</strong> the benefits <strong>of</strong> editorial board members: The primary<br />
task <strong>of</strong> editorial board members is to give a peer review <strong>of</strong><br />
an unpublished scientific article via online <strong>of</strong>fice system to<br />
evaluate its innovativeness, scientific and practical values and<br />
determine whether it should be published or not. During peer<br />
review, editorial board members can also obtain cutting-edge<br />
information in that field at first hand. As leaders in their field,<br />
they have priority to be invited to write articles and publish<br />
commentary articles. We will put peer reviewers’ names and<br />
affiliations along with the article they reviewed in the journal<br />
to acknowledge their contribution; (2) Maximization <strong>of</strong> the<br />
benefits <strong>of</strong> authors: Since WJR is an open-access journal,<br />
readers around the world can immediately download and read,<br />
free <strong>of</strong> charge, high-quality, peer-reviewed articles from WJR<br />
<strong>of</strong>ficial website, thereby realizing the goals and significance<br />
<strong>of</strong> the communication between authors and peers as well as<br />
public reading; (3) Maximization <strong>of</strong> the benefits <strong>of</strong> readers:<br />
Readers can read or use, free <strong>of</strong> charge, high-quality peerreviewed<br />
articles without any limits, and cite the arguments,<br />
viewpoints, concepts, theories, methods, results, conclusion<br />
or facts and data <strong>of</strong> pertinent literature so as to validate<br />
the innovativeness, scientific and practical values <strong>of</strong> their<br />
own research achievements, thus ensuring that their articles<br />
百世登<br />
<strong>World</strong> <strong>Journal</strong> <strong>of</strong><br />
<strong>Radiology</strong><br />
<strong>World</strong> J Radiol 2010 January 28; 2(1): I-V<br />
ISSN 1949-8470 (online)<br />
© 2010 Baishideng. All rights reserved.<br />
have novel arguments or viewpoints, solid evidence and<br />
correct conclusion; and (4) Maximization <strong>of</strong> the benefits <strong>of</strong><br />
employees: It is an iron law that a first-class journal is unable to<br />
exist without first-class editors, and only first-class editors can<br />
create a first-class academic journal. We insist on strengthening<br />
our team cultivation and construction so that every employee,<br />
in an open, fair and transparent environment, could contribute<br />
their wisdom to edit and publish high-quality articles, thereby<br />
realizing the maximization <strong>of</strong> the personal benefits <strong>of</strong> editorial<br />
board members, authors and readers, and yielding the greatest<br />
social and economic benefits.<br />
The major task <strong>of</strong> WJR is to rapidly report the most recent<br />
improvement in the research <strong>of</strong> medical imaging and radiation<br />
therapy by the radiologists. WJR accepts papers on the following<br />
aspects related to radiology: Abdominal radiology, women<br />
health radiology, cardiovascular radiology, chest radiology,<br />
genitourinary radiology, neuroradiology, head and neck<br />
radiology, interventional radiology, musculoskeletal radiology,<br />
molecular imaging, pediatric radiology, experimental radiology,<br />
radiological technology, nuclear medicine, PACS and radiology<br />
informatics, and ultrasound. We also encourage papers that<br />
cover all other areas <strong>of</strong> radiology as well as basic research.<br />
The columns in the issues <strong>of</strong> WJR will include: (1) Editorial:<br />
To introduce and comment on the substantial advance and its<br />
importance in the fast-developing areas; (2) Frontier: To review<br />
the most representative achievements and comment on the<br />
current research status in the important fields, and propose<br />
directions for the future research; (3) Topic Highlight: This<br />
column consists <strong>of</strong> three formats, including (A) 10 invited<br />
review articles on a hot topic, (B) a commentary on common<br />
issues <strong>of</strong> this hot topic, and (C) a commentary on the 10<br />
individual articles; (4) Observation: To update the development<br />
<strong>of</strong> old and new questions, highlight unsolved problems, and<br />
provide strategies on how to solve the questions; (5) Guidelines<br />
for Basic Research: To provide Guidelines for basic research;<br />
(6) Guidelines for Clinical Practice: To provide guidelines for<br />
clinical diagnosis and treatment; (7) Review: To systemically<br />
review the most representative progress and unsolved problems<br />
in the major scientific disciplines, comment on the current<br />
research status, and make suggestions on the future work; (8)<br />
Original Articles: To originally report the innovative and valuable<br />
findings in radiology; (9) Brief Articles: To briefly report the<br />
novel and innovative findings in radiology; (10) Case Report:<br />
To report a rare or typical case; (11) Letters to the Editor:<br />
To discuss and make reply to the contributions published in<br />
WJR, or to introduce and comment on a controversial issue <strong>of</strong><br />
general interest; (12) Book Reviews: To introduce and comment<br />
on quality monographs <strong>of</strong> radiology; and (13) Guidelines: To<br />
introduce Consensuses and Guidelines reached by international<br />
and national academic authorities worldwide on the research in<br />
radiology.<br />
CSSN<br />
ISSN 1949-8470 (online)<br />
Published by<br />
Beijing Baishideng BioMed Scientific Co., Ltd.<br />
TM©<br />
Baishideng WJR|www.wjgnet.com I<br />
January 28, 2010|Volume 2|Issue 1|
Instructions to authors<br />
SUBMISSION OF MANUSCRIPTS<br />
Manuscripts should be typed in 1.5 line spacing and 12 pt. Book<br />
Antiqua with ample margins. Number all pages consecutively,<br />
and start each <strong>of</strong> the following sections on a new page: Title<br />
Page, Abstract, Introduction, Materials and Methods, Results,<br />
Discussion, Acknowledgements, References, Tables, Figures,<br />
and Figure Legends. Neither the editors nor the publisher<br />
are responsible for the opinions expressed by contributors.<br />
Manuscripts formally accepted for publication become the<br />
permanent property <strong>of</strong> Beijing Baishideng BioMed Scientifc<br />
Co., Ltd., and may not be reproduced by any means, in whole or<br />
in part, without the written permission <strong>of</strong> both the authors and<br />
the publisher. We reserve the right to copy-edit and put onto<br />
our website accepted manuscripts. Authors should follow the<br />
relevant guidelines for the care and use <strong>of</strong> laboratory animals <strong>of</strong><br />
their institution or national animal welfare committee. For the<br />
sake <strong>of</strong> transparency in regard to the performance and reporting<br />
<strong>of</strong> clinical trials, we endorse the policy <strong>of</strong> the International<br />
Committee <strong>of</strong> Medical <strong>Journal</strong> Editors to refuse to publish<br />
papers on clinical trial results if the trial was not recorded in a<br />
publicly-accessible registry at its outset. The only register now<br />
available, to our knowledge, is http://www. clinicaltrials.gov<br />
sponsored by the United States National Library <strong>of</strong> Medicine<br />
and we encourage all potential contributors to register with it.<br />
However, in the case that other registers become available<br />
you will be duly notified. A letter <strong>of</strong> recommendation from<br />
each author’s organization should be provided with the contributed<br />
article to ensure the privacy and secrecy <strong>of</strong> research is<br />
protected.<br />
Authors should retain one copy <strong>of</strong> the text, tables, photographs<br />
and illustrations because rejected manuscripts will not be<br />
returned to the author(s) and the editors will not be responsible<br />
for loss or damage to photographs and illustrations sustained<br />
during mailing.<br />
Online submissions<br />
Manuscripts should be submitted through the Online<br />
Submission System at: http://www.wjgnet.com/1949-<br />
8470<strong>of</strong>fice. Authors are highly recommended to consult the<br />
ONLINE INSTRUCTIONS TO AUTHORS (http://www.<br />
wjgnet.com/1949-8470/index.htm) before attempting to<br />
submit online. For assistance, authors encountering problems<br />
with the Online Submission System may send an email<br />
describing the problem to wjr@wjgnet.com, or by telephone:<br />
+86-10-59080036. If you submit your manuscript online, do<br />
not make a postal contribution. Repeated online submission<br />
for the same manuscript is strictly prohibited.<br />
MANUSCRIPT PREPARATION<br />
All contributions should be written in English. All articles must<br />
be submitted using word-processing s<strong>of</strong>tware. All submissions<br />
must be typed in 1.5 line spacing and 12 pt. Book Antiqua with<br />
ample margins. Style should conform to our house format.<br />
Required information for each <strong>of</strong> the manuscript sections is as<br />
follows:<br />
Title page<br />
Title: Title should be less than 12 words.<br />
Running title: A short running title <strong>of</strong> less than 6 words<br />
should be provided.<br />
Authorship: Authorship credit should be in accordance with<br />
the standard proposed by International Committee <strong>of</strong> Medical<br />
百世登<br />
<strong>Journal</strong> Editors, based on (1) substantial contributions to<br />
conception and design, acquisition <strong>of</strong> data, or analysis and<br />
interpretation <strong>of</strong> data; (2) drafting the article or revising it<br />
critically for important intellectual content; and (3) final approval<br />
<strong>of</strong> the version to be published. Authors should meet conditions 1,<br />
2, and 3.<br />
Institution: Author names should be given first, then the<br />
complete name <strong>of</strong> institution, city, province and postcode.<br />
For example, Xu-Chen Zhang, Li-Xin Mei, Department <strong>of</strong><br />
Pathology, Chengde Medical College, Chengde 067000, Hebei<br />
Province, China. One author may be represented from two<br />
institutions, for example, George Sgourakis, Department <strong>of</strong><br />
General, Visceral, and Transplantation Surgery, Essen 45122,<br />
Germany; George Sgourakis, 2nd Surgical Department,<br />
Korgialenio-Benakio Red Cross Hospital, Athens 15451,<br />
Greece<br />
Author contributions: The format <strong>of</strong> this section should<br />
be: Author contributions: Wang CL and Liang L contributed<br />
equally to this work; Wang CL, Liang L, Fu JF, Zou CC, Hong<br />
F and Wu XM designed the research; Wang CL, Zou CC,<br />
Hong F and Wu XM performed the research; Xue JZ and Lu<br />
JR contributed new reagents/analytic tools; Wang CL, Liang L<br />
and Fu JF analyzed the data; and Wang CL, Liang L and Fu JF<br />
wrote the paper.<br />
Supportive foundations: The complete name and number <strong>of</strong><br />
supportive foundations should be provided, e.g., Supported by<br />
National Natural Science Foundation <strong>of</strong> China, No. 30224801<br />
Correspondence to: Only one corresponding address should<br />
be provided. Author names should be given first, then author<br />
title, affiliation, the complete name <strong>of</strong> institution, city, postcode,<br />
province, country, and email. All the letters in the email should<br />
be in lower case. A space interval should be inserted between<br />
country name and email address. For example, Montgomery<br />
Bissell, MD, Pr<strong>of</strong>essor <strong>of</strong> Medicine, Chief, Liver Center,<br />
<strong>Gastroenterology</strong> Division, University <strong>of</strong> California, Box 0538,<br />
San Francisco, CA 94143, United States. montgomery.bissell@<br />
ucsf.edu<br />
Telephone and fax: Telephone and fax should consist <strong>of</strong> +,<br />
country number, district number and telephone or fax number,<br />
e.g., Telephone: +86-10-59080039 Fax: +86-10-85381893<br />
Peer reviewers: All articles received are subject to peer review.<br />
Normally, three experts are invited for each article. Decision for<br />
acceptance is made only when at least two experts recommend<br />
an article for publication. Reviewers for accepted manuscripts<br />
are acknowledged in each manuscript, and reviewers <strong>of</strong> articles<br />
which were not accepted will be acknowledged at the end <strong>of</strong><br />
each issue. To ensure the quality <strong>of</strong> the articles published in<br />
WJR, reviewers <strong>of</strong> accepted manuscripts will be announced<br />
by publishing the name, title/position and institution <strong>of</strong> the<br />
reviewer in the footnote accompanying the printed article. For<br />
example, reviewers: Pr<strong>of</strong>essor Jing-Yuan Fang, Shanghai Institute<br />
<strong>of</strong> Digestive Disease, Shanghai, Affiliated Renji Hospital,<br />
Medical Faculty, Shanghai Jiaotong University, Shanghai, China;<br />
Pr<strong>of</strong>essor Xin-Wei Han, Department <strong>of</strong> <strong>Radiology</strong>, The First<br />
Affiliated Hospital, Zhengzhou University, Zhengzhou, Henan<br />
Province, China; and Pr<strong>of</strong>essor Anren Kuang, Department <strong>of</strong><br />
Nuclear Medicine, Huaxi Hospital, Sichuan University, Chengdu,<br />
Sichuan Province, China.<br />
TM©<br />
Baishideng WJR|www.wjgnet.com II<br />
January 28, 2010|Volume 2|Issue 1|
Abstract<br />
There are unstructured abstracts (no more than 256 words)<br />
and structured abstracts (no more than 480). The specific<br />
requirements for structured abstracts are as follows:<br />
An informative, structured abstracts <strong>of</strong> no more than<br />
480 words should accompany each manuscript. Abstracts for<br />
original contributions should be structured into the following<br />
sections. AIM (no more than 20 words): Only the purpose<br />
should be included. Please write the aim as the form <strong>of</strong> “To<br />
investigate/study/…; MATERIALS AND METHODS (no<br />
more than 140 words); RESULTS (no more than 294 words):<br />
You should present P values where appropriate and must<br />
provide relevant data to illustrate how they were obtained, e.g.<br />
6.92 ± 3.86 vs 3.61 ± 1.67, P < 0.001; CONCLUSION (no<br />
more than 26 words). Available from: http://www.wjgnet.com/<br />
wjg/help/8.doc<br />
Key words<br />
Please list 5-10 key words, selected mainly from Index Medicus,<br />
which reflect the content <strong>of</strong> the study.<br />
Text<br />
For articles <strong>of</strong> these sections, original articles, rapid communication<br />
and case reports, the main text should be structured into<br />
the following sections: INTRODUCTION, MATERIALS AND<br />
METHODS, RESULTS and DISCUSSION, and should include<br />
appropriate Figures and Tables. Data should be presented in<br />
the main text or in Figures and Tables, but not in both. The<br />
main text format <strong>of</strong> these sections, editorial, topic highlight,<br />
case report, letters to the editors, can be found at: http://www.<br />
wjgnet.com/wjg/help/instructions.jsp.<br />
Illustrations<br />
Figures should be numbered as 1, 2, 3, etc., and mentioned<br />
clearly in the main text. Provide a brief title for each<br />
figure on a separate page. Detailed legends should not be<br />
provided under the figures. This part should be added into<br />
the text where the figures are applicable. Figures should<br />
be either Photoshop or Illustrator files (in tiff, eps, jpeg<br />
formats) at high-resolution. Examples can be found at:<br />
http://www.wjgnet.com/1007-9327/13/4520.pdf; http://<br />
www.wjgnet.com/1007-9327/13/4554.pdf; http://www.<br />
wjgnet.com/1007-9327/13/4891.pdf; http://www.wjgnet.<br />
com/1007-9327/13/4986.pdf; http://www.wjgnet.<br />
com/1007-9327/13/4498.pdf. Keeping all elements compiled<br />
is necessary in line-art image. Scale bars should be used rather<br />
than magnification factors, with the length <strong>of</strong> the bar defined<br />
in the legend rather than on the bar itself. File names should<br />
identify the figure and panel. Avoid layering type directly over<br />
shaded or textured areas. Please use uniform legends for the<br />
same subjects. For example: Figure 1 Pathological changes in<br />
atrophic gastritis after treatment. A: ...; B: ...; C: ...; D: ...; E: ...;<br />
F: ...; G: …etc. It is our principle to publish high resolutionfigures<br />
for the printed and E-versions.<br />
Tables<br />
Three-line tables should be numbered 1, 2, 3, etc., and<br />
mentioned clearly in the main text. Provide a brief title for<br />
each table. Detailed legends should not be included under<br />
tables, but rather added into the text where applicable. The<br />
information should complement, but not duplicate the text.<br />
Use one horizontal line under the title, a second under column<br />
heads, and a third below the Table, above any footnotes.<br />
Vertical and italic lines should be omitted.<br />
百世登<br />
Instructions to authors<br />
Notes in tables and illustrations<br />
Data that are not statistically significant should not be noted.<br />
a P < 0.05, b P < 0.01 should be noted (P > 0.05 should not be<br />
noted). If there are other series <strong>of</strong> P values, c P < 0.05 and<br />
d P < 0.01 are used. A third series <strong>of</strong> P values can be expressed<br />
as e P < 0.05 and f P < 0.01. Other notes in tables or under<br />
illustrations should be expressed as 1 F, 2 F, 3 F; or sometimes<br />
as other symbols with a superscript (Arabic numerals) in the<br />
upper left corner. In a multi-curve illustration, each curve<br />
should be labeled with ●, ○, ■, □, ▲, △, etc., in a certain<br />
sequence.<br />
Acknowledgments<br />
Brief acknowledgments <strong>of</strong> persons who have made genuine<br />
contributions to the manuscript and who endorse the data and<br />
conclusions should be included. Authors are responsible for<br />
obtaining written permission to use any copyrighted text and/<br />
or illustrations.<br />
REFERENCES<br />
Coding system<br />
The author should number the references in Arabic numerals<br />
according to the citation order in the text. Put reference numbers<br />
in square brackets in superscript at the end <strong>of</strong> citation content<br />
or after the cited author’s name. For citation content which is<br />
part <strong>of</strong> the narration, the coding number and square brackets<br />
should be typeset normally. For example, “Crohn’s disease<br />
(CD) is associated with increased intestinal permeability [1,2] ”.<br />
If references are cited directly in the text, they should be put<br />
together within the text, for example, “From references [19,22-24] ,<br />
we know that...”<br />
When the authors write the references, please ensure that<br />
the order in text is the same as in the references section, and<br />
also ensure the spelling accuracy <strong>of</strong> the first author’s name. Do<br />
not list the same citation twice.<br />
PMID and DOI<br />
Pleased provide PubMed citation numbers to the reference<br />
list, e.g. PMID and DOI, which can be found at http://www.<br />
ncbi.nlm.nih.gov/sites/entrez?db=pubmed and http://www.<br />
crossref.org/SimpleTextQuery/, respectively. The numbers<br />
will be used in E-version <strong>of</strong> this journal.<br />
Style for journal references<br />
Authors: the name <strong>of</strong> the first author should be typed in boldfaced<br />
letters. The family name <strong>of</strong> all authors should be typed<br />
with the initial letter capitalized, followed by their abbreviated<br />
first and middle initials. (For example, Lian-Sheng Ma is<br />
abbreviated as Ma LS, Bo-Rong Pan as Pan BR). The title <strong>of</strong><br />
the cited article and italicized journal title (journal title should<br />
be in its abbreviated form as shown in PubMed), publication<br />
date, volume number (in black), start page, and end page<br />
[PMID: 11819634 DOI: 10.3748/wjg.13.5396].<br />
Style for book references<br />
Authors: the name <strong>of</strong> the first author should be typed in boldfaced<br />
letters. The surname <strong>of</strong> all authors should be typed<br />
with the initial letter capitalized, followed by their abbreviated<br />
middle and first initials. (For example, Lian-Sheng Ma is<br />
abbreviated as Ma LS, Bo-Rong Pan as Pan BR) Book title.<br />
Publication number. Publication place: Publication press, Year:<br />
start page and end page.<br />
TM©<br />
Baishideng WJR|www.wjgnet.com III<br />
January 28, 2010|Volume 2|Issue 1|
Instructions to authors<br />
Format<br />
<strong>Journal</strong>s<br />
English journal article (list all authors and include the PMID where<br />
applicable)<br />
1 Jung EM, Clevert DA, Schreyer AG, Schmitt S, Rennert J,<br />
Kubale R, Feuerbach S, Jung F. Evaluation <strong>of</strong> quantitative<br />
contrast harmonic imaging to assess malignancy <strong>of</strong> liver<br />
tumors: A prospective controlled two-center study. <strong>World</strong> J<br />
Gastroenterol 2007; 13: 6356-6364 [PMID: 18081224 DOI:<br />
10.3748/wjg.13.6356]<br />
Chinese journal article (list all authors and include the PMID where<br />
applicable)<br />
2 Lin GZ, Wang XZ, Wang P, Lin J, Yang FD. Immunologic<br />
effect <strong>of</strong> Jianpi Yishen decoction in treatment <strong>of</strong> Pixudiarrhoea.<br />
Shijie Huaren Xiaohua Zazhi 1999; 7: 285-287<br />
In press<br />
3 Tian D, Araki H, Stahl E, Bergelson J, Kreitman M.<br />
Signature <strong>of</strong> balancing selection in Arabidopsis. Proc Natl<br />
Acad Sci USA 2006; In press<br />
Organization as author<br />
4 Diabetes Prevention Program Research Group. Hypertension,<br />
insulin, and proinsulin in participants with<br />
impaired glucose tolerance. Hypertension 2002; 40: 679-686<br />
[PMID: 12411462 PMCID:2516377 DOI:10.1161/01.<br />
HYP.0000035706.28494.09]<br />
Both personal authors and an organization as author<br />
5 Vallancien G, Emberton M, Harving N, van Moorselaar<br />
RJ; Alf-One Study Group. Sexual dysfunction in 1,<br />
274 European men suffering from lower urinary tract<br />
symptoms. J Urol 2003; 169: 2257-2261 [PMID: 12771764<br />
DOI:10.1097/01.ju.0000067940.76090.73]<br />
No author given<br />
6 21st century heart solution may have a sting in the tail.<br />
BMJ 2002; 325: 184 [PMID: 12142303 DOI:10.1136/<br />
bmj.325.7357.184]<br />
Volume with supplement<br />
7 Geraud G, Spierings EL, Keywood C. Tolerability<br />
and safety <strong>of</strong> frovatriptan with short- and long-term<br />
use for treatment <strong>of</strong> migraine and in comparison with<br />
sumatriptan. Headache 2002; 42 Suppl 2: S93-99 [PMID:<br />
12028325 DOI:10.1046/j.1526-4610.42.s2.7.x]<br />
Issue with no volume<br />
8 Banit DM, Kaufer H, Hartford JM. Intraoperative frozen<br />
section analysis in revision total joint arthroplasty. Clin<br />
Orthop Relat Res 2002; (401): 230-238 [PMID: 12151900<br />
DOI:10.1097/00003086-200208000-00026]<br />
No volume or issue<br />
9 Outreach: Bringing HIV-positive individuals into care.<br />
HRSA Careaction 2002; 1-6 [PMID: 12154804]<br />
Books<br />
Personal author(s)<br />
10 Sherlock S, Dooley J. Diseases <strong>of</strong> the liver and billiary<br />
system. 9th ed. Oxford: Blackwell Sci Pub, 1993: 258-296<br />
Chapter in a book (list all authors)<br />
11 Lam SK. Academic investigator’s perspectives <strong>of</strong> medical<br />
treatment for peptic ulcer. In: Swabb EA, Azabo S. Ulcer<br />
disease: investigation and basis for therapy. New York:<br />
Marcel Dekker, 1991: 431-450<br />
Author(s) and editor(s)<br />
12 Breedlove GK, Schorfheide AM. Adolescent pregnancy.<br />
2nd ed. Wieczorek RR, editor. White Plains (NY): March<br />
<strong>of</strong> Dimes Education Services, 2001: 20-34<br />
百世登<br />
Conference proceedings<br />
13 Harnden P, J<strong>of</strong>fe JK, Jones WG, editors. Germ cell<br />
tumours V. Proceedings <strong>of</strong> the 5th Germ cell tumours<br />
Conference; 2001 Sep 13-15; Leeds, UK. New York:<br />
Springer, 2002: 30-56<br />
Conference paper<br />
14 Christensen S, Oppacher F. An analysis <strong>of</strong> Koza's computational<br />
effort statistic for genetic programming. In:<br />
Foster JA, Lutton E, Miller J, Ryan C, Tettamanzi AG,<br />
editors. Genetic programming. EuroGP 2002: Proceedings<br />
<strong>of</strong> the 5th European Conference on Genetic Programming;<br />
2002 Apr 3-5; Kinsdale, Ireland. Berlin: Springer, 2002:<br />
182-191<br />
Electronic journal (list all authors)<br />
15 Morse SS. Factors in the emergence <strong>of</strong> infectious<br />
diseases. Emerg Infect Dis serial online, 1995-01-03, cited<br />
1996-06-05; 1(1): 24 screens. Available from: URL: http//<br />
www.cdc.gov/ncidod/EID/eid.htm<br />
Patent (list all authors)<br />
16 Pagedas AC, inventor; Ancel Surgical R&D Inc.,<br />
assignee. Flexible endoscopic grasping and cutting device<br />
and positioning tool assembly. United States patent US<br />
20020103498. 2002 Aug 1<br />
Statistical data<br />
Write as mean ± SD or mean ± SE.<br />
Statistical expression<br />
Express t test as t (in italics), F test as F (in italics), chi square<br />
test as χ 2 (in Greek), related coefficient as r (in italics), degree<br />
<strong>of</strong> freedom as υ (in Greek), sample number as n (in italics),<br />
and probability as P (in italics).<br />
Units<br />
Use SI units. For example: body mass, m (B) = 78 kg; blood<br />
pressure, p (B) = 16.2/12.3 kPa; incubation time, t (incubation)<br />
= 96 h, blood glucose concentration, c (glucose) 6.4 ± 2.1<br />
mmol/L; blood CEA mass concentration, p (CEA) = 8.6<br />
24.5 mg/L; CO 2 volume fraction, 50 mL/L CO 2, not 5% CO 2;<br />
likewise for 40 g/L formaldehyde, not 10% formalin; and<br />
mass fraction, 8 ng/g, etc. Arabic numerals such as 23, 243, 641<br />
should be read 23 243 641.<br />
The format for how to accurately write common units and<br />
quantums can be found at: http://www.wjgnet.com/wjg/<br />
help/15.doc.<br />
Abbreviations<br />
Standard abbreviations should be defined in the abstract<br />
and on first mention in the text. In general, terms should<br />
not be abbreviated unless they are used repeatedly and the<br />
abbreviation is helpful to the reader. Permissible abbreviations<br />
are listed in Units, Symbols and Abbreviations: A Guide for<br />
Biological and Medical Editors and Authors (Ed. Baron DN,<br />
1988) published by The Royal Society <strong>of</strong> Medicine, London.<br />
Certain commonly used abbreviations, such as DNA, RNA,<br />
HIV, LD50, PCR, HBV, ECG, WBC, RBC, CT, ESR, CSF,<br />
IgG, ELISA, PBS, ATP, EDTA, mAb, can be used directly<br />
without further explanation.<br />
Italics<br />
Quantities: t time or temperature, c concentration, A area, l<br />
length, m mass, V volume.<br />
Genotypes: gyrA, arg 1, c myc, c fos, etc.<br />
TM©<br />
Baishideng WJR|www.wjgnet.com IV<br />
January 28, 2010|Volume 2|Issue 1|
Restriction enzymes: EcoRI, HindI, BamHI, Kbo I, Kpn I, etc.<br />
Biology: H. pylori, E coli, etc.<br />
RE-SUBMISSION OF THE REVISED PAPER<br />
Please revise your article according to the revision policies<br />
<strong>of</strong> WJR. The revised version including manuscript and highresolution<br />
image figures (if any) should be re-submitted or<br />
uploaded online. The author should send copyright transfer<br />
letter, and responses to the reviewers and science news to us<br />
via email.<br />
Editorial Office<br />
<strong>World</strong> <strong>Journal</strong> <strong>of</strong> <strong>Radiology</strong><br />
Editorial Department: Room 903, Building D,<br />
Ocean International Center,<br />
No. 62 Dongsihuan Zhonglu,<br />
Chaoyang District, Beijing 100025, China<br />
E-mail: wjr@wjgnet.com<br />
http://www.wjgnet.com<br />
Telephone: +86-10-59080036<br />
Fax: +86-10-85381893<br />
Language evaluation<br />
The language <strong>of</strong> a manuscript will be graded before it is<br />
sent for revision. (1) Grade A: priority publishing; (2) Grade<br />
B: minor language polishing; (3) Grade C: a great deal <strong>of</strong><br />
language polishing needed; and (4) Grade D: rejected. Revised<br />
articles should reach Grade A or B.<br />
百世登<br />
TM©<br />
Baishideng WJR|www.wjgnet.com<br />
V<br />
Instructions to authors<br />
Copyright assignment form<br />
Please download a Copyright assignment form from http://<br />
www.wjgnet.com/1007-9327/news/10.doc.<br />
Responses to reviewers<br />
Please revise your article according to the comments/suggestions<br />
provided by the reviewers. The format for responses to<br />
the reviewers’ comments can be found at: http://www.wjgnet.<br />
com/1007-9327/news/12.doc.<br />
Pro<strong>of</strong> <strong>of</strong> financial support<br />
For paper supported by a foundation, authors should provide<br />
a copy <strong>of</strong> the document and serial number <strong>of</strong> the foundation.<br />
Science news releases<br />
Authors <strong>of</strong> accepted manuscripts are suggested to write a<br />
science news item to promote their articles. The news will be<br />
released rapidly at EurekAlert/AAAS (http://www.eurekalert.<br />
org). The title for news items should be less than 90 characters;<br />
the summary should be less than 75 words; and main body less<br />
than 500 words. Science news items should be lawful, ethical,<br />
and strictly based on your original content with an attractive<br />
title and interesting pictures.<br />
Publication fee<br />
Authors <strong>of</strong> accepted articles must pay a publication fee.<br />
EDITORIAL, TOPIC HIGHLIGHTS, BOOK REVIEWS<br />
and LETTERS TO THE EDITOR are published free <strong>of</strong><br />
charge.<br />
January 28, 2010|Volume 2|Issue 1|


