

World Journal of Radiology - World Journal of Gastroenterology
World Journal of Radiology - World Journal of Gastroenterology
World Journal of Radiology - World Journal of Gastroenterology

Create successful ePaper yourself
Turn your PDF publications into a flip-book with our unique Google optimized e-Paper software.
A<br />
C<br />
Wang YXJ et al . MRI assessment <strong>of</strong> the articular cartilage<br />
volume. CV% <strong>of</strong> cartilage volume in the medial tibia in<br />
healthy volunteers has been reported to be in the range<br />
<strong>of</strong> 2%-3.5%. Precision errors for cartilage volume across<br />
studies at 1.5T for each cartilage component have been<br />
recently summarized [8] . Several studies examined the<br />
inter-observer and intra-observer precision <strong>of</strong> repeated<br />
analyses. It has been confirmed that segmenting all images<br />
in a subject’s series by the same skilled reader is<br />
more accurate than segmenting by different readers. To<br />
alleviate reader bias, the results <strong>of</strong> several readers can be<br />
averaged. Re-segmentation <strong>of</strong> the same data sets over a<br />
period <strong>of</strong> 1 year by the same user involved larger errors<br />
than those involved by segmentation <strong>of</strong> different data<br />
sets immediately after each other [46] . Therefore, to ensure<br />
the smallest coefficient <strong>of</strong> variation, in longitudinal studies<br />
comparative analyses should be performed in one<br />
post-processing session. Blinding the user to the order<br />
<strong>of</strong> the exams is necessary in order to avoid bias.<br />
Cartilage volume provides a first step in the analysis<br />
<strong>of</strong> cartilage morphology. More comprehensive information<br />
can be derived from separating the cartilage volume<br />
into its two factors, namely the cartilage thickness and<br />
the size <strong>of</strong> the joint surface area. Specific algorithms are<br />
required to differentiate between these factors. Other<br />
variables such as percent cartilaginous (or denuded)<br />
joint surface area, cartilage surface curvature, lesion size<br />
and depth can also be investigated. As overall volume<br />
and mean thickness for an entire cartilage plate may be<br />
relatively insensitive to regional/focal changes, several<br />
investigators developed techniques for displaying regional<br />
thickness patterns. Measuring cartilage volume in<br />
regions <strong>of</strong> the knee (e.g. medial tibia) and regional mean<br />
thickness as distinct from focal measures <strong>of</strong> change (re-<br />
WJR|www.wjgnet.com<br />
B<br />
D<br />
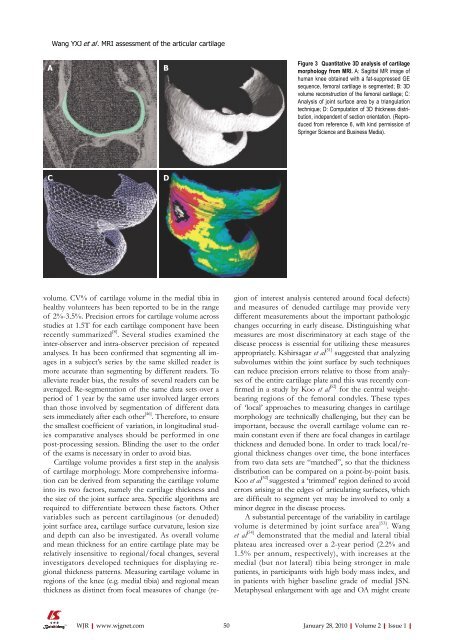
Figure 3 Quantitative 3D analysis <strong>of</strong> cartilage<br />
morphology from MRI. A: Sagittal MR image <strong>of</strong><br />
human knee obtained with a fat-suppressed GE<br />
sequence, femoral cartilage is segmented; B: 3D<br />
volume reconstruction <strong>of</strong> the femoral cartilage; C:<br />
Analysis <strong>of</strong> joint surface area by a triangulation<br />
technique; D: Computation <strong>of</strong> 3D thickness distribution,<br />
independent <strong>of</strong> section orientation. (Reproduced<br />
from reference 6, with kind permission <strong>of</strong><br />
Springer Science and Business Media).<br />
gion <strong>of</strong> interest analysis centered around focal defects)<br />
and measures <strong>of</strong> denuded cartilage may provide very<br />
different measurements about the important pathologic<br />
changes occurring in early disease. Distinguishing what<br />
measures are most discriminatory at each stage <strong>of</strong> the<br />
disease process is essential for utilizing these measures<br />
appropriately. Kshirsagar et al [51] suggested that analyzing<br />
subvolumes within the joint surface by such techniques<br />
can reduce precision errors relative to those from analyses<br />
<strong>of</strong> the entire cartilage plate and this was recently confirmed<br />
in a study by Koo et al [52] for the central weightbearing<br />
regions <strong>of</strong> the femoral condyles. These types<br />
<strong>of</strong> ‘local’ approaches to measuring changes in cartilage<br />
morphology are technically challenging, but they can be<br />
important, because the overall cartilage volume can remain<br />
constant even if there are focal changes in cartilage<br />
thickness and denuded bone. In order to track local/regional<br />
thickness changes over time, the bone interfaces<br />
from two data sets are “matched”, so that the thickness<br />
distribution can be compared on a point-by-point basis.<br />
Koo et al [52] suggested a ‘trimmed’ region defined to avoid<br />
errors arising at the edges <strong>of</strong> articulating surfaces, which<br />
are difficult to segment yet may be involved to only a<br />
minor degree in the disease process.<br />
A substantial percentage <strong>of</strong> the variability in cartilage<br />
volume is determined by joint surface area [53] . Wang<br />
et al [54] demonstrated that the medial and lateral tibial<br />
plateau area increased over a 2-year period (2.2% and<br />
1.5% per annum, respectively), with increases at the<br />
medial (but not lateral) tibia being stronger in male<br />
patients, in participants with high body mass index, and<br />
in patients with higher baseline grade <strong>of</strong> medial JSN.<br />
Metaphyseal enlargement with age and OA might create<br />
50 January 28, 2010|Volume 2|Issue 1|


