CLEA: Transits of Venus and Mercury
CLEA: Transits of Venus and Mercury
CLEA: Transits of Venus and Mercury

Create successful ePaper yourself
Turn your PDF publications into a flip-book with our unique Google optimized e-Paper software.
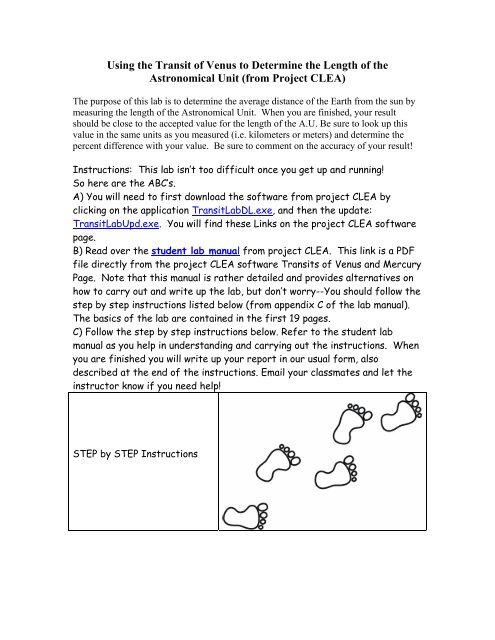
Using the Transit <strong>of</strong> <strong>Venus</strong> to Determine the Length <strong>of</strong> theAstronomical Unit (from Project <strong>CLEA</strong>)The purpose <strong>of</strong> this lab is to determine the average distance <strong>of</strong> the Earth from the sun bymeasuring the length <strong>of</strong> the Astronomical Unit. When you are finished, your resultshould be close to the accepted value for the length <strong>of</strong> the A.U. Be sure to look up thisvalue in the same units as you measured (i.e. kilometers or meters) <strong>and</strong> determine thepercent difference with your value. Be sure to comment on the accuracy <strong>of</strong> your result!Instructions: This lab isn’t too difficult once you get up <strong>and</strong> running!So here are the ABC’s.A) You will need to first download the s<strong>of</strong>tware from project <strong>CLEA</strong> byclicking on the application TransitLabDL.exe, <strong>and</strong> then the update:TransitLabUpd.exe. You will find these Links on the project <strong>CLEA</strong> s<strong>of</strong>twarepage.B) Read over the student lab manual from project <strong>CLEA</strong>. This link is a PDFfile directly from the project <strong>CLEA</strong> s<strong>of</strong>tware <strong>Transits</strong> <strong>of</strong> <strong>Venus</strong> <strong>and</strong> <strong>Mercury</strong>Page. Note that this manual is rather detailed <strong>and</strong> provides alternatives onhow to carry out <strong>and</strong> write up the lab, but don’t worry--You should follow thestep by step instructions listed below (from appendix C <strong>of</strong> the lab manual).The basics <strong>of</strong> the lab are contained in the first 19 pages.C) Follow the step by step instructions below. Refer to the student labmanual as you help in underst<strong>and</strong>ing <strong>and</strong> carrying out the instructions. Whenyou are finished you will write up your report in our usual form, alsodescribed at the end <strong>of</strong> the instructions. Email your classmates <strong>and</strong> let theinstructor know if you need help!STEP by STEP Instructions
<strong>Transits</strong> <strong>of</strong> <strong>Venus</strong> <strong>and</strong> <strong>Mercury</strong> 21) Run the <strong>CLEA</strong> <strong>Transits</strong> <strong>of</strong> <strong>Venus</strong> <strong>and</strong> <strong>Mercury</strong> s<strong>of</strong>tware. Log in. Choose File---Run---2004 <strong>Venus</strong> Transit <strong>and</strong> the main data window will appear.2) Choose File---Image Database---Image Directory---Load , <strong>and</strong> you will see a list <strong>of</strong>the three GONG observatories that took images <strong>of</strong> the Transit. We will measure the datafrom each <strong>of</strong> these, but let’s choose the data from Learmonth first. Double click on theentry for this observatory, <strong>and</strong> a list <strong>of</strong> all the images from this site will be loaded intothe Image Database Directory column <strong>of</strong> the main data window Scroll down the windowto see what times are available.All the images were taken between these times on June 8, 2005:Site: LEARMONTH , Images between _______ <strong>and</strong> ______UT.4) Select all the images by right-clicking on the Database Directory <strong>and</strong> choosing SelectAll. Load all these images into the computer by right clicking again <strong>and</strong> choosing LoadSelected Images. An image window will open showing each image as it’s loaded in.When all the images have loaded you can, if you want, see an animation <strong>of</strong> the series <strong>of</strong>images, showing the planet <strong>Venus</strong> moving across the sun, by using the Animation---Onmenu on the image window. Animation---Off will stop the animation. The animation canbe speeded up by changing the Animation---Set Rate menu item.5) You will now measure the position <strong>of</strong> <strong>Venus</strong> on each image. To see the first image inthe series, make sure the animation is not running (see above), <strong>and</strong> then go to the top <strong>of</strong>the Loaded Image List, the right column <strong>of</strong> the main screen, <strong>and</strong> right click on it. <strong>Venus</strong>may not appear on the first few images, so go down through the list until you find thefirst images where <strong>Venus</strong> begins to poke on to the edge <strong>of</strong> the sun. Continue down the listuntil you find the image where the complete silhouette <strong>of</strong> <strong>Venus</strong> can be seen. This is thefirst one you will measure. Record the time that this image was taken at.First measureable image from LEARMONTH was taken at ______________UT6) Next you will begin to measure the positions <strong>of</strong> <strong>Venus</strong> on the images. Simply positionyour cursor over the silhouette <strong>of</strong> <strong>Venus</strong> <strong>and</strong> right double click. A window opensshowing a magnified image <strong>of</strong> <strong>Venus</strong>, <strong>and</strong> it will automatically center on the planet.Another window opens at the top to show the x <strong>and</strong> y coordinates <strong>of</strong> the center in unitsboth <strong>of</strong> pixels <strong>and</strong> <strong>of</strong> fractions <strong>of</strong> a solar radius. A “measurement data” window willopen at the bottom <strong>of</strong> the screen, showing the same coordinates, time, <strong>and</strong> information onthe observing site. Very important: Click the “record” button to add this data to the list<strong>of</strong> measurements the computer is keeping for you. If you don’t do this, you will not beable to analyze or print out your measurements later.7) Continue on in this fashion through each image taken from Learmonth until all themeasurements have been recorded. The s<strong>of</strong>tware keeps track <strong>of</strong> which images you havemeasured, <strong>and</strong> won’t let you record twice (it “grays” out the record button on previouslymeasured images <strong>and</strong> turns the box around the planet from red to green) so don’t worryabout measuring the same image twice. If you measure one incorrectly or leave one out,don’t worry. Data can be deleted later, <strong>and</strong> one or two missing image measurementswon’t affect your final result.
<strong>Transits</strong> <strong>of</strong> <strong>Venus</strong> <strong>and</strong> <strong>Mercury</strong> 38) When you have finished measuring <strong>and</strong> recording all the positions from the Learmonthimages, save your data. To do this, go back to the main screen, choose the File---Measurement Data---Save Data option, give your file a distinctive name (such as yourinitals or last name), <strong>and</strong> save it. Record the name hereName <strong>of</strong> Data file ______________________________.9) If you want, you can view the data you’ve recorded already by choosing (from themain window) File---Measurement Data---View/Edit, which will show you a textwindow with what you’ve recorded so far (you will later print this out, when all the datais taken). You can also view a graph <strong>of</strong> your data against a circle representing the sun bychoosing Analysis---Plot/Fit Data. The graphical window that appears will later beused, when you have all your data, for determining the parallax <strong>of</strong> <strong>Venus</strong>. Close thesewindows before proceeding.10) Now proceed, following the steps 2-7 above, to load in the images from the nextGONG site, Udaipur, measure <strong>and</strong> record the positions <strong>of</strong> <strong>Venus</strong> on each <strong>of</strong> them, <strong>and</strong>save the results (they all go on to the same data file; you don’t have to change thename).11) When you have finished measuring the images from Udaipur, do the same for theimages from El Teide. Note that the last few images from this site will not show completesilhouettes <strong>of</strong> <strong>Venus</strong>, so you shouldn’t measure them. Again, Don’t forget to save thedata!12) When you have collected all the data, you will next want to print the measurementsyou have made, just for the record. From the main menu choose File---MeasurementData---View/Edit <strong>and</strong> a window will open with the list <strong>of</strong> your <strong>Venus</strong> transitmeasurements. Choose List----Print on this window, <strong>and</strong> the list <strong>of</strong> your measurementswill print out. Close the window when you’re done.13) You now want to view <strong>and</strong> analyze the three tracks. To do this, from the main menuchoose the Analysis---Plot/Fit Data <strong>and</strong> you should see the three tracks plotted against acircle representing the sun. Note that they are very close together. The parallax <strong>of</strong> <strong>Venus</strong>is quite small. But you can view it in more detail by choosing View---Detail from the plotwindow menu. Note that the three tracks are now well separated. The circles representthe measurements you have recorded. You will want to print out this window, using theView---Print Window menu choice. In the space provided on the next page, explain whythese three tracks are in the order you see them: Why is the Learmonth track at the top,<strong>and</strong> the El Teide track at the bottom? ( a diagram may help).Answer here:
<strong>Transits</strong> <strong>of</strong> <strong>Venus</strong> <strong>and</strong> <strong>Mercury</strong> 414) The points you have measured should appear to be connected by straight lines, whichgives a jagged appearance to the tracks. Next we need to fit a single line to each track,smoothing out experimental imprecisions. Choose the Data---Curve Fit---Quadraticmenu option, <strong>and</strong> you will see single slightly curved lines fit to the data.15) The shift, or parallax <strong>of</strong> <strong>Venus</strong>, π m , between any two tracks is what we use todetermine the length <strong>of</strong> the Astronomical Unit. It can be measured at any time during thetransit, but we will want to measure all three shifts between the three combinations <strong>of</strong> thethree sites (Udaipur vs El Teide, Udaipur vs Learmonth, <strong>and</strong> Learmonth vs El Teide), sowe need to choose a time when the transit is visible from all three sites. To do this,choose Data----Select Observation Time <strong>and</strong> a slider will appear below the plot. If youslide it back <strong>and</strong> forth, you will see three circles appear on the tracks that represent thepositions <strong>of</strong> <strong>Venus</strong> as seen from the three sites at the time set on the slider. Find a timewhen the transit is visible from all three sites. Click OK to set that time into thecomputer. A small window opens at the top <strong>of</strong> the page recording the time <strong>and</strong> theparallaxes as seen between the three pairs <strong>of</strong> sites the units <strong>of</strong> parallax will be in fractions<strong>of</strong> a solar radius, <strong>and</strong> will later have to be converted into arc seconds. Record that data onthe table below:OBSERVATION TIME (UT):SiteParallax (Solar Radii)Parallax <strong>of</strong> El Teide-Udaipur (solar radii)Parallax <strong>of</strong> El Teide-Learmonth (solar radii)Parallax <strong>of</strong> Udaipur-Learmonth (solar radii)16) We need additional information to use in the formula on page 12 for the length <strong>of</strong> theAstronomical Unit: the “projected baseline” between any two sites, the distance to thesun <strong>and</strong> <strong>Venus</strong> in Astronomical Units, <strong>and</strong> the angular size <strong>of</strong> the sun (to convert theparallaxes to arc seconds.The computer calculates this information once the observing time is selected.Simply choose Data---Sun, Planet, Baseline Data from the plot display window, <strong>and</strong>another window will open up with all this data. Choose List---Print on this window toprint out the data. You should now be able to use the data from that table (not all thedata it prints out is needed), to fill in the table on the next page, which is what you willneed to calculate the Astronomical Unit using the formula from page 12A= B • (D es - D ev ) • 206265π m • D ev • D esCAUTION: Be sure your units are correct before you plug into this formula. B is in km,D ev <strong>and</strong> D es are both in AU, <strong>and</strong> π m is in seconds <strong>of</strong> arc!DATA TABLE FOR CALCULATING THE LENGTH OF THEASTRONOMICAL UNITDATE AND TIME OF OBSERVATION (UT)DISTANCE OF SUN, D es (A.U.)
<strong>Transits</strong> <strong>of</strong> <strong>Venus</strong> <strong>and</strong> <strong>Mercury</strong> 5DISTANCE OF VENUS, D ev (A.U.)Apparent Diameter <strong>of</strong>Sun (arc seconds)Apparent Radius <strong>of</strong> Sun(arc seconds)=Diameter/2El Teide-Udaipur El Teide-Learmonth Udaipur-LearmonthProjected Baseline (km) Projected Baseline (km) Projected Baseline (km)Measured Parallax π m(arcseconds)Measured Parallax π m(arcseconds)Measured Parallax π m(arcseconds)17) Now use the data from the table above to calculate the length <strong>of</strong> the AstronomicalUnit using the parallax from each <strong>of</strong> the three pairs <strong>of</strong> observing sites <strong>and</strong> the formulafrom page 12. Also calculate the average value <strong>and</strong> enter it in the table below.THE LENGTH OF THE ASTRONOMICAL UNIT DETERMINED FROMTRANSIT OBSERVATIONS (km)El Teide-UdaipurEl Teide-LearmonthUdaipur-LearmonthAVERAGE FROM THREE SITESQUESTIONS TO CONSIDER:1) What is the percentage difference between your answer <strong>and</strong> the currently acceptedvalue <strong>of</strong> the Astronomical Unit?2) <strong>Transits</strong> <strong>of</strong> <strong>Mercury</strong> occur more frequently than <strong>Transits</strong> <strong>of</strong> <strong>Venus</strong>. How do you thinka transit <strong>of</strong> <strong>Mercury</strong> might appear different? Why weren’t transits <strong>of</strong> <strong>Mercury</strong> used todetermine the length <strong>of</strong> the AU? Why might it be harder to get a good value fromobservations <strong>of</strong> the <strong>Transits</strong> <strong>of</strong> <strong>Mercury</strong>?Format for writing up report:The report should describe what you did, what you recorded, how you analyzed the data,<strong>and</strong> what you concluded. Be brief---you don’t need to write down every mouse click youmade. But be clear, so that if someone unfamiliar with the experiment were to read it, thatperson could underst<strong>and</strong> just what you did <strong>and</strong> why. Include the following sections:• Introduction describing the background <strong>and</strong> motivation for the work.• Data <strong>and</strong> basic measurements, including, if applicableo A sample image.o Printout <strong>of</strong> data tables
<strong>Transits</strong> <strong>of</strong> <strong>Venus</strong> <strong>and</strong> <strong>Mercury</strong> 6o A brief description <strong>of</strong> what measurements you made <strong>and</strong> how you madethem.• Plots <strong>and</strong> analysiso Any graphs you used.o Description <strong>of</strong> the method used to turn the raw data (e.g. <strong>Venus</strong>positions) into desired results; Describe the logic <strong>of</strong> the method <strong>and</strong> showthe formulas used in any calculations.o Tables <strong>of</strong> calculated data if more than one number was calculated, or ifseveral numbers were averaged together.• Answers to questions from the step by step instructions• Summary <strong>and</strong> conclusions: State what you did <strong>and</strong> what the important resultswere. What is the percent difference between your calculated values <strong>and</strong> theaccepted values? What were the source <strong>of</strong> any discrepancies between yourvalue(s) <strong>and</strong> the accepted value(s)?