<strong>Transits</strong> <strong>of</strong> <strong>Venus</strong> <strong>and</strong> <strong>Mercury</strong> 414) The points you have measured should appear to be connected by straight lines, whichgives a jagged appearance to the tracks. Next we need to fit a single line to each track,smoothing out experimental imprecisions. Choose the Data---Curve Fit---Quadraticmenu option, <strong>and</strong> you will see single slightly curved lines fit to the data.15) The shift, or parallax <strong>of</strong> <strong>Venus</strong>, π m , between any two tracks is what we use todetermine the length <strong>of</strong> the Astronomical Unit. It can be measured at any time during thetransit, but we will want to measure all three shifts between the three combinations <strong>of</strong> thethree sites (Udaipur vs El Teide, Udaipur vs Learmonth, <strong>and</strong> Learmonth vs El Teide), sowe need to choose a time when the transit is visible from all three sites. To do this,choose Data----Select Observation Time <strong>and</strong> a slider will appear below the plot. If youslide it back <strong>and</strong> forth, you will see three circles appear on the tracks that represent thepositions <strong>of</strong> <strong>Venus</strong> as seen from the three sites at the time set on the slider. Find a timewhen the transit is visible from all three sites. Click OK to set that time into thecomputer. A small window opens at the top <strong>of</strong> the page recording the time <strong>and</strong> theparallaxes as seen between the three pairs <strong>of</strong> sites the units <strong>of</strong> parallax will be in fractions<strong>of</strong> a solar radius, <strong>and</strong> will later have to be converted into arc seconds. Record that data onthe table below:OBSERVATION TIME (UT):SiteParallax (Solar Radii)Parallax <strong>of</strong> El Teide-Udaipur (solar radii)Parallax <strong>of</strong> El Teide-Learmonth (solar radii)Parallax <strong>of</strong> Udaipur-Learmonth (solar radii)16) We need additional information to use in the formula on page 12 for the length <strong>of</strong> theAstronomical Unit: the “projected baseline” between any two sites, the distance to thesun <strong>and</strong> <strong>Venus</strong> in Astronomical Units, <strong>and</strong> the angular size <strong>of</strong> the sun (to convert theparallaxes to arc seconds.The computer calculates this information once the observing time is selected.Simply choose Data---Sun, Planet, Baseline Data from the plot display window, <strong>and</strong>another window will open up with all this data. Choose List---Print on this window toprint out the data. You should now be able to use the data from that table (not all thedata it prints out is needed), to fill in the table on the next page, which is what you willneed to calculate the Astronomical Unit using the formula from page 12A= B • (D es - D ev ) • 206265π m • D ev • D esCAUTION: Be sure your units are correct before you plug into this formula. B is in km,D ev <strong>and</strong> D es are both in AU, <strong>and</strong> π m is in seconds <strong>of</strong> arc!DATA TABLE FOR CALCULATING THE LENGTH OF THEASTRONOMICAL UNITDATE AND TIME OF OBSERVATION (UT)DISTANCE OF SUN, D es (A.U.)
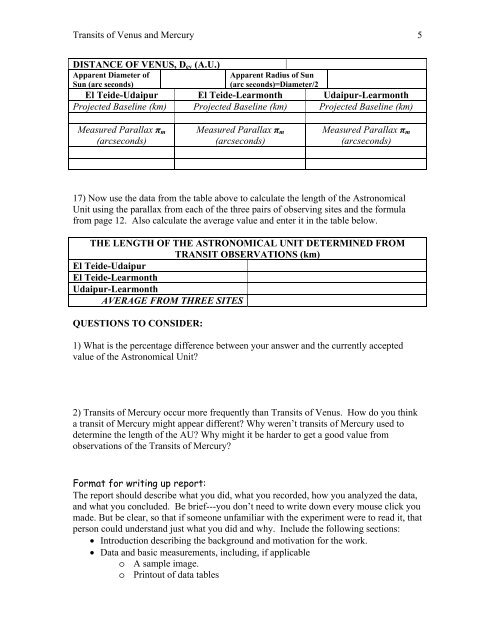
<strong>Transits</strong> <strong>of</strong> <strong>Venus</strong> <strong>and</strong> <strong>Mercury</strong> 5DISTANCE OF VENUS, D ev (A.U.)Apparent Diameter <strong>of</strong>Sun (arc seconds)Apparent Radius <strong>of</strong> Sun(arc seconds)=Diameter/2El Teide-Udaipur El Teide-Learmonth Udaipur-LearmonthProjected Baseline (km) Projected Baseline (km) Projected Baseline (km)Measured Parallax π m(arcseconds)Measured Parallax π m(arcseconds)Measured Parallax π m(arcseconds)17) Now use the data from the table above to calculate the length <strong>of</strong> the AstronomicalUnit using the parallax from each <strong>of</strong> the three pairs <strong>of</strong> observing sites <strong>and</strong> the formulafrom page 12. Also calculate the average value <strong>and</strong> enter it in the table below.THE LENGTH OF THE ASTRONOMICAL UNIT DETERMINED FROMTRANSIT OBSERVATIONS (km)El Teide-UdaipurEl Teide-LearmonthUdaipur-LearmonthAVERAGE FROM THREE SITESQUESTIONS TO CONSIDER:1) What is the percentage difference between your answer <strong>and</strong> the currently acceptedvalue <strong>of</strong> the Astronomical Unit?2) <strong>Transits</strong> <strong>of</strong> <strong>Mercury</strong> occur more frequently than <strong>Transits</strong> <strong>of</strong> <strong>Venus</strong>. How do you thinka transit <strong>of</strong> <strong>Mercury</strong> might appear different? Why weren’t transits <strong>of</strong> <strong>Mercury</strong> used todetermine the length <strong>of</strong> the AU? Why might it be harder to get a good value fromobservations <strong>of</strong> the <strong>Transits</strong> <strong>of</strong> <strong>Mercury</strong>?Format for writing up report:The report should describe what you did, what you recorded, how you analyzed the data,<strong>and</strong> what you concluded. Be brief---you don’t need to write down every mouse click youmade. But be clear, so that if someone unfamiliar with the experiment were to read it, thatperson could underst<strong>and</strong> just what you did <strong>and</strong> why. Include the following sections:• Introduction describing the background <strong>and</strong> motivation for the work.• Data <strong>and</strong> basic measurements, including, if applicableo A sample image.o Printout <strong>of</strong> data tables