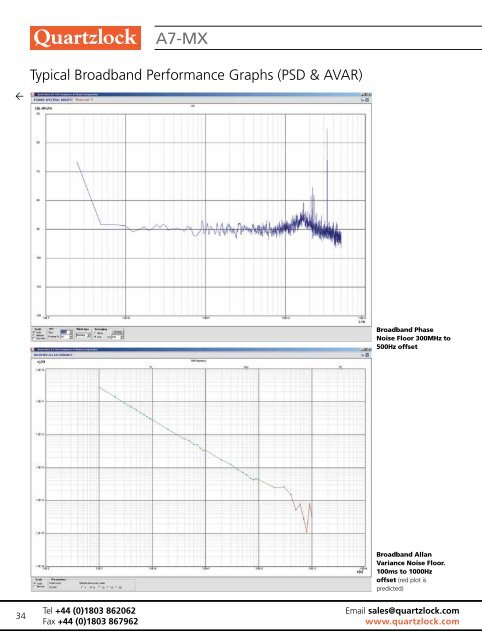
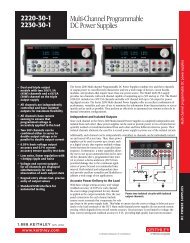
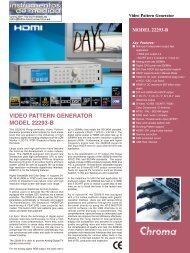
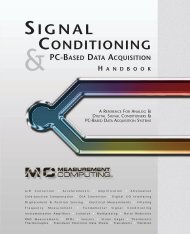
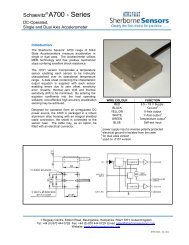
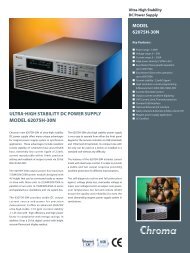
Broadband Allan variance noise floor. 100ms to 1000Hz offset (<strong>re</strong>d plot is p<strong>re</strong>dicted)Typical Broadband PerformanceGraphs Typical Broadband (PSD & AVAR) PerformanceGraphs (PSD & A7-MX AVAR)Typical Broadband Performance Graphs (PSD & AVAR)Broadband Phase noise floor. 300mHz to 500Hz offsetBroadband Phase noise floor. 300mHz to 500Hz offsetBroadband PhaseNoise Floor 300MHz to500Hz offset34Broadband Allan variance noise floor. 100ms to 1000Hz offset (<strong>re</strong>d plot is p<strong>re</strong>dicted)Tel +44 (0)1803 862062Fax +44 (0)1803 867962Broadband AllanVariance Noise Floor.100ms to 1000Hzoffset (<strong>re</strong>d plot isp<strong>re</strong>dicted)Email sales@quartzlock.comwww.quartzlock.com
A7-MXOperational DescriptionThe<strong>re</strong> a<strong>re</strong> two inputs on the front panel. One of these is for thephase/ f<strong>re</strong>quency <strong>re</strong>fe<strong>re</strong>nce which will often be an atomic f<strong>re</strong>quencystandard. The <strong>re</strong>fe<strong>re</strong>nce f<strong>re</strong>quency can be 5 or 10MHz with automaticswitching. The other input is for the measu<strong>re</strong>ment signal, also 5 or10MHz, also with automatic switching.The<strong>re</strong> a<strong>re</strong> pushbutton controls for phase/f<strong>re</strong>quency mode, multiplierratio , filter selection, sampling rate (tau) and phase <strong>re</strong>set. The<strong>re</strong> a<strong>re</strong> alsoa number of controls which adjust the analog meter function. The<strong>re</strong> a<strong>re</strong>indicator lights to confirm that the <strong>re</strong>fe<strong>re</strong>nce and measu<strong>re</strong>ment inputsa<strong>re</strong> at the <strong>re</strong>qui<strong>re</strong>d level, and that the internal phase locked multipliersa<strong>re</strong> locked. The analog meter shows fractional f<strong>re</strong>quency diffe<strong>re</strong>nce withfull scale ranges from +/-1x10-7 to +/-1x10-12, and phase diffe<strong>re</strong>nceswith full scale ranges from +/10us to +/-100ps.When the instrument is connected to a PC, the control positions a<strong>re</strong><strong>re</strong>ad by the PC and displayed on the virtual control panelOn the <strong>re</strong>ar panel is the broadband f<strong>re</strong>quency input which can bebetween 50kHz and 65MHz. Also on the <strong>re</strong>ar panel a<strong>re</strong> outputs toan external timer/counter, and a switch which adjusts the analoguemeter time constant.The instrument has two main modes, narrowband, high <strong>re</strong>solution,and broadband. The selection between these modes is made on thePC virtual control panel.In narrowband, high <strong>re</strong>solution mode, the measu<strong>re</strong>d signal must beat 5 or 10MHz. In this mode the instrument uses multiply and mixtechniques to inc<strong>re</strong>ase the fractional f<strong>re</strong>quency diffe<strong>re</strong>nce ( or phasediffe<strong>re</strong>nce) between the measu<strong>re</strong>d input and the <strong>re</strong>fe<strong>re</strong>nce. Thisimproves the <strong>re</strong>solution of the digital phase comparator, and <strong>re</strong>sultsin a theo<strong>re</strong>tical phase <strong>re</strong>solution of 0.125fs. The actual <strong>re</strong>solution isnoise limited to about 50fs. The cor<strong>re</strong>sponding fractional f<strong>re</strong>quency<strong>re</strong>solution is 1x10-13 in one second of measu<strong>re</strong>ment time.In broadband mode the multiply and mix is not used. The digital phasecomparator makes di<strong>re</strong>ct phase measu<strong>re</strong>ments with a <strong>re</strong>solution of12.5ps. This is comparable to the fastest f<strong>re</strong>quency counters andgives a fractional f<strong>re</strong>quency <strong>re</strong>solution of 3x10-11 in one second ofmeasu<strong>re</strong>ment time, or 2x10-12 with averaging switched on.When connected to a PC, the softwa<strong>re</strong> provides 4 scalable windows.One of these is the virtual panel and digital display. The other 3 a<strong>re</strong> dataplot, Allan variance plot, and phase spectral density (phase noise) plot.The virtual panel provides control of measu<strong>re</strong>ment rate (tau), andmode (narrowband, high <strong>re</strong>solution, or broadband). Repeaterindicators a<strong>re</strong> provided to show the settings of controls on thephysical instrument. It is possible to sto<strong>re</strong> blocks of measu<strong>re</strong>ments upto 32768 measu<strong>re</strong>ments into a computer file. Once a measu<strong>re</strong>mentis started, the instrument will sto<strong>re</strong> the complete measu<strong>re</strong>ment blockinternally, provide power is maintained. This makes certain that datais never lost, even if the computer crashes and has to be <strong>re</strong>started. InTel +44 (0)1803 862062Fax +44 (0)1803 867962order to make su<strong>re</strong> that a long measu<strong>re</strong>ment run is not interrupted bya power failu<strong>re</strong>, the instrument may be powed from a battery supplyof 24V. This will automatically be used if line power should fail.The digital display shows phase or fractional f<strong>re</strong>quency offset dependingupon mode. The units and number of significant digits is adjustable.Averaging mode may be selected from this window. If averaging isoff, the digital phase comparator makes single measu<strong>re</strong>ments at theselected sampling rate. If averaging is on, the comparator operatesat the maximum sampling rate of 1ks/s. A block average <strong>re</strong>duces thedata rate to the slected sampling rate.Dither mode may be selected from this window. Dither is a techniquewhich <strong>re</strong>duces unavoidable internally generated spurii to below thenoise floor, at the expense of an inc<strong>re</strong>ase in noise floor. For furtherdetails see operating manual.The data window shows <strong>re</strong>al time accumulation of the data as agraph. The last 8 to 32768 data points may be shown on the graph.A statistics display shows max, min mean, and standard deviation forthe data shown on the graph. The scaling of the y axis may be auto,manual, or max/min.The Allan variance window shows calculated Allan variance for all dataaccumulated since the start of a run. If averaging is off, single phasemeasu<strong>re</strong>ments a<strong>re</strong> made at the <strong>re</strong>quested sampling rate and the statisticis true Allan variance. If averaging mode is on, the statistic becomesmodified Allan varaince. The graph title cor<strong>re</strong>ctly indicates this.The Phase Spectral Density (PSD) window shows phase noise as agraph of L(f) in units of dBc against offset f<strong>re</strong>quency on a log scale.Various window functions and averaging modes a<strong>re</strong> provided. Theroutines a<strong>re</strong> identical to those used in the Industry standard softwa<strong>re</strong>“Stable32”.The user can select the basic length of the FFT, and also the deg<strong>re</strong>e ofoverlap. As data is accumulated, new FFTs a<strong>re</strong> <strong>perf</strong>ormed on a mix ofold and new data depending on the overlap parameter.Each FFT <strong>re</strong>sult can either <strong>re</strong>place the last graph, be added to a blockaverage, or be used in a continous or exponential average.All FFTs a<strong>re</strong> cor<strong>re</strong>ctly normalised for bin bandwidth, window ENBW,window cohe<strong>re</strong>nt gain, and nominal f<strong>re</strong>quency.F<strong>re</strong>quency data always has a fixed offset <strong>re</strong>moved befo<strong>re</strong> being used forthe FFT calculation. Phase data has a fixed slope ramp <strong>re</strong>moved by linear<strong>re</strong>g<strong>re</strong>ssion. This avoids a large component in the lower f<strong>re</strong>quency binswhich will distort the <strong>re</strong>sult, even when windowing is used.A mode is provided for the measu<strong>re</strong>ment of disc<strong>re</strong>te components(spurii). In this mode the scale is changed from L(f), dBc/Hz toPower,dBc. Cor<strong>re</strong>ctions for bin bandwidth and window ENBW a<strong>re</strong><strong>re</strong>moved. A flat top window is provided for measu<strong>re</strong>ment of disc<strong>re</strong>tes,with scallop loss of only 0.01dB.Email sales@quartzlock.comwww.quartzlock.com 35