- Page 15 and 16:
xviPrefacemake the examples as clea
- Page 17 and 18:
xviiiPrefaceOne of the most importa
- Page 19 and 20:
xxPrefaceOthers at Prentice Hall wh
- Page 22 and 23:
1Data Structures and AlgorithmsHow
- Page 24 and 25:
Sec. 1.1 A Philosophy of Data Struc
- Page 26 and 27:
Sec. 1.1 A Philosophy of Data Struc
- Page 28 and 29:
Sec. 1.2 Abstract Data Types and Da
- Page 30 and 31:
Sec. 1.2 Abstract Data Types and Da
- Page 32 and 33:
Sec. 1.3 Design Patterns 13Data Typ
- Page 34 and 35:
Sec. 1.3 Design Patterns 151.3.3 Co
- Page 36 and 37:
Sec. 1.4 Problems, Algorithms, and
- Page 38 and 39:
Sec. 1.5 Further Reading 194. It mu
- Page 40 and 41:
Sec. 1.6 Exercises 21If you want to
- Page 42 and 43:
Sec. 1.6 Exercises 231.12 Imagine t
- Page 44 and 45:
2Mathematical PreliminariesThis cha
- Page 46 and 47:
Sec. 2.1 Sets and Relations 27examp
- Page 48 and 49:
Sec. 2.2 Miscellaneous Notation 29x
- Page 50 and 51:
Sec. 2.3 Logarithms 31positive inte
- Page 52 and 53:
Sec. 2.4 Summations and Recurrences
- Page 54 and 55:
Sec. 2.4 Summations and Recurrences
- Page 56 and 57:
Sec. 2.5 Recursion 37factorial of n
- Page 58 and 59:
Sec. 2.6 Mathematical Proof Techniq
- Page 60 and 61:
Sec. 2.6 Mathematical Proof Techniq
- Page 62 and 63:
Sec. 2.6 Mathematical Proof Techniq
- Page 64 and 65:
Sec. 2.6 Mathematical Proof Techniq
- Page 66 and 67:
Sec. 2.7 Estimating 47Example 2.17
- Page 68 and 69:
Sec. 2.8 Further Reading 49typical
- Page 70 and 71:
Sec. 2.9 Exercises 51(f) {〈2, 1
- Page 72 and 73:
Sec. 2.9 Exercises 532.17 Prove by
- Page 74 and 75:
Sec. 2.9 Exercises 552.38 When buyi
- Page 76 and 77:
3Algorithm AnalysisHow long will it
- Page 78 and 79:
Sec. 3.1 Introduction 59compiled wi
- Page 80 and 81:
Sec. 3.1 Introduction 61Example 3.3
- Page 82 and 83:
Sec. 3.2 Best, Worst, and Average C
- Page 84 and 85:
Sec. 3.3 A Faster Computer, or a Fa
- Page 86 and 87:
Sec. 3.4 Asymptotic Analysis 67comp
- Page 88 and 89:
Sec. 3.4 Asymptotic Analysis 69fast
- Page 90 and 91:
Sec. 3.4 Asymptotic Analysis 71Exam
- Page 92 and 93:
Sec. 3.4 Asymptotic Analysis 73Rule
- Page 94 and 95:
Sec. 3.5 Calculating the Running Ti
- Page 96 and 97:
Sec. 3.5 Calculating the Running Ti
- Page 98 and 99:
Sec. 3.6 Analyzing Problems 79binar
- Page 100 and 101:
Sec. 3.7 Common Misunderstandings 8
- Page 102 and 103:
Sec. 3.9 Space Bounds 83pixel. Assu
- Page 104 and 105:
Sec. 3.9 Space Bounds 85A classic e
- Page 106 and 107:
Sec. 3.10 Speeding Up Your Programs
- Page 108 and 109:
Sec. 3.11 Empirical Analysis 893.11
- Page 110 and 111:
Sec. 3.13 Exercises 913.3 Arrange t
- Page 112 and 113:
Sec. 3.13 Exercises 93(f) sum = 0;f
- Page 114:
Sec. 3.14 Projects 95a summation fo
- Page 118 and 119:
4Lists, Stacks, and QueuesIf your p
- Page 120 and 121:
Sec. 4.1 Lists 101The next step is
- Page 122 and 123:
Sec. 4.1 Lists 103mentations, asser
- Page 124 and 125:
Sec. 4.1 Lists 105/** Array-based l
- Page 126 and 127:
Sec. 4.1 Lists 107Insert 23:1312 20
- Page 128 and 129:
Sec. 4.1 Lists 109currtailheadFigur
- Page 130 and 131:
Sec. 4.1 Lists 111// Linked list im
- Page 132 and 133:
Sec. 4.1 Lists 113curr... 23 12 ...
- Page 134 and 135:
Sec. 4.1 Lists 115// Singly linked
- Page 136 and 137:
Sec. 4.1 Lists 117determined size.
- Page 138 and 139:
Sec. 4.1 Lists 119pointer to each e
- Page 140 and 141:
Sec. 4.1 Lists 121// Insert "it" at
- Page 142 and 143:
Sec. 4.1 Lists 123curr... 20curr23
- Page 144 and 145:
Sec. 4.2 Stacks 125/** Stack ADT */
- Page 146 and 147:
Sec. 4.2 Stacks 127// Linked stack
- Page 148 and 149:
Sec. 4.2 Stacks 129Currptr β 1Curr
- Page 150 and 151:
Sec. 4.2 Stacks 131Example 4.3 The
- Page 152 and 153:
Sec. 4.3 Queues 133/** Queue ADT */
- Page 154 and 155:
Sec. 4.3 Queues 135frontfront20 512
- Page 156 and 157:
Sec. 4.3 Queues 137// Array-based q
- Page 158 and 159:
Sec. 4.4 Dictionaries 139enqueue pl
- Page 160 and 161:
Sec. 4.4 Dictionaries 141Method cle
- Page 162 and 163:
Sec. 4.4 Dictionaries 143// Contain
- Page 164 and 165:
Sec. 4.4 Dictionaries 145/** Dictio
- Page 166 and 167:
Sec. 4.5 Further Reading 1474.5 Fur
- Page 168 and 169:
Sec. 4.6 Exercises 149(a) The data
- Page 170 and 171:
Sec. 4.7 Projects 1514.3 Use singly
- Page 172 and 173:
5Binary TreesThe list representatio
- Page 174 and 175:
Sec. 5.1 Definitions and Properties
- Page 176 and 177:
Sec. 5.1 Definitions and Properties
- Page 178 and 179:
Sec. 5.2 Binary Tree Traversals 159
- Page 180 and 181:
Sec. 5.2 Binary Tree Traversals 161
- Page 182 and 183:
Sec. 5.3 Binary Tree Node Implement
- Page 184 and 185:
Sec. 5.3 Binary Tree Node Implement
- Page 186 and 187:
Sec. 5.3 Binary Tree Node Implement
- Page 188 and 189:
Sec. 5.3 Binary Tree Node Implement
- Page 190 and 191:
Sec. 5.4 Binary Search Trees 171Thi
- Page 192 and 193:
Sec. 5.4 Binary Search Trees 173120
- Page 194 and 195:
Sec. 5.4 Binary Search Trees 175/**
- Page 196 and 197:
Sec. 5.4 Binary Search Trees 177min
- Page 198 and 199:
Sec. 5.4 Binary Search Trees 17937
- Page 200 and 201:
Sec. 5.5 Heaps and Priority Queues
- Page 202 and 203:
Sec. 5.5 Heaps and Priority Queues
- Page 204 and 205:
Sec. 5.5 Heaps and Priority Queues
- Page 206 and 207:
Sec. 5.5 Heaps and Priority Queues
- Page 208 and 209:
Sec. 5.6 Huffman Coding Trees 189Le
- Page 210 and 211:
Sec. 5.6 Huffman Coding Trees 191St
- Page 212 and 213:
Sec. 5.6 Huffman Coding Trees 193/*
- Page 214 and 215:
Sec. 5.6 Huffman Coding Trees 195//
- Page 216 and 217:
Sec. 5.6 Huffman Coding Trees 197A
- Page 218 and 219:
Sec. 5.8 Exercises 199Many techniqu
- Page 220 and 221:
Sec. 5.8 Exercises 2015.19 Write a
- Page 222 and 223:
Sec. 5.9 Projects 203(d) The record
- Page 224 and 225:
6Non-Binary TreesMany organizations
- Page 226 and 227:
Sec. 6.1 General Tree Definitions a
- Page 228 and 229:
Sec. 6.2 The Parent Pointer Impleme
- Page 230 and 231:
Sec. 6.2 The Parent Pointer Impleme
- Page 232 and 233:
Sec. 6.2 The Parent Pointer Impleme
- Page 234 and 235:
Sec. 6.2 The Parent Pointer Impleme
- Page 236 and 237:
Sec. 6.3 General Tree Implementatio
- Page 238 and 239:
Sec. 6.3 General Tree Implementatio
- Page 240 and 241:
Sec. 6.4 K-ary Trees 221RRABABCDEFC
- Page 242 and 243:
Sec. 6.5 Sequential Tree Implementa
- Page 244 and 245:
Sec. 6.5 Sequential Tree Implementa
- Page 246 and 247:
Sec. 6.7 Exercises 2276.2 Write an
- Page 248 and 249:
Sec. 6.7 Exercises 229CAFBEHGDIFigu
- Page 250:
Sec. 6.8 Projects 231proved perform
- Page 254 and 255:
7Internal SortingWe sort many thing
- Page 256 and 257:
Sec. 7.2 Three Θ(n 2 ) Sorting Alg
- Page 258 and 259:
Sec. 7.2 Three Θ(n 2 ) Sorting Alg
- Page 260 and 261:
Sec. 7.2 Three Θ(n 2 ) Sorting Alg
- Page 262 and 263:
Sec. 7.2 Three Θ(n 2 ) Sorting Alg
- Page 264 and 265:
Sec. 7.3 Shellsort 24559 20 17 13 2
- Page 266 and 267:
Sec. 7.4 Mergesort 24736 20 17 13 2
- Page 268 and 269:
Sec. 7.5 Quicksort 249static
- Page 270 and 271:
Sec. 7.5 Quicksort 251static
- Page 272 and 273:
Sec. 7.5 Quicksort 253InitialPass 1
- Page 274 and 275:
Sec. 7.5 Quicksort 255The initial c
- Page 276 and 277:
Sec. 7.6 Heapsort 257and fast. The
- Page 278 and 279:
Sec. 7.7 Binsort and Radix Sort 259
- Page 280 and 281:
Sec. 7.7 Binsort and Radix Sort 261
- Page 282 and 283:
Sec. 7.7 Binsort and Radix Sort 263
- Page 284 and 285:
Sec. 7.8 An Empirical Comparison of
- Page 286 and 287:
Sec. 7.9 Lower Bounds for Sorting 2
- Page 288 and 289:
Sec. 7.9 Lower Bounds for Sorting 2
- Page 290 and 291:
Sec. 7.10 Further Reading 271• A
- Page 292 and 293:
Sec. 7.11 Exercises 2737.7 Recall t
- Page 294 and 295: Sec. 7.12 Projects 2757.16 (a) Devi
- Page 296: Sec. 7.12 Projects 277classmates? W
- Page 299 and 300: 280 Chap. 8 File Processing and Ext
- Page 301 and 302: 282 Chap. 8 File Processing and Ext
- Page 303 and 304: 284 Chap. 8 File Processing and Ext
- Page 305 and 306: 286 Chap. 8 File Processing and Ext
- Page 307 and 308: 288 Chap. 8 File Processing and Ext
- Page 309 and 310: 290 Chap. 8 File Processing and Ext
- Page 311 and 312: 292 Chap. 8 File Processing and Ext
- Page 313 and 314: 294 Chap. 8 File Processing and Ext
- Page 315 and 316: 296 Chap. 8 File Processing and Ext
- Page 317 and 318: 298 Chap. 8 File Processing and Ext
- Page 319 and 320: 300 Chap. 8 File Processing and Ext
- Page 321 and 322: 302 Chap. 8 File Processing and Ext
- Page 323 and 324: 304 Chap. 8 File Processing and Ext
- Page 325 and 326: 306 Chap. 8 File Processing and Ext
- Page 327 and 328: 308 Chap. 8 File Processing and Ext
- Page 329 and 330: 310 Chap. 8 File Processing and Ext
- Page 331 and 332: 312 Chap. 8 File Processing and Ext
- Page 333 and 334: 314 Chap. 8 File Processing and Ext
- Page 335 and 336: 316 Chap. 8 File Processing and Ext
- Page 337 and 338: 318 Chap. 9 SearchingThis and the f
- Page 339 and 340: 320 Chap. 9 Searchingelement in L,
- Page 341 and 342: 322 Chap. 9 SearchingThis is equal
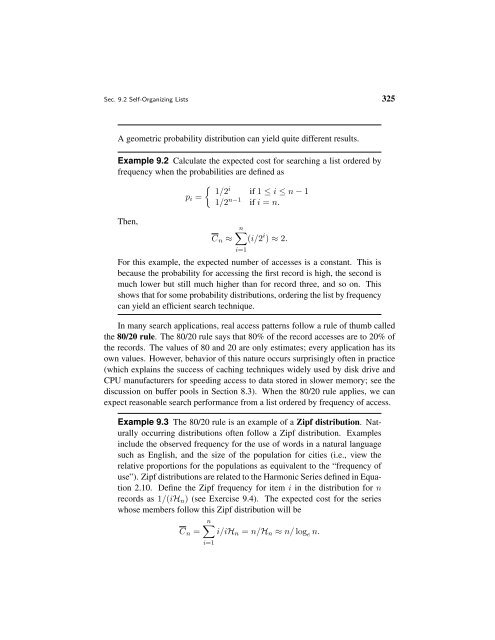
- Page 343: 324 Chap. 9 Searching9.2 Self-Organ
- Page 347 and 348: 328 Chap. 9 Searchingand the total
- Page 349 and 350: 330 Chap. 9 SearchingThe set differ
- Page 351 and 352: 332 Chap. 9 Searchingprobability th
- Page 353 and 354: 334 Chap. 9 SearchingExample 9.6 A
- Page 355 and 356: 336 Chap. 9 Searchingand the next f
- Page 357 and 358: 338 Chap. 9 Searching01HashTable100
- Page 359 and 360: 340 Chap. 9 Searching/** Insert rec
- Page 361 and 362: 342 Chap. 9 Searching09050090501100
- Page 363 and 364: 344 Chap. 9 SearchingExample 9.9 Co
- Page 365 and 366: 346 Chap. 9 Searchingproject at the
- Page 367 and 368: 348 Chap. 9 SearchingIf N and M are
- Page 369 and 370: 350 Chap. 9 SearchingDepending on t
- Page 371 and 372: 352 Chap. 9 SearchingBentley et al.
- Page 373 and 374: 354 Chap. 9 Searching(c) How many s
- Page 375 and 376: 356 Chap. 9 Searching9.5 Implement
- Page 377 and 378: 358 Chap. 10 Indexingfile is create
- Page 379 and 380: 360 Chap. 10 Indexing1 2003 5894 10
- Page 381 and 382: 362 Chap. 10 IndexingSecondaryKeyJo
- Page 383 and 384: 364 Chap. 10 Indexingkey value for
- Page 385 and 386: 366 Chap. 10 IndexingFigure 10.7 Br
- Page 387 and 388: 368 Chap. 10 Indexing/** 2-3 tree n
- Page 389 and 390: 370 Chap. 10 Indexing18331223 30 48
- Page 391 and 392: 372 Chap. 10 Indexingprivate TTNode
- Page 393 and 394: 374 Chap. 10 Indexing24152033 45 48
- Page 395 and 396:
376 Chap. 10 Indexingvalues, but th
- Page 397 and 398:
378 Chap. 10 Indexing331012 233348
- Page 399 and 400:
380 Chap. 10 Indexing4845 4748 50 5
- Page 401 and 402:
382 Chap. 10 IndexingAs mentioned e
- Page 403 and 404:
384 Chap. 10 Indexing(b) Show the i
- Page 406:
PART IVAdvanced Data Structures387
- Page 409 and 410:
390 Chap. 11 Graphs04123147123(a)(b
- Page 411 and 412:
392 Chap. 11 Graphs0 1 2 3 40201 11
- Page 413 and 414:
394 Chap. 11 GraphsThe adjacency ma
- Page 415 and 416:
396 Chap. 11 Graphsedge list. Funct
- Page 417 and 418:
398 Chap. 11 Graphspublic int weigh
- Page 419 and 420:
400 Chap. 11 Graphs}// Store edge w
- Page 421 and 422:
402 Chap. 11 GraphsABABCCDDFFEE(a)(
- Page 423 and 424:
404 Chap. 11 Graphs// Breadth first
- Page 425 and 426:
406 Chap. 11 GraphsAInitial call to
- Page 427 and 428:
408 Chap. 11 Graphsstatic void tops
- Page 429 and 430:
410 Chap. 11 Graphs// Compute short
- Page 431 and 432:
412 Chap. 11 Graphs// Dijkstra’s
- Page 433 and 434:
414 Chap. 11 Graphs// Compute a min
- Page 435 and 436:
416 Chap. 11 GraphsMarkedVertices v
- Page 437 and 438:
418 Chap. 11 GraphsInitialA B C D E
- Page 439 and 440:
420 Chap. 11 Graphs2 511032041032 6
- Page 441 and 442:
422 Chap. 11 Graphstriangular matri
- Page 443 and 444:
424 Chap. 12 Lists and Arrays Revis
- Page 445 and 446:
426 Chap. 12 Lists and Arrays Revis
- Page 447 and 448:
428 Chap. 12 Lists and Arrays Revis
- Page 449 and 450:
430 Chap. 12 Lists and Arrays Revis
- Page 451 and 452:
432 Chap. 12 Lists and Arrays Revis
- Page 453 and 454:
434 Chap. 12 Lists and Arrays Revis
- Page 455 and 456:
436 Chap. 12 Lists and Arrays Revis
- Page 457 and 458:
438 Chap. 12 Lists and Arrays Revis
- Page 459 and 460:
440 Chap. 12 Lists and Arrays Revis
- Page 461 and 462:
442 Chap. 12 Lists and Arrays Revis
- Page 463 and 464:
444 Chap. 12 Lists and Arrays Revis
- Page 465 and 466:
446 Chap. 12 Lists and Arrays Revis
- Page 467 and 468:
448 Chap. 13 Advanced Tree Structur
- Page 469 and 470:
450 Chap. 13 Advanced Tree Structur
- Page 471 and 472:
452 Chap. 13 Advanced Tree Structur
- Page 473 and 474:
454 Chap. 13 Advanced Tree Structur
- Page 475 and 476:
456 Chap. 13 Advanced Tree Structur
- Page 477 and 478:
458 Chap. 13 Advanced Tree Structur
- Page 479 and 480:
460 Chap. 13 Advanced Tree Structur
- Page 481 and 482:
462 Chap. 13 Advanced Tree Structur
- Page 483 and 484:
464 Chap. 13 Advanced Tree Structur
- Page 485 and 486:
466 Chap. 13 Advanced Tree Structur
- Page 487 and 488:
468 Chap. 13 Advanced Tree Structur
- Page 489 and 490:
470 Chap. 13 Advanced Tree Structur
- Page 491 and 492:
472 Chap. 13 Advanced Tree Structur
- Page 493 and 494:
474 Chap. 13 Advanced Tree Structur
- Page 495 and 496:
476 Chap. 13 Advanced Tree Structur
- Page 498:
PART VTheory of Algorithms479
- Page 501 and 502:
482 Chap. 14 Analysis Techniquesthi
- Page 503 and 504:
484 Chap. 14 Analysis TechniquesExa
- Page 505 and 506:
486 Chap. 14 Analysis Techniquesthe
- Page 507 and 508:
488 Chap. 14 Analysis Techniquesof
- Page 509 and 510:
490 Chap. 14 Analysis TechniquesHow
- Page 511 and 512:
492 Chap. 14 Analysis Techniques= 2
- Page 513 and 514:
494 Chap. 14 Analysis TechniquesNot
- Page 515 and 516:
496 Chap. 14 Analysis Techniquesfro
- Page 517 and 518:
498 Chap. 14 Analysis Techniquesbit
- Page 519 and 520:
500 Chap. 14 Analysis Techniquesfro
- Page 521 and 522:
502 Chap. 14 Analysis Techniques14.
- Page 523 and 524:
504 Chap. 14 Analysis Techniques}G.
- Page 526 and 527:
15Lower BoundsHow do I know if I ha
- Page 528 and 529:
Sec. 15.1 Introduction to Lower Bou
- Page 530 and 531:
Sec. 15.2 Lower Bounds on Searching
- Page 532 and 533:
Sec. 15.3 Finding the Maximum Value
- Page 534 and 535:
Sec. 15.4 Adversarial Lower Bounds
- Page 536 and 537:
Sec. 15.4 Adversarial Lower Bounds
- Page 538 and 539:
Sec. 15.5 State Space Lower Bounds
- Page 540 and 541:
Sec. 15.5 State Space Lower Bounds
- Page 542 and 543:
Sec. 15.6 Finding the ith Best Elem
- Page 544 and 545:
Sec. 15.7 Optimal Sorting 525search
- Page 546 and 547:
Sec. 15.8 Further Reading 527Merge
- Page 548 and 549:
Sec. 15.9 Exercises 52915.10 Show t
- Page 550 and 551:
16Patterns of AlgorithmsThis chapte
- Page 552 and 553:
Sec. 16.1 Dynamic Programming 533dy
- Page 554 and 555:
Sec. 16.1 Dynamic Programming 535ar
- Page 556 and 557:
Sec. 16.2 Randomized Algorithms 537
- Page 558 and 559:
Sec. 16.2 Randomized Algorithms 539
- Page 560 and 561:
Sec. 16.2 Randomized Algorithms 541
- Page 562 and 563:
Sec. 16.2 Randomized Algorithms 543
- Page 564 and 565:
Sec. 16.3 Numerical Algorithms 545e
- Page 566 and 567:
Sec. 16.3 Numerical Algorithms 547d
- Page 568 and 569:
Sec. 16.3 Numerical Algorithms 549W
- Page 570 and 571:
Sec. 16.3 Numerical Algorithms 5511
- Page 572 and 573:
Sec. 16.3 Numerical Algorithms 553i
- Page 574 and 575:
Sec. 16.3 Numerical Algorithms 555b
- Page 576:
Sec. 16.6 Projects 55716.8 What is
- Page 579 and 580:
560 Chap. 17 Limits to Computations
- Page 581 and 582:
562 Chap. 17 Limits to Computationf
- Page 583 and 584:
564 Chap. 17 Limits to ComputationP
- Page 585 and 586:
566 Chap. 17 Limits to Computation[
- Page 587 and 588:
568 Chap. 17 Limits to Computation1
- Page 589 and 590:
570 Chap. 17 Limits to Computationl
- Page 591 and 592:
572 Chap. 17 Limits to ComputationT
- Page 593 and 594:
574 Chap. 17 Limits to Computation3
- Page 595 and 596:
576 Chap. 17 Limits to Computationa
- Page 597 and 598:
578 Chap. 17 Limits to ComputationT
- Page 599 and 600:
580 Chap. 17 Limits to ComputationB
- Page 601 and 602:
582 Chap. 17 Limits to Computation1
- Page 603 and 604:
584 Chap. 17 Limits to Computation1
- Page 605 and 606:
586 Chap. 17 Limits to Computation/
- Page 607 and 608:
588 Chap. 17 Limits to ComputationT
- Page 609 and 610:
590 Chap. 17 Limits to ComputationI
- Page 611 and 612:
592 Chap. 17 Limits to Computationt
- Page 613 and 614:
594 BIBLIOGRAPHY[BG00] Sara Baase a
- Page 615 and 616:
596 BIBLIOGRAPHY[LLKS85] E.L. Lawle
- Page 617 and 618:
598 BIBLIOGRAPHY[WMB99][Zei07]I.H.
- Page 619 and 620:
600 INDEXbest fit, see memory manag
- Page 621 and 622:
602 INDEXrelation, 27, 50estimating
- Page 623 and 624:
604 INDEXinteger representation, 5,
- Page 625 and 626:
606 INDEXpath compression, 215-216,
- Page 627 and 628:
608 INDEXterminology, 236-237spatia


