an investigation of domestic laundry in europe - habits ... - SIFO
an investigation of domestic laundry in europe - habits ... - SIFO
an investigation of domestic laundry in europe - habits ... - SIFO

You also want an ePaper? Increase the reach of your titles
YUMPU automatically turns print PDFs into web optimized ePapers that Google loves.
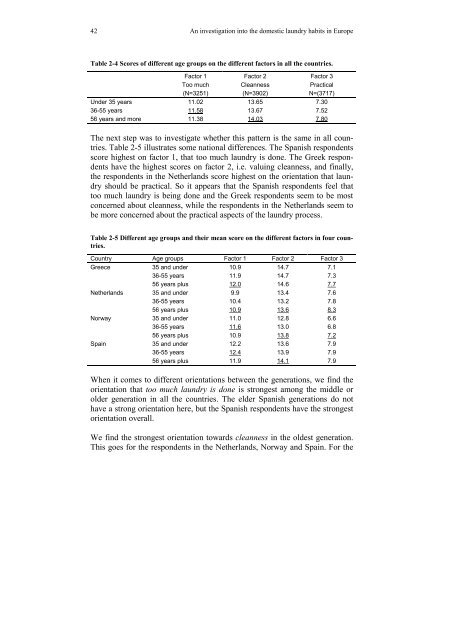
42An <strong><strong>in</strong>vestigation</strong> <strong>in</strong>to the <strong>domestic</strong> <strong>laundry</strong> <strong>habits</strong> <strong>in</strong> EuropeTable 2-4 Scores <strong>of</strong> different age groups on the different factors <strong>in</strong> all the countries.Under 35 years36-55 years56 years <strong>an</strong>d moreFactor 1Too much(N=3251)11.0211.5811.38Factor 2Cle<strong>an</strong>ness(N=3902)13.6513.6714.03Factor 3PracticalN=(3717)7.307.527.80The next step was to <strong>in</strong>vestigate whether this pattern is the same <strong>in</strong> all countries.Table 2-5 illustrates some national differences. The Sp<strong>an</strong>ish respondentsscore highest on factor 1, that too much <strong>laundry</strong> is done. The Greek respondentshave the highest scores on factor 2, i.e. valu<strong>in</strong>g cle<strong>an</strong>ness, <strong>an</strong>d f<strong>in</strong>ally,the respondents <strong>in</strong> the Netherl<strong>an</strong>ds score highest on the orientation that <strong>laundry</strong>should be practical. So it appears that the Sp<strong>an</strong>ish respondents feel thattoo much <strong>laundry</strong> is be<strong>in</strong>g done <strong>an</strong>d the Greek respondents seem to be mostconcerned about cle<strong>an</strong>ness, while the respondents <strong>in</strong> the Netherl<strong>an</strong>ds seem tobe more concerned about the practical aspects <strong>of</strong> the <strong>laundry</strong> process.Table 2-5 Different age groups <strong>an</strong>d their me<strong>an</strong> score on the different factors <strong>in</strong> four countries.Country Age groups Factor 1 Factor 2 Factor 3Greece35 <strong>an</strong>d under36-55 years56 years plus10.911.912.014.714.714.67.17.37.7Netherl<strong>an</strong>dsNorwaySpa<strong>in</strong>35 <strong>an</strong>d under36-55 years56 years plus35 <strong>an</strong>d under36-55 years56 years plus35 <strong>an</strong>d under36-55 years56 years plus9.910.410.911.011.610.912.212.411.913.413.213.612.813.013.813.613.914.17.67.88.36.66.87.27.97.97.9When it comes to different orientations between the generations, we f<strong>in</strong>d theorientation that too much <strong>laundry</strong> is done is strongest among the middle orolder generation <strong>in</strong> all the countries. The elder Sp<strong>an</strong>ish generations do nothave a strong orientation here, but the Sp<strong>an</strong>ish respondents have the strongestorientation overall.We f<strong>in</strong>d the strongest orientation towards cle<strong>an</strong>ness <strong>in</strong> the oldest generation.This goes for the respondents <strong>in</strong> the Netherl<strong>an</strong>ds, Norway <strong>an</strong>d Spa<strong>in</strong>. For the