validation of a wide plate finite element model using digital image ...
validation of a wide plate finite element model using digital image ...
validation of a wide plate finite element model using digital image ...

Create successful ePaper yourself
Turn your PDF publications into a flip-book with our unique Google optimized e-Paper software.
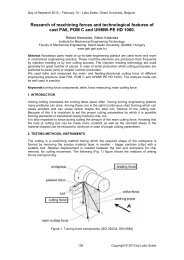
Sustainable Construction and Design 20112.3.2 LVDTs and clip gaugeTo measure the deformation at different locations <strong>of</strong> the specimen, 4 LVDTs were mounted on the backside<strong>of</strong> the specimen according to the UGent guidelines for CWP testing [4]. Two <strong>of</strong> them with gauge length 108mm (K1 and K2) were located in the gross section <strong>of</strong> the specimen, away from the notch. The two otherLVDTs (G1 and G2), with gauge length 388 mm, measured the elongation <strong>of</strong> the full prismatic section,traversing the defected section. Their position is indicated in Figure 2.A clip gauge was put over the notch to measure the crack mouth opening displacement (CMOD).2.3.3 DIC camera systemDigital Image Correlation (DIC) is an optical method in which the movement <strong>of</strong> speckle dots is tracked tocalculate their displacement. From this displacement, strain fields on the surface <strong>of</strong> the specimen can bedetermined. In this experiment, a setup <strong>of</strong> two cameras is used to allow 3D vision, so out-<strong>of</strong>-planedeformations (eg. necking) <strong>of</strong> the specimen can be evaluated as well. Both cameras are synchronized andtake one picture <strong>of</strong> 5Mpx every 10 seconds. A laptop with control and processing s<strong>of</strong>tware also recordedthe analogous force signal to allow for synchronization <strong>of</strong> the DIC and LabVIEW measurements.A crucial <strong>element</strong> in the DIC technique is the size <strong>of</strong> the speckle dots. Dots should not be too small for thecameras to detect them. If they are too large, however, calculation accuracy is reduced. The specklepattern shown in Figure 4 and Figure 5 did not introduce any correlation issues. The strain resolution was <strong>of</strong>the magnitude 0.1% strain.Figure 4: View <strong>of</strong> speckle pattern on half <strong>of</strong> theMWP specimenFigure 5: Detailed view <strong>of</strong> Figure 4.2.4 S<strong>of</strong>twareA LabVIEW program was developed to control the test rig. The s<strong>of</strong>tware defines whether the test rig shouldload or unload the specimen or hold it in a fixed position, based upon measurements <strong>of</strong> CMOD and appliedforce. In fact, a simple tensile test would suffice to validate the FEM <strong>model</strong>, but it was opted to follow theunloading compliance method [5]. Unloading compliance is a technique whereby the specimen issequentially loaded and unloaded, first in the elastic region, then in the plastic region. In the latter case, theunloading decision is based on a constant increment <strong>of</strong> CMOD. When plotting applied force as a function <strong>of</strong>CMOD, as in Figure 6, different loading and unloading cycles can be seen. From the slope evolution <strong>of</strong> theunloading and reloading cycles, crack size can be determined.418Copyright © 2011 by Laboratory Soete