validation of a wide plate finite element model using digital image ...
validation of a wide plate finite element model using digital image ...
validation of a wide plate finite element model using digital image ...

You also want an ePaper? Increase the reach of your titles
YUMPU automatically turns print PDFs into web optimized ePapers that Google loves.
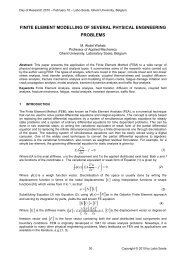
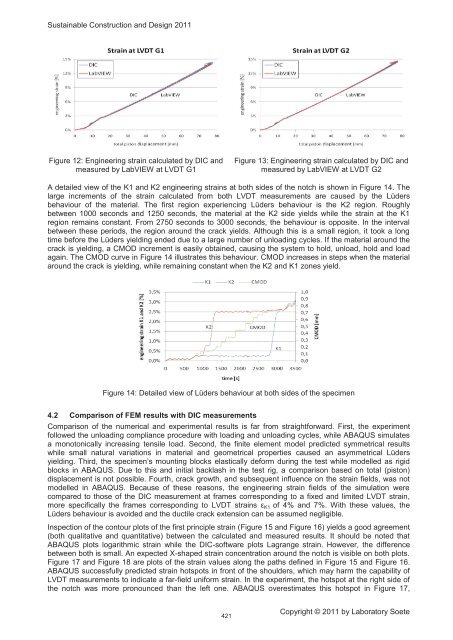
Sustainable Construction and Design 2011Figure 12: Engineering strain calculated by DIC andmeasured by LabVIEW at LVDT G1Figure 13: Engineering strain calculated by DIC andmeasured by LabVIEW at LVDT G2A detailed view <strong>of</strong> the K1 and K2 engineering strains at both sides <strong>of</strong> the notch is shown in Figure 14. Thelarge increments <strong>of</strong> the strain calculated from both LVDT measurements are caused by the Lüdersbehaviour <strong>of</strong> the material. The first region experiencing Lüders behaviour is the K2 region. Roughlybetween 1000 seconds and 1250 seconds, the material at the K2 side yields while the strain at the K1region remains constant. From 2750 seconds to 3000 seconds, the behaviour is opposite. In the intervalbetween these periods, the region around the crack yields. Although this is a small region, it took a longtime before the Lüders yielding ended due to a large number <strong>of</strong> unloading cycles. If the material around thecrack is yielding, a CMOD increment is easily obtained, ca<strong>using</strong> the system to hold, unload, hold and loadagain. The CMOD curve in Figure 14 illustrates this behaviour. CMOD increases in steps when the materialaround the crack is yielding, while remaining constant when the K2 and K1 zones yield.Figure 14: Detailed view <strong>of</strong> Lüders behaviour at both sides <strong>of</strong> the specimen4.2 Comparison <strong>of</strong> FEM results with DIC measurementsComparison <strong>of</strong> the numerical and experimental results is far from straightforward. First, the experimentfollowed the unloading compliance procedure with loading and unloading cycles, while ABAQUS simulatesa monotonically increasing tensile load. Second, the <strong>finite</strong> <strong>element</strong> <strong>model</strong> predicted symmetrical resultswhile small natural variations in material and geometrical properties caused an asymmetrical Lüdersyielding. Third, the specimen’s mounting blocks elastically deform during the test while <strong>model</strong>led as rigidblocks in ABAQUS. Due to this and initial backlash in the test rig, a comparison based on total (piston)displacement is not possible. Fourth, crack growth, and subsequent influence on the strain fields, was not<strong>model</strong>led in ABAQUS. Because <strong>of</strong> these reasons, the engineering strain fields <strong>of</strong> the simulation werecompared to those <strong>of</strong> the DIC measurement at frames corresponding to a fixed and limited LVDT strain,more specifically the frames corresponding to LVDT strains ε K1 <strong>of</strong> 4% and 7%. With these values, theLüders behaviour is avoided and the ductile crack extension can be assumed negligible.Inspection <strong>of</strong> the contour plots <strong>of</strong> the first principle strain (Figure 15 and Figure 16) yields a good agreement(both qualitative and quantitative) between the calculated and measured results. It should be noted thatABAQUS plots logarithmic strain while the DIC-s<strong>of</strong>tware plots Lagrange strain. However, the differencebetween both is small. An expected X-shaped strain concentration around the notch is visible on both plots.Figure 17 and Figure 18 are plots <strong>of</strong> the strain values along the paths defined in Figure 15 and Figure 16.ABAQUS successfully predicted strain hotspots in front <strong>of</strong> the shoulders, which may harm the capability <strong>of</strong>LVDT measurements to indicate a far-field uniform strain. In the experiment, the hotspot at the right side <strong>of</strong>the notch was more pronounced than the left one. ABAQUS overestimates this hotspot in Figure 17,421Copyright © 2011 by Laboratory Soete