Section BtrademarksFigure B.1.3.1 Trademark applications by geographical region2007 2011Asia: 35.1% Europe: 40.7%Latin America & the Caribbean: 8.9% North America: 9.9%Oceania: 2.7% Africa: 2.6%Asia: 44.0% Europe: 32.8%Latin America & the Caribbean: 9.8% North America: 8.8%Oceania: 2.4% Africa: 2.3%Source: WIPO Statistics Database, October <strong>2012</strong>Figure B.1.3.2 Trademark applications by income group2007 2011High-income: 54.3% Upper middle-income: 34.4%Lower middle-income: 10.1% Low-income: 1.2%High-income: 45.1% Upper middle-income: 43.9%Lower middle-income: 9.9% Low-income: 1.0%Source: WIPO Statistics Database, October <strong>2012</strong>Table B.1.3.3 Distribution of trademark applications by top Nice classes, 2011RankClass*Classshare (%)1 35 - Advertising and business management 9.32 25 - Clothing, footwear, headgear 6.93 9 - Scientific, photographic, measuring instruments; recording equipment; computers and software4 41 - Education, entertainment, and sporting activities 5.25 5 - Pharmaceutical preparations, baby food, dietary supplements for humans and animals, disinfectants, fungicides and herbicides 4.76 30 - Coffee, tea, cocoa, rice, flour, bread, pastry and confectionery, sugar, honey, yeast, salt, mustard; vinegar, sauces (condiments) and spices 4.17 42 - Scientific and technological services, design and development of computer hardware and software 4.1816 - Paper, cardboard and goods made from these materials; printed matter, photographs, artists’ materials, typewriters, and plastic materialsfor packaging 3.49 3 - Bleaching preparations and other substances for laundry use; cleaning and abrasive preparations; soaps, perfumery and cosmetics 3.410 29 - Meat, fish, poultry and game; preserved, frozen, dried and cooked fruits and vegetables; eggs, milk and milk products 2.9Thirty-five remaining classes 49.1Note: These numbers are based on direct filing data from 70 offices - which include, for example, the Office for Harmonization in the Internal Market (OHIM) andthe offices of Australia, China, France and the US – and on Madrid designation data from 87 offices, resulting in an aggregate total of 105 offices.*Some classes listed are abbreviated. See Annex B for full definitions.Source: WIPO Statistics Database, October <strong>2012</strong>104
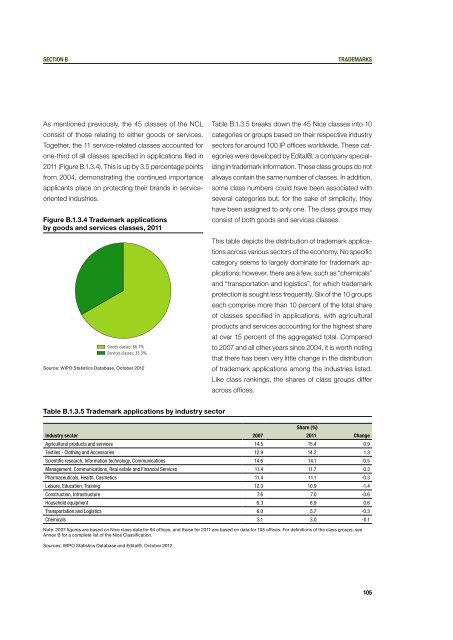
Section btrademarksAs mentioned previously, the 45 classes of the NCLconsist of those relating to either goods or services.Together, the 11 service-related classes accounted forone-third of all classes specified in applications filed in2011 (Figure B.1.3.4). This is up by 3.5 percentage pointsfrom 2004, demonstrating the continued importanceapplicants place on protecting their brands in serviceorientedindustries.Figure B.1.3.4 Trademark applicationsby goods and services classes, 2011Goods classes: 66.7%Services classes: 33.3%Source: WIPO Statistics Database, October <strong>2012</strong>Table B.1.3.5 breaks down the 45 Nice classes into 10categories or groups based on their respective industrysectors for around 100 IP offices worldwide. These categorieswere developed by Edital®, a company specializingin trademark information. These class groups do notalways contain the same number of classes. In addition,some class numbers could have been associated withseveral categories but, for the sake of simplicity, theyhave been assigned to only one. The class groups mayconsist of both goods and services classes.This table depicts the distribution of trademark applicationsacross various sectors of the economy. No specificcategory seems to largely dominate for trademark applications;however, there are a few, such as “chemicals”and “transportation and logistics”, for which trademarkprotection is sought less frequently. Six of the 10 groupseach comprise more than 10 percent of the total shareof classes specified in applications, with agriculturalproducts and services accounting for the highest shareat over 15 percent of the aggregated total. Comparedto 2007 and all other years since 2004, it is worth notingthat there has been very little change in the distributionof trademark applications among the industries listed.Like class rankings, the shares of class groups differacross offices.Table B.1.3.5 Trademark applications by industry sectorShare (%)Industry sector2007 2011 ChangeAgricultural products and services 14.5 15.4 0.9Textiles - Clothing and Accessories 12.9 14.2 1.3Scientific research, Information technology, Communications 14.6 14.1 -0.5Management, Communications, Real estate and Financial Services 11.4 11.7 0.3Pharmaceuticals, Health, Cosmetics 11.4 11.1 -0.3Leisure, Education, Training 12.3 10.9 -1.4Construction, Infrastructure 7.6 7.0 -0.6Household equipment 6.3 6.9 0.6Transportation and Logistics 6.0 5.7 -0.3Chemicals 3.1 3.0 -0.1Note: 2007 figures are based on Nice class data for 94 offices, and those for 2011 are based on data for 105 offices. For definitions of the class groups, seeAnnex B for a complete list of the Nice Classification.Sources: WIPO Statistics Database and Edital®, October <strong>2012</strong>105
- Page 3:
WIPO Economics & Statistics Series2
- Page 6 and 7:
acknowledgementsWorld Intellectual
- Page 8 and 9:
HighlightsPatents & utility modelsM
- Page 10:
HighlightsTrademarksRecord number o
- Page 13 and 14:
data descriptionWhere an office pro
- Page 15 and 16:
table of contentsA.7 70Patents by f
- Page 17 and 18:
table of contentssection cIndustria
- Page 19:
table of contentsannex, glossary an
- Page 22 and 23:
special Sectionthe rise of Design I
- Page 24 and 25:
special Sectionthe rise of Design I
- Page 26 and 27:
special Sectionthe rise of Design I
- Page 28 and 29:
special Sectionthe rise of Design I
- Page 30 and 31:
special Sectionthe rise of Design I
- Page 32 and 33:
special Sectionthe rise of Design I
- Page 34 and 35:
special Sectionthe rise of Design I
- Page 36 and 37:
special Sectionthe rise of Design I
- Page 38 and 39:
special Sectionthe rise of Design I
- Page 40 and 41:
Overview of IP ActivitiesTable 1: O
- Page 43 and 44:
Section Apatents, utility models an
- Page 45 and 46:
Section Apatents, utility models an
- Page 47 and 48:
Section Apatents, utility models an
- Page 49 and 50:
Section Apatents, utility models an
- Page 51 and 52:
Section Apatents, utility models an
- Page 53 and 54:
Section Apatents, utility models an
- Page 55 and 56: Section Apatents, utility models an
- Page 57 and 58: Section Apatents, utility models an
- Page 59 and 60: Section Apatents, utility models an
- Page 61 and 62: Section Apatents, utility models an
- Page 63 and 64: Section Apatents, utility models an
- Page 65 and 66: Section Apatents, utility models an
- Page 67 and 68: Section Apatents, utility models an
- Page 69 and 70: Section Apatents, utility models an
- Page 71 and 72: Section Apatents, utility models an
- Page 73 and 74: Section Apatents, utility models an
- Page 75 and 76: Section Apatents, utility models an
- Page 77 and 78: Section Apatents, utility models an
- Page 79 and 80: Section Apatents, utility models an
- Page 81 and 82: Section Apatents, utility models an
- Page 83 and 84: Section Apatents, utility models an
- Page 85 and 86: Section Apatents, utility models an
- Page 87 and 88: Section Apatents, utility models an
- Page 89 and 90: Section Apatents, utility models an
- Page 91 and 92: Section Apatents, utility models an
- Page 93 and 94: 16,024 13,241 11,854 10,4317,984Sec
- Page 95 and 96: Section Apatents, utility models an
- Page 97 and 98: Section Apatents, utility models an
- Page 99 and 100: Section btrademarkssection btradema
- Page 101 and 102: Section btrademarksWithin the inter
- Page 103 and 104: Section btrademarksFigure B.1.1.4 R
- Page 105: Section btrademarksFigure B.1.2.3 C
- Page 109 and 110: Section btrademarksFigure B.2.1.2 T
- Page 111 and 112: Section btrademarksFigure B.2.1.5 T
- Page 113 and 114: Section btrademarksFigure B.2.2.2 C
- Page 115 and 116: Section btrademarksFigure B.3.1 Nic
- Page 117 and 118: Section btrademarksB.4Trademark app
- Page 119 and 120: Section btrademarksTo establish a d
- Page 121 and 122: Section btrademarksFigure B.5.1 Nic
- Page 123 and 124: Section btrademarksmark in each of
- Page 125 and 126: Section btrademarksB.6.3 Registrati
- Page 127 and 128: Section btrademarksB.6.5 Madrid app
- Page 129 and 130: Section btrademarksFigure B.6.6.2 p
- Page 131 and 132: 476,726 476,687 461,713423,940Secti
- Page 133 and 134: Section cindustrial designssection
- Page 135 and 136: Section cindustrial designsFigure C
- Page 137 and 138: Section cindustrial designsC.1.2 Re
- Page 139 and 140: Section cindustrial designsdesign c
- Page 141 and 142: Section cindustrial designsTable C.
- Page 143 and 144: Section cindustrial designsFigure C
- Page 145 and 146: Section cindustrial designsC.3.2 In
- Page 147 and 148: Section cindustrial designsFigure C
- Page 149 and 150: Section cindustrial designsFigure C
- Page 151 and 152: Section DPlant variety protectionse
- Page 153 and 154: Section DPlant variety protectionD.
- Page 155 and 156: Section DPlant variety protectionD.
- Page 157 and 158:
Section DPlant variety protectionFi
- Page 159:
SectIOn DPlant varIEty protectIOnD.
- Page 162 and 163:
annex bAnnex BInternational classif
- Page 164 and 165:
annex bClass groups defined by Edit
- Page 166 and 167:
glossaryContracting Party (Hague me
- Page 168 and 169:
glossaryInternational Patent Classi
- Page 170 and 171:
glossaryPCT International Applicati
- Page 172 and 173:
glossaryWorld Intellectual Property
- Page 174 and 175:
statistical tables - patentsstatist
- Page 176 and 177:
statistical tables - patentsNameApp
- Page 178 and 179:
statistical tables - patentsTable P
- Page 180 and 181:
statistical tables - patentsNameGra
- Page 182 and 183:
statistical tables - trademarksName
- Page 184 and 185:
statistical tables - trademarksName
- Page 186 and 187:
statistical tables - trademarksName
- Page 188 and 189:
statistical tables - trademarksName
- Page 190 and 191:
statistical tables - industrial des
- Page 192 and 193:
statistical tables - industrial des
- Page 194 and 195:
statistical tables - industrial des
- Page 196:
statistical tables - plant varietyN