- Page 3:
WIPO Economics & Statistics Series2
- Page 6 and 7:
acknowledgementsWorld Intellectual
- Page 8 and 9:
HighlightsPatents & utility modelsM
- Page 10:
HighlightsTrademarksRecord number o
- Page 13 and 14:
data descriptionWhere an office pro
- Page 15 and 16:
table of contentsA.7 70Patents by f
- Page 17 and 18:
table of contentssection cIndustria
- Page 19:
table of contentsannex, glossary an
- Page 22 and 23:
special Sectionthe rise of Design I
- Page 24 and 25:
special Sectionthe rise of Design I
- Page 26 and 27:
special Sectionthe rise of Design I
- Page 28 and 29:
special Sectionthe rise of Design I
- Page 30 and 31:
special Sectionthe rise of Design I
- Page 32 and 33:
special Sectionthe rise of Design I
- Page 34 and 35:
special Sectionthe rise of Design I
- Page 36 and 37:
special Sectionthe rise of Design I
- Page 38 and 39:
special Sectionthe rise of Design I
- Page 40 and 41:
Overview of IP ActivitiesTable 1: O
- Page 43 and 44:
Section Apatents, utility models an
- Page 45 and 46:
Section Apatents, utility models an
- Page 47 and 48:
Section Apatents, utility models an
- Page 49 and 50:
Section Apatents, utility models an
- Page 51 and 52:
Section Apatents, utility models an
- Page 53 and 54:
Section Apatents, utility models an
- Page 55 and 56:
Section Apatents, utility models an
- Page 57 and 58:
Section Apatents, utility models an
- Page 59 and 60:
Section Apatents, utility models an
- Page 61 and 62:
Section Apatents, utility models an
- Page 63 and 64:
Section Apatents, utility models an
- Page 65 and 66:
Section Apatents, utility models an
- Page 67 and 68:
Section Apatents, utility models an
- Page 69 and 70:
Section Apatents, utility models an
- Page 71 and 72:
Section Apatents, utility models an
- Page 73 and 74:
Section Apatents, utility models an
- Page 75 and 76:
Section Apatents, utility models an
- Page 77 and 78:
Section Apatents, utility models an
- Page 79 and 80:
Section Apatents, utility models an
- Page 81 and 82:
Section Apatents, utility models an
- Page 83 and 84:
Section Apatents, utility models an
- Page 85 and 86:
Section Apatents, utility models an
- Page 87 and 88:
Section Apatents, utility models an
- Page 89 and 90:
Section Apatents, utility models an
- Page 91 and 92:
Section Apatents, utility models an
- Page 93 and 94:
16,024 13,241 11,854 10,4317,984Sec
- Page 95 and 96:
Section Apatents, utility models an
- Page 97 and 98:
Section Apatents, utility models an
- Page 99 and 100:
Section btrademarkssection btradema
- Page 101 and 102: Section btrademarksWithin the inter
- Page 103 and 104: Section btrademarksFigure B.1.1.4 R
- Page 105 and 106: Section btrademarksFigure B.1.2.3 C
- Page 107 and 108: Section btrademarksAs mentioned pre
- Page 109 and 110: Section btrademarksFigure B.2.1.2 T
- Page 111 and 112: Section btrademarksFigure B.2.1.5 T
- Page 113 and 114: Section btrademarksFigure B.2.2.2 C
- Page 115 and 116: Section btrademarksFigure B.3.1 Nic
- Page 117 and 118: Section btrademarksB.4Trademark app
- Page 119 and 120: Section btrademarksTo establish a d
- Page 121 and 122: Section btrademarksFigure B.5.1 Nic
- Page 123 and 124: Section btrademarksmark in each of
- Page 125 and 126: Section btrademarksB.6.3 Registrati
- Page 127 and 128: Section btrademarksB.6.5 Madrid app
- Page 129 and 130: Section btrademarksFigure B.6.6.2 p
- Page 131 and 132: 476,726 476,687 461,713423,940Secti
- Page 133 and 134: Section cindustrial designssection
- Page 135 and 136: Section cindustrial designsFigure C
- Page 137 and 138: Section cindustrial designsC.1.2 Re
- Page 139 and 140: Section cindustrial designsdesign c
- Page 141 and 142: Section cindustrial designsTable C.
- Page 143 and 144: Section cindustrial designsFigure C
- Page 145 and 146: Section cindustrial designsC.3.2 In
- Page 147 and 148: Section cindustrial designsFigure C
- Page 149 and 150: Section cindustrial designsFigure C
- Page 151: Section DPlant variety protectionse
- Page 155 and 156: Section DPlant variety protectionD.
- Page 157 and 158: Section DPlant variety protectionFi
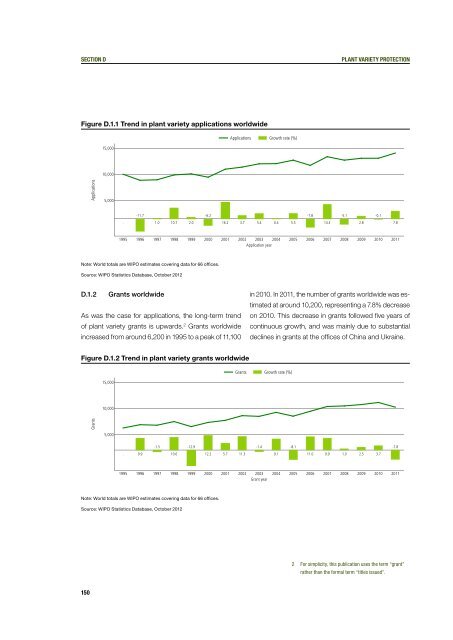
- Page 159: SectIOn DPlant varIEty protectIOnD.
- Page 162 and 163: annex bAnnex BInternational classif
- Page 164 and 165: annex bClass groups defined by Edit
- Page 166 and 167: glossaryContracting Party (Hague me
- Page 168 and 169: glossaryInternational Patent Classi
- Page 170 and 171: glossaryPCT International Applicati
- Page 172 and 173: glossaryWorld Intellectual Property
- Page 174 and 175: statistical tables - patentsstatist
- Page 176 and 177: statistical tables - patentsNameApp
- Page 178 and 179: statistical tables - patentsTable P
- Page 180 and 181: statistical tables - patentsNameGra
- Page 182 and 183: statistical tables - trademarksName
- Page 184 and 185: statistical tables - trademarksName
- Page 186 and 187: statistical tables - trademarksName
- Page 188 and 189: statistical tables - trademarksName
- Page 190 and 191: statistical tables - industrial des
- Page 192 and 193: statistical tables - industrial des
- Page 194 and 195: statistical tables - industrial des
- Page 196: statistical tables - plant varietyN