World Intellectual Property Indicators - 2012 Edition - SIPO
World Intellectual Property Indicators - 2012 Edition - SIPO
World Intellectual Property Indicators - 2012 Edition - SIPO

You also want an ePaper? Increase the reach of your titles
YUMPU automatically turns print PDFs into web optimized ePapers that Google loves.
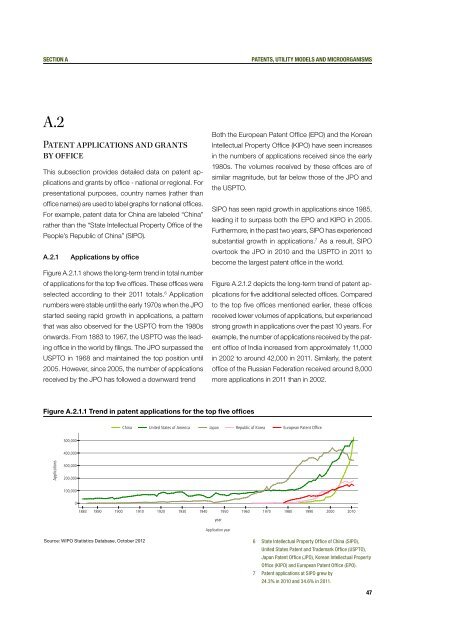
Section Apatents, utility models and microorganismsA.2Patent applications and grantsby officeThis subsection provides detailed data on patent applicationsand grants by office - national or regional. Forpresentational purposes, country names (rather thanoffice names) are used to label graphs for national offices.For example, patent data for China are labeled “China”rather than the “State <strong>Intellectual</strong> <strong>Property</strong> Office of thePeople’s Republic of China” (<strong>SIPO</strong>).A.2.1Applications by officeFigure A.2.1.1 shows the long-term trend in total numberof applications for the top five offices. These offices wereselected according to their 2011 totals. 6 Applicationnumbers were stable until the early 1970s when the JPOstarted seeing rapid growth in applications, a patternthat was also observed for the USPTO from the 1980sonwards. From 1883 to 1967, the USPTO was the leadingoffice in the world by filings. The JPO surpassed theUSPTO in 1968 and maintained the top position until2005. However, since 2005, the number of applicationsreceived by the JPO has followed a downward trendBoth the European Patent Office (EPO) and the Korean<strong>Intellectual</strong> <strong>Property</strong> Office (KIPO) have seen increasesin the numbers of applications received since the early1980s. The volumes received by these offices are ofsimilar magnitude, but far below those of the JPO andthe USPTO.<strong>SIPO</strong> has seen rapid growth in applications since 1985,leading it to surpass both the EPO and KIPO in 2005.Furthermore, in the past two years, <strong>SIPO</strong> has experiencedsubstantial growth in applications. 7 As a result, <strong>SIPO</strong>overtook the JPO in 2010 and the USPTO in 2011 tobecome the largest patent office in the world.Figure A.2.1.2 depicts the long-term trend of patent applicationsfor five additional selected offices. Comparedto the top five offices mentioned earlier, these officesreceived lower volumes of applications, but experiencedstrong growth in applications over the past 10 years. Forexample, the number of applications received by the patentoffice of India increased from approximately 11,000in 2002 to around 42,000 in 2011. Similarly, the patentoffice of the Russian Federation received around 8,000more applications in 2011 than in 2002.Figure A.2.1.1 Trend in patent applications for the top five officesChina United States of America Japan Republic of Korea European Patent Office500,000400,000Applications300,000200,000100,00001883 1890 1900 1910 1920 1930 1940 1950 1960 1970 1980 1990 2000 2010yearApplication yearSource: WIPO Statistics Database, October <strong>2012</strong>6 State <strong>Intellectual</strong> <strong>Property</strong> Office of China (<strong>SIPO</strong>),United States Patent and Trademark Office (USPTO),Japan Patent Office (JPO), Korean <strong>Intellectual</strong> <strong>Property</strong>Office (KIPO) and European Patent Office (EPO).7 Patent applications at <strong>SIPO</strong> grew by24.3% in 2010 and 34.6% in 2011.47