World Intellectual Property Indicators - 2012 Edition - SIPO
World Intellectual Property Indicators - 2012 Edition - SIPO
World Intellectual Property Indicators - 2012 Edition - SIPO
You also want an ePaper? Increase the reach of your titles
YUMPU automatically turns print PDFs into web optimized ePapers that Google loves.
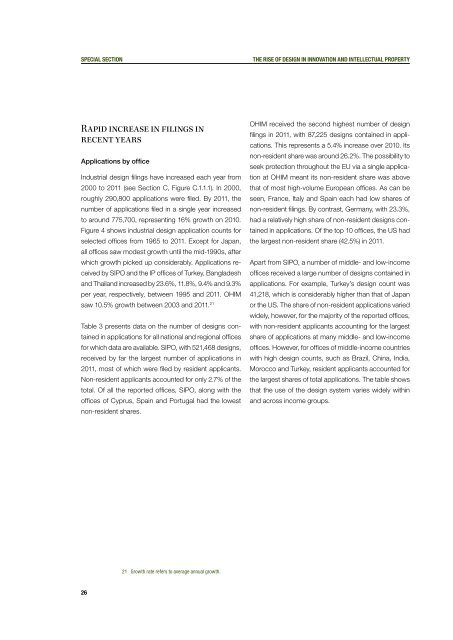
special Sectionthe rise of Design IN Innovation and INtellectual <strong>Property</strong>Rapid increase in filings inrecent yearsApplications by officeIndustrial design filings have increased each year from2000 to 2011 (see Section C, Figure C.1.1.1). In 2000,roughly 290,800 applications were filed. By 2011, thenumber of applications filed in a single year increasedto around 775,700, representing 16% growth on 2010.Figure 4 shows industrial design application counts forselected offices from 1965 to 2011. Except for Japan,all offices saw modest growth until the mid-1990s, afterwhich growth picked up considerably. Applications receivedby <strong>SIPO</strong> and the IP offices of Turkey, Bangladeshand Thailand increased by 23.6%, 11.8%, 9.4% and 9.3%per year, respectively, between 1995 and 2011. OHIMsaw 10.5% growth between 2003 and 2011. 21Table 3 presents data on the number of designs containedin applications for all national and regional officesfor which data are available. <strong>SIPO</strong>, with 521,468 designs,received by far the largest number of applications in2011, most of which were filed by resident applicants.Non-resident applicants accounted for only 2.7% of thetotal. Of all the reported offices, <strong>SIPO</strong>, along with theoffices of Cyprus, Spain and Portugal had the lowestnon-resident shares.OHIM received the second highest number of designfilings in 2011, with 87,225 designs contained in applications.This represents a 5.4% increase over 2010. Itsnon-resident share was around 26.2%. The possibility toseek protection throughout the EU via a single applicationat OHIM meant its non-resident share was abovethat of most high-volume European offices. As can beseen, France, Italy and Spain each had low shares ofnon-resident filings. By contrast, Germany, with 23.3%,had a relatively high share of non-resident designs containedin applications. Of the top 10 offices, the US hadthe largest non-resident share (42.5%) in 2011.Apart from <strong>SIPO</strong>, a number of middle- and low-incomeoffices received a large number of designs contained inapplications. For example, Turkey’s design count was41,218, which is considerably higher than that of Japanor the US. The share of non-resident applications variedwidely, however, for the majority of the reported offices,with non-resident applicants accounting for the largestshare of applications at many middle- and low-incomeoffices. However, for offices of middle-income countrieswith high design counts, such as Brazil, China, India,Morocco and Turkey, resident applicants accounted forthe largest shares of total applications. The table showsthat the use of the design system varies widely withinand across income groups.21 Growth rate refers to average annual growth.26


