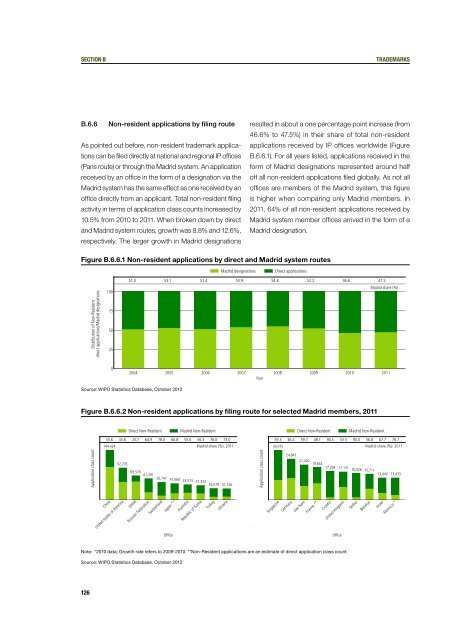
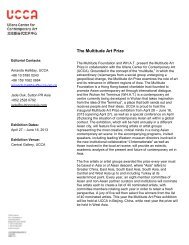
Section BtrademarksB.6.6 Non-resident applications by filing routeAs pointed out before, non-resident trademark applicationscan be filed directly at national and regional IP offices(Paris route) or through the Madrid system. An applicationreceived by an office in the form of a designation via theMadrid system has the same effect as one received by anoffice directly from an applicant. Total non-resident filingactivity in terms of application class counts increased by10.5% from 2010 to 2011. When broken down by directand Madrid system routes, growth was 8.8% and 12.6%,respectively. The larger growth in Madrid designationsresulted in about a one percentage point increase (from46.6% to 47.5%) in their share of total non-residentapplications received by IP offices worldwide (FigureB.6.6.1). For all years listed, applications received in theform of Madrid designations represented around halfoff all non-resident applications filed globally. As not alloffices are members of the Madrid system, this figureis higher when comparing only Madrid members. In2011, 64% of all non-resident applications received byMadrid system member offices arrived in the form of aMadrid designation.Figure B.6.6.1 Non-resident applications by direct and Madrid system routesMadrid designationsDirect applicationsDistribution of Non-Residentdirect applications/Madrid designations10075502551.0 53.1 51.4 53.9 54.8 52.2 46.6 47.5Madrid share (%)02004 2005 2006 2007 2008 2009 2010 2011YearSource: WIPO Statistics Database, October <strong>2012</strong>Figure B.6.6.2 Non-resident applications by filing route for selected Madrid members, 2011Direct Non-ResidentMadrid Non-ResidentDirect Non-ResidentMadrid Non-Resident33.6 43.8 23.7 64.9 78.0 60.8 55.0 56.3 76.6 73.0144,424Madrid share (%): 201159.3 46.4 59.7 48.1 90.5 53.5 90.0 56.8 67.7 76.730,075Madrid share (%): 2011Application class count92,70369,576 61,29150,747 47,060 43,573 41,433 32,678 31,726Application class count24,84321,420 19,64317,294 17,131 16,026 15,71113,442 13,433ChinaUnited States of AmericaOHIMRussian FederationSwitzerlandJapan **AustraliaRepublic of KoreaTurkeyUkraine. SingaporeGermanyViet NamFrance **CroatiaUnited KingdomSerbiaBeneluxIsraelMorocco *OfficeOfficeNote: *2010 data; Growth rate refers to 2009-2010. **Non-Resident applications are an estimate of direct application class count.Source: WIPO Statistics Database, October <strong>2012</strong>126
Section btrademarksFigure B.6.6.2 presents the share of Madrid designationsin total non-resident application class counts for selectedMadrid members. The share of non-resident applicationclass counts resulting from designations via the Madridsystem varies across offices. In 2011, 15 of the top 20offices shown received more than half of their trademarkfiling activity from abroad through designations via theMadrid system, with some offices receiving upwards of70 to 90 percent.The top four offices in terms of non-resident applicationclass counts – China, the US, OHIM and the RussianFederation – received between 24% and 65% of theirnon-resident applications via Madrid designations.B.7Trademark application classcount per GDP and populationDifferences in trademark activity across economies reflect,to a large extent, their size and level of development.For purposes of cross-country comparison, it is instructiveto measure resident trademark activity by applicationclass count relative to domestic GDP or population level.Figures B.7.1 and B.7.2 present the resulting trademarkactivity intensity indicators for selected countries.When resident trademark applications are correctedfor by equivalent class counts and adjusted by GDP,countries with lower numbers of resident applications(e.g., Madagascar and Uruguay) can rank higher thansome countries that otherwise show higher numbersof resident applications (e.g., Germany and the US).Of these selected origins, Turkey, with 154, followedby Viet Nam, China and Switzerland (between 114 and154), exhibited among the highest resident applicationclass count-to-GDP ratios in 2011. For all other reportedorigins, the resident application class count-to-GDP ratiovaried from 23 in Singapore to 103 in Madagascar, withthe world average at 69 - up from 58 in 2006. In fact,the majority of the selected origins for which residentapplication class count data exist for 2006 and 2011, hadhigher ratios in 2011 than in 2006, the Russian Federationexhibiting the largest increase of 20. A notable exceptionis the Republic of Korea, with a ratio that decreased by21 between 2006 and 2011.Figure B.7.1 Resident trademark application class count per GDP for selected origins, 2011.. .. 111 101 107 118 .. 93 83 .. 51 58 67 67 .. 33 40 47 23 ..Resident application class countper GDP (2005 PPP $)154131 1281141039791 88 888071 69 69 66Resident application class count per GDP: 2006594841 4024 23TurkeyViet NamChinaSwitzerlandMadagascarRepublic of KoreaUruguayAustraliaGermanyFinlandRussian Federation<strong>World</strong>SpainPolandCanadaMexicoColombiaSouth AfricaUnited States of AmericaSingaporeOriginNote: ‘..’ = not available; GDP data are in constant 2005 purchasing power parity (PPP) dollars. This graph does not provide an overall ranking of all origins, buta selection across geographical regions and income groups.Source: WIPO Statistics Database, October <strong>2012</strong>127
- Page 3:
WIPO Economics & Statistics Series2
- Page 6 and 7:
acknowledgementsWorld Intellectual
- Page 8 and 9:
HighlightsPatents & utility modelsM
- Page 10:
HighlightsTrademarksRecord number o
- Page 13 and 14:
data descriptionWhere an office pro
- Page 15 and 16:
table of contentsA.7 70Patents by f
- Page 17 and 18:
table of contentssection cIndustria
- Page 19:
table of contentsannex, glossary an
- Page 22 and 23:
special Sectionthe rise of Design I
- Page 24 and 25:
special Sectionthe rise of Design I
- Page 26 and 27:
special Sectionthe rise of Design I
- Page 28 and 29:
special Sectionthe rise of Design I
- Page 30 and 31:
special Sectionthe rise of Design I
- Page 32 and 33:
special Sectionthe rise of Design I
- Page 34 and 35:
special Sectionthe rise of Design I
- Page 36 and 37:
special Sectionthe rise of Design I
- Page 38 and 39:
special Sectionthe rise of Design I
- Page 40 and 41:
Overview of IP ActivitiesTable 1: O
- Page 43 and 44:
Section Apatents, utility models an
- Page 45 and 46:
Section Apatents, utility models an
- Page 47 and 48:
Section Apatents, utility models an
- Page 49 and 50:
Section Apatents, utility models an
- Page 51 and 52:
Section Apatents, utility models an
- Page 53 and 54:
Section Apatents, utility models an
- Page 55 and 56:
Section Apatents, utility models an
- Page 57 and 58:
Section Apatents, utility models an
- Page 59 and 60:
Section Apatents, utility models an
- Page 61 and 62:
Section Apatents, utility models an
- Page 63 and 64:
Section Apatents, utility models an
- Page 65 and 66:
Section Apatents, utility models an
- Page 67 and 68:
Section Apatents, utility models an
- Page 69 and 70:
Section Apatents, utility models an
- Page 71 and 72:
Section Apatents, utility models an
- Page 73 and 74:
Section Apatents, utility models an
- Page 75 and 76:
Section Apatents, utility models an
- Page 77 and 78: Section Apatents, utility models an
- Page 79 and 80: Section Apatents, utility models an
- Page 81 and 82: Section Apatents, utility models an
- Page 83 and 84: Section Apatents, utility models an
- Page 85 and 86: Section Apatents, utility models an
- Page 87 and 88: Section Apatents, utility models an
- Page 89 and 90: Section Apatents, utility models an
- Page 91 and 92: Section Apatents, utility models an
- Page 93 and 94: 16,024 13,241 11,854 10,4317,984Sec
- Page 95 and 96: Section Apatents, utility models an
- Page 97 and 98: Section Apatents, utility models an
- Page 99 and 100: Section btrademarkssection btradema
- Page 101 and 102: Section btrademarksWithin the inter
- Page 103 and 104: Section btrademarksFigure B.1.1.4 R
- Page 105 and 106: Section btrademarksFigure B.1.2.3 C
- Page 107 and 108: Section btrademarksAs mentioned pre
- Page 109 and 110: Section btrademarksFigure B.2.1.2 T
- Page 111 and 112: Section btrademarksFigure B.2.1.5 T
- Page 113 and 114: Section btrademarksFigure B.2.2.2 C
- Page 115 and 116: Section btrademarksFigure B.3.1 Nic
- Page 117 and 118: Section btrademarksB.4Trademark app
- Page 119 and 120: Section btrademarksTo establish a d
- Page 121 and 122: Section btrademarksFigure B.5.1 Nic
- Page 123 and 124: Section btrademarksmark in each of
- Page 125 and 126: Section btrademarksB.6.3 Registrati
- Page 127: Section btrademarksB.6.5 Madrid app
- Page 131 and 132: 476,726 476,687 461,713423,940Secti
- Page 133 and 134: Section cindustrial designssection
- Page 135 and 136: Section cindustrial designsFigure C
- Page 137 and 138: Section cindustrial designsC.1.2 Re
- Page 139 and 140: Section cindustrial designsdesign c
- Page 141 and 142: Section cindustrial designsTable C.
- Page 143 and 144: Section cindustrial designsFigure C
- Page 145 and 146: Section cindustrial designsC.3.2 In
- Page 147 and 148: Section cindustrial designsFigure C
- Page 149 and 150: Section cindustrial designsFigure C
- Page 151 and 152: Section DPlant variety protectionse
- Page 153 and 154: Section DPlant variety protectionD.
- Page 155 and 156: Section DPlant variety protectionD.
- Page 157 and 158: Section DPlant variety protectionFi
- Page 159: SectIOn DPlant varIEty protectIOnD.
- Page 162 and 163: annex bAnnex BInternational classif
- Page 164 and 165: annex bClass groups defined by Edit
- Page 166 and 167: glossaryContracting Party (Hague me
- Page 168 and 169: glossaryInternational Patent Classi
- Page 170 and 171: glossaryPCT International Applicati
- Page 172 and 173: glossaryWorld Intellectual Property
- Page 174 and 175: statistical tables - patentsstatist
- Page 176 and 177: statistical tables - patentsNameApp
- Page 178 and 179:
statistical tables - patentsTable P
- Page 180 and 181:
statistical tables - patentsNameGra
- Page 182 and 183:
statistical tables - trademarksName
- Page 184 and 185:
statistical tables - trademarksName
- Page 186 and 187:
statistical tables - trademarksName
- Page 188 and 189:
statistical tables - trademarksName
- Page 190 and 191:
statistical tables - industrial des
- Page 192 and 193:
statistical tables - industrial des
- Page 194 and 195:
statistical tables - industrial des
- Page 196:
statistical tables - plant varietyN