Download Now - Hyndburn Borough Council
Download Now - Hyndburn Borough Council
Download Now - Hyndburn Borough Council
Create successful ePaper yourself
Turn your PDF publications into a flip-book with our unique Google optimized e-Paper software.
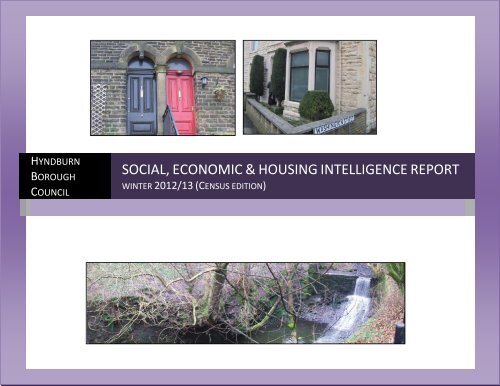
HYNDBURNBOROUGHCOUNCILSOCIAL, ECONOMIC & HOUSING INTELLIGENCE REPORTWINTER 2012/13 (CENSUS EDITION)
Winter 2012/13SOCIAL, ECONOMIC & HOUSING INTELLIGENCE REPORTPurposeThis paper provides up to date data and analysis of <strong>Hyndburn</strong>‟seconomy and housing market. The commentary reflects current trendsand indicators that are affecting the market, and provides reflection onthe national picture, including new Government Policy and funding. It isproduced bi-annually, updating information with the latest statistics andfocussing on current trends affecting the regeneration of the borough.At a local level the paper provides a snapshot of the current marketwith key statistics and market intelligence informing the reader howwell <strong>Hyndburn</strong> is performing in comparisons with Pennine Lancashire,the North West and nationally.The audience to this paper includes <strong>Council</strong> departments, ElectedMembers, partner organisations in the public, private and voluntarysector, and the general public. The information can be reproduced,subject to referencing the source. For further information please do nothesitate to contact Stuart Sambrook(stuart.sambrook@hyndburnbc.gov.uk ).1
Winter 2012/13SOCIAL, ECONOMIC & HOUSING INTELLIGENCE REPORTINDEXSectionsPageSectionsPagePurpose 1KEY MESSAGES 3Introduction 6PEOPLEPopulation 7Households 8LABOUR MARKETUnemployment 9Poverty Levels 11Economy 12CENSUSHOUSINGHousing 15West Accrington Profile 16Private Rented Sector 18Housing Market 19Property Values 20Vacant Dwellings 22Innovative Housing Partnership 23House Type 24New Build 25Repossessions 26Census 2011 Findings 13STATISTICSWard Analysis 272
Winter 2012/13SOCIAL, ECONOMIC & HOUSING INTELLIGENCE REPORTKey MessagesThe first Census estimate using the 2011 data shows <strong>Hyndburn</strong>the highest levels at 10.1% in East Lancashire, and Ribblepopulation has declined by 1% since the last Census in 2001,Valley the lowest with 3.7%. In the North West Manchester hasbut up on the 1991 Census findings. (Page 7 more info)the highest proportion with 12.8%. (Page 9 more info)Population in <strong>Hyndburn</strong> stands at 80,700 (Census 2011) downfrom it‟s peak in 2006 at 82,200 (Office for National StatisticsThe proportion of claimants gaining job seekers allowance (JSA)in <strong>Hyndburn</strong> stands at 3.7% just below the national average ofmid year estimates 2006). (Page 7 more info)3.8%. Blackpool has the highest proportion in Lancashire withThe latest Census data shows an increased proportion of peoplein the working age band, and lower proportion in the under6.5%, with Burnley the highest proportion in east Lancashirewith 5.1%. (Page 9 more info)15‟s. However, in 2011 there is a slight higher proportion ofAcross the North West the average JSA is 4.3%. Across allunder 5‟s compared with 2001. (Page 8 more info)wards in <strong>Hyndburn</strong> the ward of Spring Hill has the highestLatest data received from the 2011 Census indicate the numberof households has increased from 33,000 in 2001 upto 34,300in 2011. (Page 8 more info)proportion with 7.5% (November 2012), followed by Centralward at 6.5% down to St.Oswald‟s and Baxenden with 1.1%being the lowest. (Page 9 more info) Average household size in <strong>Hyndburn</strong> is 2.34, compared to 2.4across England and Wales, 2.54 in Blackburn with Darwen. Backin 1911 the average across the country was 4.3 people perhousehold (Page 8 more info) Four fifths (81.6%) of <strong>Hyndburn</strong>‟s working age population areEconomically Active, slightly higher than the North West figureof 75.3%, and the national figure of 76.5%. (Page 9 more info) Unemployment figures in <strong>Hyndburn</strong> (7.4%) is lower thanneighbouring authorities, with Blackburn with Darwen havingIn a recent study <strong>Hyndburn</strong> has been identified with highproportion of households in danger of slipping under thebreadline. Experian found <strong>Hyndburn</strong> was second on a list of LA'sacross the country with 30% of all households (10,248) on theedge of poverty. (Page 11 more info)Private rented tenure stands at approximately 21% across<strong>Hyndburn</strong>, significantly higher than the national average ofaround 12-15%. (Page 18 more info)3
Winter 2012/13SOCIAL, ECONOMIC & HOUSING INTELLIGENCE REPORTImpact on <strong>Hyndburn</strong> – change over the past two yearsPositive Neither Negative Mortgage costs Interest Rates Affordability Rough Sleepers Average earnings Sales figures Dwelling Vacancy levels Deposit needed for FTBs Life expectancy Housebuilding industry / <strong>Hyndburn</strong> Average House Prices / Worklessness Unemployment Repossessions Business start ups Migration numbers Population projections Household projections5
Winter 2012/13SOCIAL, ECONOMIC & HOUSING INTELLIGENCE REPORTIntroductionIncreasing the volume of new homes is a key Government priority. Notonly is new supply needed to keep pace with an ever growing numberof households, but house building and construction play an importantrole in the wider economy. Yet new private housing starts remain low -well below the levels needed to meet demand. <strong>Hyndburn</strong>‟s level is atit‟s lowest since the <strong>Council</strong> started monitoring this information, andwithout the Keepmoat / <strong>Council</strong> development on Blackburn Roadfocussed in the last report new build would have been significantlylower.Housing starts are considerably lower than they were at their peak,with completions at a similar low level. At the same time average pricesare 20% lower than they were a few years back, whilst the lower endmarket (lower quartile properties) have started to catch up withinvestment portfolios and landlords buying up low value propertieshoping to maximize on their rental yield. Previously first time buyerswould be purchasing those types of properties, but with financialinstitutions reluctant to provide mortgages without large deposits andgood credit ratings households are struggling to gain enough finance.In the face of a weak economy and ongoing uncertainty, the sector hastaken a low-risk approach with an emphasis on margins over volumes.Lower levels of grant funding for affordable housing, land viabilitychallenges and planning reforms all add to an already complex picture.Empty properties over this period have not changed, in <strong>Hyndburn</strong> thereis approximately 2,500 empty dwellings and this has not changed overthe past few years even with the low number of new builds and nearly500 demolitions in recent years. This emphasizes the need for differenthousing type and a more of a variety of housing mix available in<strong>Hyndburn</strong>. A large proportion of the empty dwellings are 2 bedroompre 1919 terraced dwellings.Bringing empty properties back into use is a high priority for theGovernment and demolition is discouraged. <strong>Hyndburn</strong> has just beensuccessfully in gaining two separate funding streams. The first bid wasin conjunction with Twin Valley Homes and secured £645,000 to bring45 dwellings back into use. The second empty property funding bidsecured £3.828 million to bring back into use 139 empty properties inthe Woodnook area and the bid has been match funded by privatefinance and therefore will be at least £7.656 million.Over the last few years real household income growth has been heavilysqueezed and within the last two years inflation has eroded the valueof disposable incomes. Lower inflation in 2012 and 2013 should help toboost real incomes but only to a small degree. The economy is notexpected to return to 2008 peak until 2015 at the earliest. Modesttrend growth and a very subdued consumer are likely too be a long6
Winter 2012/13term feature of the UK economy, rebalancing the economy comes at aprice.Only time will tell how quickly <strong>Hyndburn</strong> will recover, and will therecovery be in line with everywhere else or will it have longerdetrimental effects on <strong>Hyndburn</strong> over the long termSOCIAL, ECONOMIC & HOUSING INTELLIGENCE REPORTPopulationThe first Census estimate using the 2011 data shows <strong>Hyndburn</strong>population has declined by 1% since the last Census in 2001, but up onthe 1991 Census findings. (We look at the Census 2011 findings inmore detail at the end of this section).This newsletter reflects on these changes and current trends whilstadding commentary at local, regional and at national level. Below islisted some of the topic area the newsletter will cover in more detail: Population Households Employment Poverty levels Low Demand Housing Private Rented Sector Property Prices Empty Homes Census 2011 findings West Accrington Housing statisticsPopulation in <strong>Hyndburn</strong> stands at 80,700 (Census 2011) down from it‟speak in 2006 at 82,200 (Office for National Statistics mid yearestimates 2006). The ONS mid year estimates were based on aestimate and a calculation, plus a recent a change in how these figureshave been calculated have lead to a reduction due to a change ininternational and student figures.The population of England and Wales has grown by 3.7 million in the10 years since the last census, rising from 52.4 million in 2001 to56.1m in 2011, an increase of 7.1 per cent. This was the largest growthin the population in any 10-year period since census taking began, in1801.The table below provides some headline information received from firstwave of data analysis received from Census 2011 and showspopulation breakdown using Census 2011 data in comparison with thelast (Office of National Statistics) ONS 2010 mid-year populationestimates.7
Winter 2012/13Labour MarketFour fifths (81.6%) of <strong>Hyndburn</strong>‟s working age population areEconomically Active, slightly higher than the North West figure of75.3%, and the national figure of 76.6%.The latest available figures (June 2012) shows <strong>Hyndburn</strong>unemployment at 7.4% (3,200), achieving a slight fall on the previousquarter that had reached a peak of 7.7%. The highest levels ofunemployment was achieved in March 2010 at 8.5%; however theactual numbers have not changed but due to the higher number ofpeople who are now classed as economically active the proportionshave fallen.Table 2.Unemployment levelsDistrict Unemployment (%) Unemployment (Number)Blackburn with Darwen 10.1% 6,100Burnley 8.5% 3,700<strong>Hyndburn</strong> 7.4% 3,200Pendle 8.7% 3,500Rossendale 8.3% 2,900Ribble Valley 3.7% 1,200Source: ONS Annual Population SurveyIn comparison, unemployment figures for June 2012 stand at 8.8%across the North West, and 8.1% for the rest of the country. Whilstfigures in <strong>Hyndburn</strong> have fallen over the last quarter, across the NorthWest and the rest of the country figures have carried on rising.SOCIAL, ECONOMIC & HOUSING INTELLIGENCE REPORT10.1% in East Lancashire, and Ribble Valley the lowest with 3.7%. Inthe North West Manchester has the proportion of 12.8%.Table 3.Unemployment levelsDistrict 2012 2011 2010 2009 2008Blackburn with Darwen 10.1% 8.9% 10.2% 7.7% 6.2%Burnley 8.5% 7.3% 9.3% 7.4% 7.0%<strong>Hyndburn</strong> 7.4% 6.7% 8.5% 7.8% 6.2%North West 8.8% 7.8% 8.8% 6.9% 5.8%Great Britain 8.1% 7.6% 7.9% 6.2% 5.2%Source: ONS Annual Population SurveyThe percentage of the Eurozone workforce out of work reached arecord high of 11.8% in November, according to Eurostat. Thesefigures indicate a marked split between Northern and SouthernEuropean countries, with the highest jobless rates recorded by Spain(26.6%) and Greece (26%, based on September 2012 figures).Conversely, the lowest rates were in Austria (4.5%), Luxembourg(5.1%), Germany (5.4%) and the Netherlands (5.6%).Figure 1 below shows the proportion of claimants gaining job seekersallowance (JSA) in November 2012. As can be seen <strong>Hyndburn</strong>proportion stands at 3.7% just above the national average of 3.8%.Blackpool has the highest proportion in Lancashire with 6.5%, withBurnley the highest proportion in east Lancashire with 5.1%.Unemployment figures in <strong>Hyndburn</strong> are lower than neighbouringauthorities, with Blackburn with Darwen having the highest levels at9
Winter 2012/13SOCIAL, ECONOMIC & HOUSING INTELLIGENCE REPORTTable 4. Job Seekers Allowance (November 2012)WARD Proportion JSA Number JSAAltham 1.8% 69Barnfield 4.0% 117Baxenden 1.1% 27Central 6.5% 189Church 5.6% 162Clayton le Moors 2.8% 88Huncoat 3.1% 89Immanuel 3.0% 82Milnshaw 3.1% 82Netherton 5.1% 135Overton 2.2% 91Peel 6.1% 172Rishton 3.8% 167St Andrew‟s 3.8% 109St Oswalds 1.1% 49Spring Hill 7.5% 237HYNDBURN 3.7%Figure 1.Job Seekers Allowance Claimant CountAcross the North West the average is 4.3%. Across all wards in<strong>Hyndburn</strong> the ward of Spring Hill has the highest proportion with 7.5%(November 2012), followed by Central ward at 6.5% down toSt.Oswald‟s and Baxenden with 1.1% being the lowest. JSA tends to beseasonal with more people working at certain times of year in-particularin the run up to Christmas.Source: Nomis (Claimant count as proportion of resident working-age population (%).The chart above compares the proportion of residents of working ageclaiming job seekers allowance, with the <strong>Hyndburn</strong> bar coloured purplestanding at 3.7%, below the national and North West average buthigher than the Lancashire and majority of districts within Lancashire.10
Winter 2012/13Poverty LevelsIn a recent study <strong>Hyndburn</strong> has been identified with high proportion ofhouseholds in danger of slipping under the breadline. Experian found<strong>Hyndburn</strong> was second on a list of LA's across the country with 30% ofall households (10,248) on the edge of poverty.Experian who produce Mosiac data have mapped poverty informationacross the country. Across the country thousands of people live inpoverty, but the report highlights the amount of people who are mostat risk of slipping into poverty if things get any worse. Mosiac systemuses a combination of the company‟s data and social indicators tomeasure how economically „resilient‟ different areas are. To work outthe people most at risk, they removed households that are already inpoverty or on out of work benefits from the ranking.SOCIAL, ECONOMIC & HOUSING INTELLIGENCE REPORTTable 5. Areas at risk of falling into PovertyRanking LA % ofhouseholdson the edgeof povertyLow incomefamiliesoccupyingpoor qualityolderterracesOlderfamilies inlow valuehousing intraditionalindustrialOftenindebtedfamiliesliving in lowrise estates(%)(%) areas (%)1 Torbay 37% 4.6% 2.1% 7.8%2 <strong>Hyndburn</strong> 30% 18.8% 2.4% 1%10 BwD 28% 7.9% 2.9% 0.7%18 Pendle 27% 8.7% 4.3% 0.9%93 Burnley 27% 7.1% 3.6% 0.6%153 Rossendale 16% 6.5% 3.9% 1.9%236 Ribble Valley 12% 2.8% 0.2% 2.1%Source: Experian 2012In <strong>Hyndburn</strong>, 30% of all households fall into the „at risk‟ categoriesidentified by the research. In the case of <strong>Hyndburn</strong>, which is second onthe list for local authorities most at risk, the area has a high number ofSouth Asian communities experiencing social deprivation (7.5%) andlow income families occupying poor quality older terraces (18.8% of allhouseholds). List of neighbouring authorities information below.11
Winter 2012/13SOCIAL, ECONOMIC & HOUSING INTELLIGENCE REPORTBusiness DemographyIn 2011 there were 261,000 business births, that is new registrations,in the UK, a birth rate of 11.2 per cent (<strong>Hyndburn</strong> 10%). This wascompared with 235,000 in 2010, a birth rate of 10.0 per cent. In 2011nationally there was an 11.2% increase in the number of births on theprevious year, with <strong>Hyndburn</strong> showing a 14% rise; however this wasafter a 25% fall on numbers prior to 2009.Provisionally for 2011 there were 230,000 business deaths i.e. businessde-registrations, a death rate of 9.8 per cent nationally. This compareswith 250,000 business deaths in 2010 and a death rate of 10.6 percent. In 2011 there was a 7.9 per cent decrease in the number ofbusiness deaths. The North West had the highest business death rateat 10.7 per cent, whilst <strong>Hyndburn</strong> experienced a 10.4 business deathrate a slight rise on the previous year.Source: Business Demography 2011, ONSThe 2011 figures for Great Britain show that there were approaching2.3 million active enterprises, of which 231,345 were in the North West.<strong>Hyndburn</strong> stands at 2,395 experiencing a slight fall over the past fewyears. Over the past three years <strong>Hyndburn</strong> has experienced morebusiness deaths than births, explaining the fall in active enterprises. Ata national level, only 44.9% of enterprises born in 2006 were still activefive years later. Across Lancashire this figure is lower than 42.0%12
Winter 2012/13SOCIAL, ECONOMIC & HOUSING INTELLIGENCE REPORT2013.EthnicityReligionCensus 2011A second tranche of findings for England & Wales hasbeen released from the 2011 Census. Below are someof the key findings of the Office for National Statisticssurvey. More information will be released throughThe „White‟ population in <strong>Hyndburn</strong> (Including White British,White Irish, White Gypsy & Traveller and White Other) hasfallen from 91.7% in 2001 down to 87.6% in 2011. Thisincludes White Other and Gypsy and Travellers that could bedescribed as minority ethnic.Nationally 85.5% of the population describe themselves as„White‟, falling down from 90.9% back in 2001.The proportion of „Asian‟ population has grown from 7.6% in2001 upto 11% in 2011. This compares slightly higher than thenational figure of 7.7% - rising from 5% in 2001. The largest religious belief in <strong>Hyndburn</strong> is „Christian‟ with 66.4%(falling 9.9% since 2001), followed by „Muslim‟ with 10.3%(rising 3.1% since 2001). The biggest increase has been withthose stating „No religion‟ rising from 9.2% in 2001 upto 17% in2011.Those who stated „No religion‟ nationally rose from 14.6% in2001 upto 24.7% in 2011.Property TypeTenureThe proportion of „detached‟ properties and flats has slightlyincreased in the borough from 10.6% in 2001 upto 11.7% in2011. The proportion of „purpose built flats‟ has also increasedfrom 6.7% upto 7.5%. The borough is still significantlydominated by terraced housing with 52.6% in comparison with24.5% nationally.<strong>Hyndburn</strong>‟s „Private Rented stock‟ has risen from 7.9% upto18.1% in 2011 (ranked 76 th in the country out of 348 localauthorities). Across Lancashire private rented stock stands at15.1%, England & Wales it stands at 16.7%, 13.7% in theRibble Valley and 19.3% in Burnley.The proportion of people who „own a property with a mortgage‟has fallen from 48.3% in 2001 down to 34.3% in 2011, with theproportion of people „who own outright‟ staying the same overthe past decade.Central Heating5.2% of households in <strong>Hyndburn</strong> „do not have Central Heating‟(1,786 households) – this is the third highest in Lancashirebehind Pendle with 6% and Blackpool 5.5%. <strong>Hyndburn</strong> isranked 19 th highest in the country.Nationally 59.4% of the population would describe theirreligious beliefs as „Christian‟, falling down from 71.7% in 2001.13
Winter 2012/13SOCIAL, ECONOMIC & HOUSING INTELLIGENCE REPORTHouseholdsEmploymentIn 2011 <strong>Hyndburn</strong> had 34,341 households (32,979 in 2001) witha total population of 80,734 (81,470 in 2001) which comes toan average 2.3 household size in the borough; this is similar tothe national average of 2.4 people per household.<strong>Hyndburn</strong> is ranked 5 th highest for the proportion of „Male loneparents who are not in employment‟. The actual numbers arequite low 149 in comparison to 183 „Male lone parents inemployment‟.<strong>Hyndburn</strong> is ranked 15 th for the proportion of „workers workingin the manufacturing industry‟ with 16.9%.The largest employment sector in <strong>Hyndburn</strong> is the „Wholesaleand retail trade; repair of motor vehicles and motor cycles‟(broad range of employment sectors) with 18.4% of theworkforce ranked 40 th in the country.EducationNationally there are more people (27.4%) who have attained„Level 4‟ qualifications (equivalent to a Diploma or Certificate ofHigher Education) than those with „no qualifications‟ 22.5%.In <strong>Hyndburn</strong> there is a higher proportion (28%) with „noqualifications‟ compared to 18.9% with „Level 4 qualifications‟and above. However, this shows a 6.1% rise in Level 4qualifications over the past 10 years and a fall of 7.5% in thosewithout any qualifications.In Lancashire <strong>Hyndburn</strong> have the second highest rates ofpeople who have gained an „Apprenticeship‟ with 5.5%, justslightly lower than the South Ribble with 5.8% in comparisonwith 3.6% nationally and 3.9% across the North West.<strong>Hyndburn</strong> was ranked 8 th across all local authorities nationallyfor people who have gained an apprenticeship.14
Winter 2012/13Housing<strong>Hyndburn</strong> has a significant proportion of terraced stock, across the<strong>Borough</strong> 54.3% of dwellings are terraced and this is much higher in anumber of wards. This means that some areas will offer a limitedchoice of property type, whilst evidence confirms that different propertytypes recover from the recession at different rates. Larger familyproperties are not generally reliant on first time buyers for transactionsand therefore „ride out‟ the recession relatively smoothly and areas withgood quantities of family-sized housing stock correspond with the areasthat people with the highest skills levels and occupations generallywant to live.A limited supply of high-quality detached properties and family homesis likely to be one of the factors which affect s <strong>Hyndburn</strong>‟s ability toattract and retain high-end skills and occupations. As different propertytypes recover from the recession at different rates (generally semi anddetached larger properties recover more quickly and terracedproperties and flats more slowly) there will be a risk of even greaterhousing inequality where there are concentrations of different housingtypes. On the one hand there will be areas where house price and salesstagnate or even decline but on the other there will be issues ofaffordability in areas of high demand. Without intervention theinequality between local markets is likely to increase.SOCIAL, ECONOMIC & HOUSING INTELLIGENCE REPORTExisting dwellings have a key part to play in a balanced housingmarket, this is one of the key elements of Housing Strategy in the CoreStrategy with the Market Progression Model (MPM) to complement newhousing development. The MPM promotes housing growth, economiccompetitiveness and inclusion to achieve a balanced housing market.The role of Housing Market Renewal within <strong>Hyndburn</strong> was seen as anessential „policy on‟ approach to redress some of the market driverswithin the <strong>Borough</strong>. The current data records higher than usual vacantproperties, property prices that are consistently lower than inneighbouring areas and the number of sales had dropped dramaticallyduring the economic down turn. Whilst this offers a competitiveadvantage in affordability to potentially attract new households, it willbe difficult given the limited choice in property that is available to buy.15
Winter 2012/13SOCIAL, ECONOMIC & HOUSING INTELLIGENCE REPORTPROFILE – local residents perception on West AccringtonJanuary 2012 the <strong>Council</strong> carried out anEnvironmental Improvement survey in the WestAccrington area. The purpose of the survey wasto find out local people‟s perception on the areaafter all the regeneration work that had been carried out over the past10 years. A total of approximately 1200 properties were hand delivereda questionnaire asking for households opinions on their neighbourhood,property and whether they had invested on their property due to thework carried out by the <strong>Council</strong>. Overall therewas a good return of over 15% response ratewith a large proportion of positive commentsabout the work carried out and the perception ofthe area as people drive into West Accrington.Figure 4.current property?Over two thirds(71.6%) of responsesstated they weresatisfied with theirproperty, 11.5% statedneither satisfied nordissatisfied and 16%How satisfied or dissatisfied are you with yourHow satisfied or dissatisfied are you with your currentproperty?Fairly SatisfiedVery SatisfiedNeitherSatisfied NorDissatisifiedFairlyDissatisfiedVeryDissatisfiedNo Answersaid they were dissatisfied. 63.5% of residents said they were satisfiedwith their neighbourhood, 18% stated neither whilst 16.9% said theywere dissatisfied. There is a strong correlation with the streets that hadno work with more general dissatisfaction with their property and theneighbourhood.Nearly 6 out of 10 (57%) of respondents felt the Acorn Parkdevelopment had improved the area, with only 20% saying „No‟ thedevelopment did not make an improvement. The main commentsreceived was that the area seemed more cleaner, better housing, withBlackburn Road looking better. There was also some disappointmentwith residents at being left out of the regeneration work suggestingthose areas left out looked a mess.Figure 5. Who carried out the improvement work on yourproperty?Who carried out the improvement work on your property?The <strong>Council</strong>YourselfOtherNoneLandlordHousing AssoThe majority with 70%of respondents saidthey had improvementwork carried out ontheir property over thepast five years. 44%said the work carriedout was by themselves,with only 10% stating16
Winter 2012/13SOCIAL, ECONOMIC & HOUSING INTELLIGENCE REPORTthe work was carried out due to the regeneration work carried out bythe <strong>Council</strong> in their neighbourhood.Looking at the responses a range of works have been carried out onpeoples properties suggesting more properties in the area should bemeeting the decent home standard with less Category 1 & 2 hazards.Two thirds of the amount people had spent on the improvements wasover £1,000, with over a third (36.5%) of respondents believing thework carried out in the neighbourhood it had improved the value oftheir property.Of those questioned 63.5% had no intentions of moving home. Thosewho suggested they might move in the future suggested the generalenvironment, condition of the property, house too small, crime in theneighbourhood as the main reasons for wanting to move. A largeproportion of those people said they would like to move but wereunable to do so.Over a third (37.8%) felt the improvement works carried out helped tomake the area feel like a safer place to live, and 30.4% there had beenan improvement in reducing anti-social behaviour in the area.17
Winter 2012/13Private Rented SectorPrivate rented tenure stands at approximately 21% across <strong>Hyndburn</strong>,significantly higher than the national average of around 12-15%. Thispercentage has been on the rise over the last few years, especially soin <strong>Hyndburn</strong> where a reduction in house sales due to the economicdownturn and a low proportion of social housing has put extra pressureon the private rented sector to provide accommodation for those nolonger able to access owner occupation and for the more vulnerablehouseholds, especially those dependent on benefits.The rental market is highly segmented by price. This means there areoften different trends in different segments of the market. Across thecountry 25% of private tenants are on housing benefit, this isconsiderably higher in <strong>Hyndburn</strong> with around 44% with upto 50 – 60%in some areas. (Typically the bottom quartile is those in receipt of LocalHousing Allowance / housing benefit). Rental growth at this end of themarket will be influenced by the rent caps the government is putting inplace as part of its welfare reforms.Regulatory risk aside, Hometrack believe that affordability factors willcontinue to limit rental growth, despite the strong demand sidepressure. Hometrack expects rents to rise by 2-3% in 2012. Rentalyields have improved modestly since the top of the market and todayaverage 5.3% across the country, whilst slightly higher acrossSOCIAL, ECONOMIC & HOUSING INTELLIGENCE REPORTTable 6. Private Rented Households and those in receipt ofHousing BenefitWard(1)Number ofPrivateRented(2)PrivateRented(%)(3)NumberofHousingBenefit(4)HousingBenefit %proportionof PR(5)Percentageof HB of allstock(6)HouseholdsAltham 397 18.7% 167 42.1% 7.9% 2127Barnfield 511 25.7% 241 47.2% 12.1% 1991Baxenden 159 9.6% 37 23.3% 2.2% 1662Central 456 24.0% 221 48.5% 11.6% 1898Church 486 22.2% 249 51.2% 11.4% 2189CLM 448 22.5% 175 39.1% 8.8% 1990Huncoat 228 11.7% 83 36.4% 4.3% 1944Immanuel 317 16.0% 104 32.8% 5.2% 1985Milnshaw 312 16.6% 120 38.5% 6.4% 1881Netherton 636 31.8% 277 43.6% 13.9% 1999Overton 424 15.5% 135 31.8% 4.9% 2738Peel 800 37.5% 421 52.6% 19.7% 2133Rishton 723 24.2% 338 46.7% 11.3% 2988St.Andrews 457 22.7% 180 39.4% 8.9% 2017St Oswalds 276 10.6% 65 23.6% 2.5% 2602Spring Hill 577 28.1% 330 57.2% 16.0% 2057HYNDBURN 7207 21.1% 3146 43.6% 8.6% 34,201Source: <strong>Council</strong> Tax 2011(Key) The number of private rented stock by Ward, 2) Percentage of private rented stock perWard, 3) The number of households in receipt of Housing Benefits living in private rentedaccommodation, 4) The percentage of private rented households who are claiming HousingBenefits, 5) The percentage of all households claiming Housing Benefits whilst living in privaterented accommodation, 6) Total number of households by Ward)<strong>Hyndburn</strong> at levels in-between 6 to 7% with over 7% indicating morehigh risk low demand areas. Though better than low saving rates,investment in residential property is still motivated by expectation ofcapital growth. However, in <strong>Hyndburn</strong> with a high proportion on Local18
Winter 2012/13SOCIAL, ECONOMIC & HOUSING INTELLIGENCE REPORTHousing Allowance any changes will have significant impact on howmuch landlords will be able to charge their tenants.Long term voidsVisibly high incidence of properties for sale to letIn large parts of the country private tenants can‟t afford private rentswhilst private landlords can no longer afford tenants on benefits.<strong>Hyndburn</strong> is still affordable but people are still watching to see whatwill happen in the future under any changes to the welfare bill. Privaterents are rising on the back of growing tenant demand and staticsupply but the profile of growth varies across the market. One of theindicators of areas suffering with low housing demand is low incomelevels. An area with high proportion of households that are in receiptof housing benefit who live in private rented accommodation is a strongindicator of low housing demand.Housing MarketLarge parts of the <strong>Hyndburn</strong> area suffer with low housing demand, withthe Government defining these areas as having a number of thefollowing conditions: Predominant private housing Low property values in comparison with similar propertieselsewhere High turnover of population High proportion of private rented sectorNeighbourhoods suffering with these symptoms are considered tobe characterised by a long legacy of decline and de-industrialisationwhich has weakened local economies and led to high levels ofdeprivation, anti-social behaviour and poor public and privatefacilities.To tackle these problems <strong>Hyndburn</strong> has introduced SelectiveLicensing into the borough and designated parts of Accrington andChurch area. This came into force on the 1 st December 2012 withthe designated area covers approximately 5,000 properties, withover a third being private rented households. The area‟s designatedwere those areas suffering with, or those areas likely to fall into lowdemand if no intervention was carried out.The private rented sector performs an essential role in the<strong>Borough</strong>‟s market, offering flexibility and choice, with potential tosupport economic growth as well as meet housing needs. The<strong>Council</strong> wants to ensure that standards are high across the privaterented sector, especially in areas of low housing demand. SelectiveLicensing will form a part of a wider set of measures that seek toaddress the cause of low housing demand in parts of the <strong>Borough</strong>.19
Winter 2012/13SOCIAL, ECONOMIC & HOUSING INTELLIGENCE REPORTA series of indicators was compiled with the map below highlightingthe areas suffering the most across the borough.Figure 6. Housing Demand in <strong>Hyndburn</strong>Property Values<strong>Hyndburn</strong> has some of the lowest house values in the country, with theeighth lowest median property prices at £92,250 in comparison tonational figures of £180,000 and Lancashire average figures of£130,000. This also shows <strong>Hyndburn</strong> median property values are lessthan half (51.3%) of the national average and 70.9% the proportion ofthe North West and Lancashire median values.Figure 7. <strong>Hyndburn</strong> Ward Property Prices£160,000£140,000£120,000£100,000£80,000£60,000£40,000£20,000<strong>Hyndburn</strong> Ward Property Prices (2011)AverageMedianLQ£0AlthamBarnfieldBaxendenCentralChurchClayton-le-MoorsHuncoatImmanuelMilnshawNethertonOvertonPeelRishtonSpring HillSt Andrew'sSt Oswald's<strong>Hyndburn</strong>Source: Land Registry 2012The chart (Figure 7) shows the lower quartile, median and averageproperty value for each of the wards in <strong>Hyndburn</strong>. The green trianglerepresents the lower quartile value, the blue square represents the20
Winter 2012/13SOCIAL, ECONOMIC & HOUSING INTELLIGENCE REPORTmedian value and red diamond shape shows the average value. Thefurther the range between the markers highlights a varied marketwithin the ward. If the markers are all close, for example in the Central,Peel and Spring Hill area this shows similar stock and little housingoffer for the area.Figure 9.Figure 8 shows the typical lower quartile values (bottom 25 th percentile)for each of the words in <strong>Hyndburn</strong>.Figure 8. <strong>Hyndburn</strong> Lower Quartile Property Prices<strong>Hyndburn</strong> Lower Quarter Property Prices 2011£100,000£90,000£80,000£70,000£60,000£50,000£40,000£30,000£20,000£10,000Source: Land Registry 2012£0BarnfieldSpring HillPeelCentralNethertonClayton-le-Moors<strong>Hyndburn</strong>ChurchImmanuelRishtonSt Andrew'sMilnshawHuncoatAlthamOvertonSt Oswald'sBaxendenFigure 8 shows those areas with low value properties such as Peel,Spring Hill, Central and Barnfield upto those areas with high propertyvales such as Baxenden, St Oswalds, Overton and Altham.The map above (Figure 9) identifies median property values by lowersuper output areas with the blue areas highlighting the lowest medianvalues and the lighter areas highlighting the higher priced areas withinthe borough.21
Winter 2012/13SOCIAL, ECONOMIC & HOUSING INTELLIGENCE REPORTVacant DwellingsVacant dwellings, especially long term vacant dwellings, are a strongindicator of low housing demand especially where there areconcentrations of vacant dwellings. Long term vacant dwellings excludenormal turnover of dwellings for sale or rent.Figure 10.The Barnfield ward has the highest proportion of dwellings vacant forover 6 months with 14.1%. This is significantly higher when analysedat neighbourhood level and in particular around the area known asWoodnook. As mentioned in the introduction the Government‟s priorityis bringing empty properties back into use with demolition beingdiscouraged. <strong>Hyndburn</strong> has just been successfully in gaining twoseparate funding streams. The first bid was in conjunction with TwinValley Homes and secured £645,000 to bring 45 dwellings back intouse. The second empty property funding bid secured £3.828 million tobring back 139 empty properties in the Woodnook area and the bid hasbeen match funded by private finance and therefore will be at least£7.656 millionThe map (Figure 10) highlights the hot sports for private sector longterm vacants at LSOA level. Areas around Accrington and Church, partsof Rishton, Clayton and Great Harwood are the areas that suffer withthese symptoms, with Barnfield and Central having the highestproportion.22
Winter 2012/13SOCIAL, ECONOMIC & HOUSING INTELLIGENCE REPORTOn average, across <strong>Hyndburn</strong> the proportion of long term dwellingsstand at around 4.3% with six wards with a higher proportion. They areBarnfield (14.1%), Central (8.9%), Church 7.2%), Netherton (6.7%),Peel (7.9%) and Spring Hill (9.0%). On average, across the country theproportion of vacant dwellings empty over 6 months stands at around1.5% to 2%. The nearest ward to come near that is <strong>Hyndburn</strong> is theward of Baxenden with 2%.Figure 11.Woodnook remodelling of empty homesInnovative Housing Partnership to support growthPennine Lancashire creates strong public/private partnerships to deliverboth economic and housing growth. To meet aspirations PennineLancashire needs to grow a housing market which offers choice to arange of different households. In East Accrington, <strong>Hyndburn</strong> <strong>Borough</strong><strong>Council</strong> has joined forces with PlaceFirst and Together Housing Groupto attract funders who are willing to take a long term view oninvestment potential. The Woodnook project aims to create a newproduct for Pennine Lancashire, namely good quality market renthomes, well managed by a local registered provider. Good placemaking requires long term commitment both to the propertiesrefurbished and with communities to challenge preconceptions andembrace new ideas and thinking.“The value of this approach can be demonstrated through theWoodnook project where we are investing in excess of £6m in therefurbishment and remodelling of over 100 empty homes. At Woodnookwe have developed a long term institutional private rent model,delivered in partnership with the local authority and a local housingprovider. Together we will deliver much needed larger, energy efficienthomes. Under more traditional develop and dispose models, this kind oflong term approach would not have been possible.”Private sector partner, David Smith-Milne, from PlaceFirst23
Percentage of dwellingsWinter 2012/13House TypeWithin <strong>Hyndburn</strong> there are some notable variations in dwelling stock byward. For instance, the proportion of terraced dwellings exceeds 60%in Central and Peel wards; the proportions of detached houses arehighest in Altham (18.3%), Baxenden (19%) and Huncoat (16.9%).The proportion of flats is highest in Barnfield (17.2%), St. Andrews(15.1%), Church (13%), Immanuel (13.1%) and Huncoat (12%)wards. The proportion of bungalows is highest in Milnshaw (20.9%),Baxenden (19.6%) and Immanuel (18.1%).Table 7.No.BedsNo.BedsDwellingtypeHouse-TerracedSOCIAL, ECONOMIC & HOUSING INTELLIGENCE REPORTDwelling Type ProfileHouse-SemiHouse-Det Bung Flat Other TotalOne 270 20 600 2030 2920Two 14510 1070 170 1750 990 18490Three 4960 4950 1370 1050 120 12450Four 420 1500 1920NK 20 50 10 120 440 640Total 19760 6460 3090 3410 3260 440 36420Table%No.BedsDwellingtypeFigure 12.<strong>Hyndburn</strong> Housing TypeHouse-TerracedHouse-SemiHouse-Det Bung Flat Other Total100%90%80%70%60%50%40%30%20%10%0%Other/NKHouse Det 4 BedHouse Det 2-3 BedSemi 4BedSemi 3BedSemi 2BedTerraced House 3+ BedTerraced House 1-2 BedFlat 2+ BedsFlat 1 BedBungalowsOne 0.7 0.1 0.0 1.6 5.6 0.0 8.0Two 39.8 2.9 0.5 4.8 2.7 0.0 50.8Three 13.6 13.6 3.8 2.9 0.3 0.0 34.2Four 0.0 1.2 4.1 0.0 0.0 0.0 5.3NK 0.1 0.0 0.1 0.0 0.3 1.2 1.8Total 54.3 17.7 8.5 9.4 9.0 1.2 100.0Source: Valuation Office Agency August 2011New housing developments will aim to provide a mix of house typesbased on the following proportions identified in the SHMA (StrategicHousing Market Assessment 2009):WardData on the overall dwelling type profile of <strong>Hyndburn</strong> is presented inTable 7. Across the <strong>Borough</strong> 54.3% of dwellings are terraced, 17.7%are semi-detached, 8.5% are detached, 9.4% are bungalows and 9%are Flats.Detached 26%Semi-detached Housing 49%Terraced 5%Bungalows 8%Flat / maisonette 12%24
Winter 2012/13New BuildIn <strong>Hyndburn</strong>‟s Core Strategy provision has been made for 3200dwellings (net of demolition) during the period 2011-2026 and a fiveyear supply of deliverable sites for housing development will bemaintained. The housing requirements for <strong>Hyndburn</strong> is set out in theRSS. This sets out a requirement of 189 dwellings per annum for theperiod 2003-2021.The table below shows the new build completions for the past 10 yearsin <strong>Hyndburn</strong>.Table 8. New Build CompletionsYearNumber of completions2011/12 462010/11 802009/10 362008/09 1252007/08 1222006/07 1172005/06 3162004/05 1992003/04 1602002/03 176TOTAL 1377Source: Housing Flow Reconciliation 2012SOCIAL, ECONOMIC & HOUSING INTELLIGENCE REPORTIncreasing the volume of new homes is a key Government priority. Notonly is new supply needed to keep pace with an ever growing numberof households, but house building and construction play an importantrole in the wider economy. Yet new private housing starts remain low -well below the levels needed to meet demand. <strong>Hyndburn</strong>‟s level is atit‟s lowest since the <strong>Council</strong> started monitoring this information, andwithout the Keepmoat / <strong>Council</strong> development on Blackburn Roadfocussed in the last report new build would of been significantly lower.Housing starts are considerably lower than they were at their peak,with completions at a similar low level. At the same time average pricesare 20% lower than they were a few years back, whilst the lower endmarket (lower quartile properties) have started to catch up withinvestment portfolios and landlords buying up low value propertieshoping to maximize on their rental yield. Previously first time buyerswould be purchasing those types of properties, but with financialinstitutions reluctant to provide mortgages without large depositshouseholds are struggling to gain enough finance.In the face of a weak economy and ongoing uncertainty, the sector hastaken a low-risk approach with an emphasis on margins over volumes.Lower levels of grant funding for affordable housing, land viabilitychallenges and planning reforms all add to an already complex picture.25
PercentageWinter 2012/13SOCIAL, ECONOMIC & HOUSING INTELLIGENCE REPORTThere is a particular need to balance local housing markets byincreasing the variety of stock, in terms of house type, within the<strong>Borough</strong>‟s townships in accordance with the Strategic Housing MarketAssessment and Housing Needs Study. The housing offer has a largeproportion of small 2/3 bedroom terraced dwellings which account forover half the overall housing stock. Most of the properties also fallwithin <strong>Council</strong> Tax categories „A‟ and „B‟ with fewer housing within high„E‟ banding than the north-west and national average.On developments of 15 or more houses the developer will be requiredto make provision for 20% of the houses to be affordable. In meetingthis target consideration will be given to the availability of financialgrants and evidence on the economic viability of individualdevelopments.Repossession Hot SpotIn the last edition back-in 2011, we highlighted the research carried outby Shelter that identified areas where the highest proportion ofhomeowners who have been issued with a possession order for theirhome, and are therefore at serious risk of repossession. Experts werepredicting repossessions to rise with a threat of rises in interest rates, achallenging economy causing affordability difficulties.The research carried out by Shelter placed <strong>Hyndburn</strong> in a higher ratecategory with the area sitting 61 st out of 324 local authorities with 125possession orders over the previous twelve months. A year on theeconomy is still struggling, whilst interest rates have remained at thesame base rate.Figure 13. Mortgage possession claims leading to ordersMortgage possession claims leading to orders made per 1,000 households9876543210200220032004200520062007200820092010BurnleyBw DEngland & Wales<strong>Hyndburn</strong>LancashireNorth WestSource: PO rates Ministry of Justice statistics August 2012The previous year showed <strong>Hyndburn</strong> had 4 (3.94) per 1,000households with mortgage claims leading to possession orders. Thisfigure has now risen to 5 (4.85) per 1,000 households rising aboveBlackburn and Pendle levels to the same rate achieved in Burnley.Whilst these figures are significantly above the national average theyare considerably lower than the rates from 2008 a few years back.Pendle201126
Winter 2012/13SOCIAL, ECONOMIC & HOUSING INTELLIGENCE REPORTWard AnalysisLowerQuartilepropertyvaluesPrivatesectorLTvacantsPrivateSectorLongTermVacantsAveragerent(HousingBenefit)WardPrivateRentedTenureSocialHousingOwneroccupiedAveragepropertyvaluesAllvacantsPropertyRentalYieldJSA(Nov2012)TotalbenefitclaimantsHouseholdIncome2012Number ofpropertiesAltham 18.7% 9.0% 72.30% £73,000 £109,989 127 60 4.4% £452.50 4.94% 1.8% 15.3% £37,000 2293Barnfield 25.7% 20.4% 53.90% £32,500 £76,629 364 155 11.4% £408.91 6.40% 4.0% 25.2 £31-32,000 2360Baxenden 9.6% 3.0% 87.40% £100,000 £134,691 66 34 2.5% £483.54 4.31% 1.1% 8.1 £37-38,000 1708Central 24.0% 20.3% 55.70% £48,000 £60,147 229 141 10.3% £420.57 8.39% 6.5% 34.2 £23-24,000 2055Church 22.2% 26.9% 50.90% £61,500 £83,323 186 100 7.3% £415.47 5.98% 5.6% 30.1 £25,000 2146Clayton le Moors 22.5% 14.0% 63.50% £60,000 £102,187 124 70 5.1% £421.91 4.95% 2.8% 16 £34-35,000 2149Huncoat 11.7% 14.9% 73.40% £70,000 £109,398 113 38 2.8% £463.13 5.08% 3.1% 17.5 £35-36,000 2067Immanuel 16.0% 18.2% 65.80% £62,250 £115,845 101 46 3.4% £431.25 4.47% 3.0% 17 £33-34,000 2132Milnshaw 16.6% 21.6% 61.80% £68,000 £88,126 99 59 4.3% £458.21 6.24% 3.1% 19.4 £27-28,000 1989Netherton 31.8% 9.3% 58.90% £50,000 £87,419 174 103 7.5% £413.80 5.68% 5.1% 20.1 £27-28,000 2183Overton 15.5% 12.9% 71.60% £78,500 £124,665 151 80 5.9% £447.50 4.31% 2.2% 12.2 £35,500 2887Peel 37.5% 5.8% 56.70% £44,750 £65,844 203 123 9.0% £404.91 7.38% 6.1% 27 £26-27,000 2312Rishton 24.2% 9.7% 66.10% £64,000 £106,152 184 105 7.7% £408.11 4.61% 3.8% 16.7 £32-33,000 3081Spring Hill 28.1% 19.6 52.30% £40,000 £62,129 231 135 9.9% £401.62 7.76% 7.5% 32.4 £25-26,000 2209St. Andrew's 22.7% 20.1% 57.20% £64,500 £91,356 134 70 5.1% £427.26 5.61% 3.8% 18.8 £30-31,000 2169St. Oswald's 10.6% 1.0% 88.40% £90,000 £116,463 94 46 3.4% £464.30 4.78% 1.1% 10.4 £36-37,000 2698<strong>Hyndburn</strong> 21.1% 13.5% 65.40% £60,000 £96,192 2580 1365 4.3% £421.72 4.94% 3.7% 19.5% £31-32,000 36438Source: Land Registry 2012, Housing Benefit Department 201227


