Download Now - Hyndburn Borough Council
Download Now - Hyndburn Borough Council
Download Now - Hyndburn Borough Council

You also want an ePaper? Increase the reach of your titles
YUMPU automatically turns print PDFs into web optimized ePapers that Google loves.
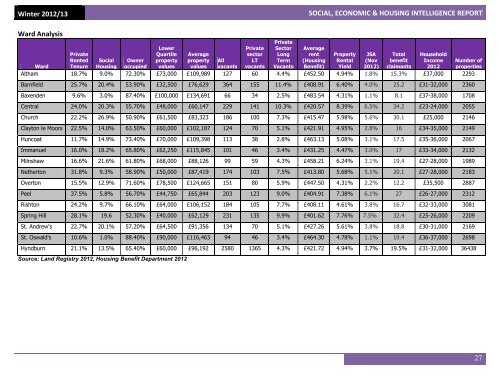
Winter 2012/13SOCIAL, ECONOMIC & HOUSING INTELLIGENCE REPORTWard AnalysisLowerQuartilepropertyvaluesPrivatesectorLTvacantsPrivateSectorLongTermVacantsAveragerent(HousingBenefit)WardPrivateRentedTenureSocialHousingOwneroccupiedAveragepropertyvaluesAllvacantsPropertyRentalYieldJSA(Nov2012)TotalbenefitclaimantsHouseholdIncome2012Number ofpropertiesAltham 18.7% 9.0% 72.30% £73,000 £109,989 127 60 4.4% £452.50 4.94% 1.8% 15.3% £37,000 2293Barnfield 25.7% 20.4% 53.90% £32,500 £76,629 364 155 11.4% £408.91 6.40% 4.0% 25.2 £31-32,000 2360Baxenden 9.6% 3.0% 87.40% £100,000 £134,691 66 34 2.5% £483.54 4.31% 1.1% 8.1 £37-38,000 1708Central 24.0% 20.3% 55.70% £48,000 £60,147 229 141 10.3% £420.57 8.39% 6.5% 34.2 £23-24,000 2055Church 22.2% 26.9% 50.90% £61,500 £83,323 186 100 7.3% £415.47 5.98% 5.6% 30.1 £25,000 2146Clayton le Moors 22.5% 14.0% 63.50% £60,000 £102,187 124 70 5.1% £421.91 4.95% 2.8% 16 £34-35,000 2149Huncoat 11.7% 14.9% 73.40% £70,000 £109,398 113 38 2.8% £463.13 5.08% 3.1% 17.5 £35-36,000 2067Immanuel 16.0% 18.2% 65.80% £62,250 £115,845 101 46 3.4% £431.25 4.47% 3.0% 17 £33-34,000 2132Milnshaw 16.6% 21.6% 61.80% £68,000 £88,126 99 59 4.3% £458.21 6.24% 3.1% 19.4 £27-28,000 1989Netherton 31.8% 9.3% 58.90% £50,000 £87,419 174 103 7.5% £413.80 5.68% 5.1% 20.1 £27-28,000 2183Overton 15.5% 12.9% 71.60% £78,500 £124,665 151 80 5.9% £447.50 4.31% 2.2% 12.2 £35,500 2887Peel 37.5% 5.8% 56.70% £44,750 £65,844 203 123 9.0% £404.91 7.38% 6.1% 27 £26-27,000 2312Rishton 24.2% 9.7% 66.10% £64,000 £106,152 184 105 7.7% £408.11 4.61% 3.8% 16.7 £32-33,000 3081Spring Hill 28.1% 19.6 52.30% £40,000 £62,129 231 135 9.9% £401.62 7.76% 7.5% 32.4 £25-26,000 2209St. Andrew's 22.7% 20.1% 57.20% £64,500 £91,356 134 70 5.1% £427.26 5.61% 3.8% 18.8 £30-31,000 2169St. Oswald's 10.6% 1.0% 88.40% £90,000 £116,463 94 46 3.4% £464.30 4.78% 1.1% 10.4 £36-37,000 2698<strong>Hyndburn</strong> 21.1% 13.5% 65.40% £60,000 £96,192 2580 1365 4.3% £421.72 4.94% 3.7% 19.5% £31-32,000 36438Source: Land Registry 2012, Housing Benefit Department 201227