THE CURVELET TRANSFORM FOR IMAGE FUSION
THE CURVELET TRANSFORM FOR IMAGE FUSION
THE CURVELET TRANSFORM FOR IMAGE FUSION

You also want an ePaper? Increase the reach of your titles
YUMPU automatically turns print PDFs into web optimized ePapers that Google loves.
1<strong>THE</strong> <strong>CURVELET</strong> <strong>TRANS<strong>FOR</strong>M</strong> <strong>FOR</strong> <strong>IMAGE</strong><strong>FUSION</strong>Myungjin Choi, Rae Young Kim, Myeong-Ryong NAM, and Hong Oh KimAbstract— The fusion of high-spectral/low-spatial resolutionmultispectral and low-spectral/high-spatial resolution panchromaticsatellite images is a very useful technique in variousapplications of remote sensing. Recently, some studies showedthat a wavelet-based image fusion method provides high qualityspectral content in fused images. However, most wavelet-basedmethods yield fused results with spatial resolution that is lessthan that obtained via the Brovey, IHS, and PCA fusion methods.In this paper, we introduce a new method based on a curvelettransform, which represents edges better than wavelets. Sinceedges play a fundamental role in image representation, oneeffective means to enhance spatial resolution is to enhance theedges. The curvelet-based image fusion method provides richerinformation in the spatial and spectral domains simultaneously.We performed Landsat ETM+ image fusion and found that theproposed method provides optimum fusion results.Index Terms— Image Fusion, Multiresolution analysis, LandsatETM+ image, Wavelet transform, Curvelet transform.I. INTRODUCTIONIN MANY remote sensing and mapping applications, thefusion of multispectral and panchromatic images is a veryimportant issue. In this regard, in the field of satellite imageclassification, the quality of the image classifier is affectedby the fused image’s quality. To date, many image fusiontechniques and software tools have been developed. The wellknownmethods include the Brovey, the IHS (Intensity, Hue,Saturation) colour model, the PCA (Principal ComponentsAnalysis) method, and the wavelet based method [1]. Assessmentof the quality of fused images is another important issue.Wald et al. proposed an approach utilizing criteria that can beemployed in the evaluation of the spectral quality of fusedsatellite images [2].If the objective of image fusion is to construct synthetic imagesthat are closer to reality, then the Brovey, IHS, and PCAfusion methods are satisfactory [1]. However, one limitationof these methods is some distortion of spectral characteristicsin the original multispectral images. Recently, developmentsin wavelet analysis have provided a potential solution to thisThe first, second and fourth authors were supported by KRF-2002-070-C00004.M.-J. Choi is with SaTReC, KAIST, 373-1, Guseong-dong, Yuseong-gu,Daej eon, 305-701, Republic of KOREA (email:prime@satrec.kaist.ac.kr).R.Y.Kim is with Division of Applied Mathematics, KAIST, 373-1,Guseong -dong, Yuseong-gu, Daejeon, 305-701, Republic of KOREA(email:rykim@amath.kaist.ac.kr).M.-R. NAM is with SaTReC, KAIST, 373-1, Guseong-dong, Yuseong-gu,Daeje on, 305-701, Republic of KOREA (email:nam@satrec.kaist.ac.kr).H.O.Kim is with Division of Applied Mathematics, KAIST, 373-1,Guseong- dong, Yuseong-gu, Daejeon, 305-701, Republic of KOREA(email:hkim@amath.kaist.ac.kr).problem. Nunez et al. developed an approach to fuse a highresolutionpanchromatic image with a low-resolution multispectralimage based on wavelet decomposition [3]. Ranchinand Wald designed the ARSIS concept for fusing high spatialand spectral resolution images based on a multiresolutionanalysis of a two-band wavelet transformation.The wavelet-based image fusion method provides high spectralquality in fused satellite images. However, fused imagesby wavelets have much less spatial information than those bythe Brovey, IHS, and PCA methods. In many remote sensingapplications, the spatial information of a fused image is as animportant factor as the spectral information. In other words,it is necessary to develop an advanced image fusion methodso that fused images have the same spectral resolution asmultispectral images and the same spatial resolution as apanchromatic image with minimal artifacts.Recently, other multi-scale systems have been developed,including ridgelets and curvelets [4]–[7]. These approachesare very different from wavelet-like systems. Curvelets andridgelets take the form of basis elements, which exhibitvery high directional sensitivity and are highly anisotropic.Therefore, the curvelet transform represents edges better thanwavelets, and is well-suited for multiscale edge enhancement[7].In this paper, we introduce a new image fusion methodbased on a curvelet transform. The fused image using thecurvelet-based image fusion method yields almost the samedetail as the original panchromatic image, because curveletsrepresent edges better than wavelets. It also gives the samecolour as the original multispectral images, because we usethe wavelet-based image fusion method in our algorithm. Assuch, this new method is an optimum method for image fusion.In this study we develop a new approach for fusing LansatETM+ panchromatic and multispectral images based on thecurvelet transform.The remainder of this paper is organized as follows. Thenext section describes the theoretical basis of the ridgelets andcurvelets . A new image fusion approach for Lansat ETM+panchromatic and multispectral images based on the curvelettransform is subsequently presented.This is followed by a discussion of the image fusing experiments.Next, the experimental results are analysed. Finally,the proposed method is compared with previous methodsdeveloped for image fusion, including the wavelet method andthe IHS method.
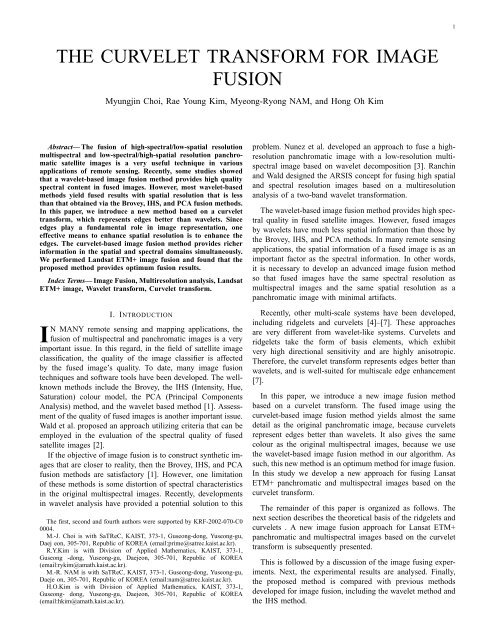
2II. RIDGELET AND <strong>CURVELET</strong> <strong>TRANS<strong>FOR</strong>M</strong>SIn this section, we review the theory of ridgelet and curvelettransforms, presented in [5]–[10], which are used in thesubsequent sections.A. Continuous ridgelet transformLet ψ be in L 2 (R) with sufficient decay and satisfying theadmissibility condition,∫ |2 ˆψ(ξ)|K ψ :=|ξ| 2 dξ < ∞,In this paper, we adopt Meyer wavelet ψ, which has highsmoothness and a compact support in the frequency domain.We refer to [11], [12] for the definition and the basic propertiesof Meyer wavelet. We will suppose that ψ is normalized sothat K ψ = 1.For each a > 0, b ∈ R, and θ ∈ [0, 2π], ridgelet basisfunctions are defined byψ a,b,θ (x) := a −1/2 ψ((x 1 cos θ + x 2 sin θ − b)/a).The Radon transform for f ∈ L 2 (R 2 ) is given by∫Rf(θ, t) = f(x 1 , x 2 )δ(x 1 cos θ + x 2 sin θ − t)dx 1 dx 2 ,where δ is the Dirac distribution. For f ∈ L 1 (R 2 ), thecontinuous ridgelet coefficient is given by∫R f (a, b, θ) = f(x)ψ a,b,θ (x)dx. (1)Then any function f ∈ L 1 (R 2 ) ∩ L 2 (R 2 ) is represented as acontinuous superposition of ridgelet functionsf(x) =∫ 2π ∫ ∞ ∫ ∞0−∞0R f (a, b, θ)ψ a,b,θ (x) da dθdba3 4πNotice that (1) is also given by the wavelet transform of theRadon transform f:∫R f (a, b, θ) = Rf(θ, t)a −1/2 ψ((t − b)/a)dt.Deans found that the two-dimensional Fourier transform of fis equal to the one-dimensional Fourier transform of the Radontransform of f [13]:∫ˆf(ξ cos θ, ξ sin θ) = Rf(θ, t)e −iξt dt.Hence the Radon transform of f is obtained by the onedimensionalinverse Fourier transform of ˆf(ξ cos θ, ξ sin θ) asa function of ξ.B. Curvelet transformLet Q denote a dyadic square [k 1 /2 s , (k 1 + 1)/2 s ) ×[k 2 /2 s , (k 2 + 1)/2 s ) and let Q s be the collection of all dyadicsquares of scale s. We also let w Q be a window near Q,obtained by dilation and translation of a single w, satisfying∑Q∈Q sw 2 Q = 1.We define multiscale ridgelets {w Q T Q ψ a,b,θ : s ≥ s 0 , Q ∈Q s , a > 0, b ∈ R, θ ∈ [0, 2π)}, where T Q f(x 1 , x 2 ) =2 s f(2 s x 1 − k 1 , 2 s x 2 − k 2 ). Then we have the reconstructionformulaf = ∑Q∈Q sfw 2 Q= ∑Q∈Q s∫ 2π ∫ ∞ ∫ ∞0−∞0da dθ〈f, w Q T Q ψ a,b,θ 〉w Q T Q ψ a,b,θ dba3 4πThe curvelet transform is given by filtering and applying multiscaleridgelet transform on each bandpass filters as follows:1) Subband Decomposition. The image is filtered into subbands:f → (P 0 f, ∆ 1 f, ∆ 2 f, · · · ),where a filter P 0 deals with frequencies |ξ| ≤ 1 and thebandpass filter ∆ s is concentrated near the frequencies[2 s , 2 2s+2 ], for example,∆ s = Ψ 2s ∗ f, ˆΨ 2s (ξ) = ˆΨ(2 −2s ξ);2) Smooth Partitioning. Each subband is smoothly windowedinto “squares” of an appropriate scale∆ s f → (w Q ∆ s f) Q∈Qs ;3) Renormalization. Each resulting square is renormalizedto unit scaleg Q = (T Q ) −1 (w Q ∆ s f), Q ∈ Q s ;4) Ridgelet Analysis. Each square is analysed via the discreteridgelet transform.For improved visual and numerical results of the digitalcurvelet transform, Starck et al. presented the following discretecurvelet transform algorithm [6], [14]:1) apply the à trous algorithm with J scales:J∑I(x, y) = C J (x, y) + w j (x, y),j=1where c J is a coarse or smooth version of original imageI and w j represents “the details of I” at scale 2 −j ;2) set B 1 = B min ;3) for j = 1, · · · , J doa) partition the subband w j with a block size B j andapply the digital ridgelet transform to each block;b) else B j+1 = B j .III. <strong>THE</strong> <strong>IMAGE</strong> <strong>FUSION</strong> METHOD BASED ON <strong>THE</strong><strong>CURVELET</strong> <strong>TRANS<strong>FOR</strong>M</strong>The following is the specific operational procedure for theproposed curvelet-based image fusion approach. While theoperational procedure may be generally applied , LandsatETM+ images are utilized as an example in order to illustratethe method.1) The original Landsat ETM+ panchromatic and multispectralimages are geometrically registered to each other.
3Fig. 1.Curvelet-based image fusion method.2) Three new Landsat ETM+ panchromatic images I 1 , I 2and I 3 are produced. The histograms of these images arespecified according to the histograms of the multispectralimages R, G and B, respectively.3) Using the well-known wavelet-based image fusionmethod, we obtain fused images I 1 + R, I 2 + G andI 3 + B, respectively.4) I 1 , I 2 and I 3 , which are taken from 2), are decomposedinto J + 1 subbands, respectively, by applying “à trous”subband filtering algorithm. Each decomposed imageincludes C J , which is a coarse or smooth version of theoriginal image, and w j , which represents “the details ofI” at scale 2 −j .5) Each C J is replaced by a fused image obtained from 3).For example, (C J for I 1 ) is replaced by (I 1 + R).6) The ridgelet transform is then applied to each block inthe decomposed I 1 , I 2 and I 3 , respectively.7) Curvelet coefficients (or ridgelet coefficients) are modifiedusing hard-thresholding rule in order to enhanceedges in the fused image.8) Inverse curvelet transforms (ICT) are carried out for I 1 , I 2and I 3 , respectively. Three new images ( F 1 , F 2 and F 3 )are then obtained, which reflect the spectral informationof the original multispectral images R, G and B, and alsothe spatial information of the panchromatic image.9) F 1 , F 2 and F 3 are combined into a single fused imageF .In this approach, we can obtain an optimum fused image thathas richer information in the spatial and spectral domainssimultaneously. Therefore, we can easily find small objectsin the fused image and separate them. As such, the curveletsbasedimage fusion method is very efficient for image fusion.IV. EXPERIMENTAL STUDY AND ANALYSISA. Visual analysisSince the wavelet transform preserves the spectral informationof the original multispectral images, it has the highspectral resolution in contrast with the IHS-based fusion result,which has some colour distortion. But the wavelet-basedfusion result has much less spatial information than that ofthe IHS-based fusion result.To overcome this problem, we use the curvelet transform inimage fusion. Since the curvelet transform is well adapted torepresent panchromatic image containing edges, the curveletbasedfusion result has both high spatial and spectral resolution.From the curvelet-based fusion result in the Landsat ETM+image fusion presented in Figure 2, it should be noted that both
4(a)(b)(c)(d)Fig. 2.(a) Original Landsat ETM+ color image. (b) IHS-based fusion result. (c) Wavelet-based fusion result. (d) Curvelet-based fusion result.the spatial and the spectral resolutions have been enhanced, incomparison with the original colour image. That is, the fusedresult contains both the structural details of the higher spatialresolution panchromatic image and the rich spectral informationfrom the multispectral images. Moreover, compared withthe fused results obtained by the wavelet and IHS, the curveletbasedfusion result has a better visual effect, such as contrastenhancement.B. Quantitative analysisIn addition to the visual analysis, we conducted a quantitativeanalysis. The experimental results were analysed basedon the combination entropy, the mean gradient, and the correlationcoefficient, as used in [2], [15]–[17].Table I presents a comparison of the experimental results ofimage fusion using the curvelet-based image fusion method,the wavelet-based image fusion method, and the IHS methodin terms of combination entropy, mean gradient, and correlationcoefficient.The combination entropy of an image is defined as∑255H(f 1 , f 2 , f 3 ) = − P i1,i 2,i 3log 2 P i1,i 2,i 3,i=0where P i1 ,i 2 ,i 3is the combination probability of the imagef 1 , f 2 and f 3 , in which pixel values are i 1 , i 2 and i 3 , respectively,for the same position. The combination entropy (C.E.)represents the property of combination between images. Thelarger the combination entropy of an image, the richer theinformation contained in the image. In Table I, the combinationentropy of the curvelet-based image fusion is greater thanthat of other methods. Thus, the curvelet-based image fusionmethod is superior to the wavelet and IHS methods in termsof combination entropy.The mean gradient is defined asg = 1MNM∑N∑i=1 j=1√(∆I 2 x + ∆I 2 y)/2,∆I x;i,j = f(i + 1, j) − f(i, j), ∆I y;i,j = f(i, j + 1) − f(i, j),
5TABLE IA COMPARISON OF <strong>IMAGE</strong> <strong>FUSION</strong> BY <strong>THE</strong> WAVELETS, <strong>THE</strong> <strong>CURVELET</strong>S,AND IHS METHODS.Method C.E M. G C.COriginal 14.1035 -Images 4.1497 17.9416 -(R,G,B) 13.3928 -Image fused 15.7327 0.8134by IHS 2.8135 15.4414 0.9585(F1, F2, F3 ) 15.0168 0.9303Image fused 16.5891 0.9013by Wavelet 5.8611 18.9083 0.9176(F1, F2, F3 ) 17.0362 0.8941Image fused 19.5549 0.9067by Curvelet 5.8682 22.8330 0.9318(F1, F2, F3 ) 20.9101 0.9119where M and N are the length and width, in terms of pixelnumber, of an image f. The mean gradient (M.G.) reflects thecontrast between the detailed variation of pattern on the imageand the clarity of the image.The correlation coefficient is defined asCorr(A, B) =∑m,n (A mn − A)(B mn − B)√( ∑ m,n (A mn − A) 2 )( ∑ m,n (B mn − B) 2 )where A and B stand for the mean values of the correspondingdata set. The correlation coefficient (C.C.) between the originaland fused image shows similarity in small size structuresbetween the original and synthetic images. In Table I, the meangradient and the correlation coefficient of the curvelet-basedimage fusion method are greater than those of the waveletbasedimage fusion method. Hence, we can see that thecurvelet-based fusion method is better than the wavelet-basedfusion method in terms of the mean gradient and correlationcoefficient.Based on the experimental results obtained from this study,the curvelet-based image fusion method is very efficient forfusing Landsat ETM+ images. This new method has yieldedoptimum fusion results.V. CONCLUSIONWe have presented a newly developed method based on acurvelet transform for fusing Landsat ETM+ images. In thispaper, an experimental study was conducted by applying theproposed method, as well as other image fusion methods,to the fusion of Landsat ETM+ images. A comparison ofthe fused images from the wavelet and IHS method wasmade. Based on experimental results pertaining to three indicators- the combination entropy, the mean gradient, and thecorrelation coefficient- the proposed method provides betterresults, both visually and quantitatively, for remote sensingfusion. Since the curvelet transform is well adapted to representpanchromatic images containing edges and the wavelettransform preserves the spectral information of the originalmultispectral images, the fused image has both high spatialand spectral resolution.,ACKNOWLEDGMENTThe authors would like to express their sincere gratitudeto Electronics and Telecommunications Research Institute forproviding the Landsat ETM+ images for this research.REFERENCES[1] T. Ranchin and L. Wald, “Fusion of High Spatial and Spectral Resolutionimages: The ARSIS Concept and Its Implementation,” PhotogrammetricEngineering and Remote Sensing, vol. 66, 2000, pp. 49-61.[2] L. Wald, T. Ranchin and M. Mangolini, “Fusion of Satellite images ofdifferent spatial resolution: Assessing the quality of resulting images,”Photogrammetric Engineering and Remote Sensing, vol. 63, no. 6, 1997,pp. 691-699.[3] J. Nunez, X. Otazu, O. Fors, A. Prades, V. Pala and R. Arbiol,“Multiresolution-based image fusion with addtive wavelet decomposion,”IEEE Transactions on Geoscience and Remote sensing, vol. 37, no. 3,1999, pp. 1204-1211.[4] E. J. Candès, “Harmonic analysis of neural networks,” A ppl. Comput.Harmon. Anal., vol. 6, 1999, pp. 197-218.[5] E. J. Candès and D. L. Donoho, “Curvelets- A surprisingly effectivenonadaptie representation for objects with edges,” in Curve and SurfaceFitting: Saint-Malo, A. Cohen, C.Rabut, and L.L.Schumaker, Eds.Nashville, TN: Vanderbilt Univ. ersity Press, 1999.[6] J. L. Starck, E. J. Candès and D. L. Donoho, “The curvelet transformfor image denosing,” IEEE Trans. Image Processing, vol. 11, 2002, pp.670-684.[7] J. L. Starck, E, J. Candès, and D. L. Donoho, “Gray and Color ImageContrast Enhancement by the Curvelet Transform,” IEEE Trans. ImageProcessing, vol. 12, no. 6, 2003, pp. 706-717.[8] E. J. Candès, “Ridgelets: Theory and Applications,” Ph.D. Thesis, Departmentod Statistics, Stanford University, Standford, CA, 1998.[9] D. L. Donoho, “Digital ridgelet transform via rectopolar coordinatetransform,” Stanford Univ., Stanford, CA, Tech. Rep, 1998.[10] D. L. Donoho, “Orthonormal ridgelets and linear singularities,”SIAM J. Math Anal., vol. 31, no. 5, 2003, pp. 1062-1099.[11] I. Daubechies, “Ten Lectures on Wavelets,” CBMS-NSF series inApplied Mathematics, SIAM, Philadelphia, 1992.[12] P. G. Lemarié and Y. Meyer, “Ondelettes et bases Hilbertiennes,” Rev.Mat. Iberoamericana, 2, 1986, pp. 1-18.[13] S. R. Deans, “The Radon Transform and Some of Its Application,” NewYork: Wiley, 1983.[14] J. L. Starck, F. Murtagh and R. Bijaoui, ”Image Processing and DataAnalysis: The Multiscale Approach,” Cambridge, U.K.: Cambridge Univ.Press, 1998.[15] J. Li and Z. J .Liu, “Data fusion for remote sensing imagery basedon feature,” China Journal of Remote Sensing, vol. 2, no. 2, 1998, pp.103-107 (in Chinese with abstract in English).[16] W. Z. Shi, C. Q. Zhu, C. Y. Zhu and X. M. Yang, “Multi-Band Waveletfor Fusing SPOT Panchromatic and Multispectral Images,” PhotogrammetricEngineering and Remote Sensing, vol. 69, no. 5, 2003, pp . 513-520.[17] J. B. Sun, J. L. Liu and J. Li, “Multi-source remote sensing image datafusion,” China Journal of Remote Sensing, vol. 2, no. 1, 1998, pp. 47-50(in Chinese with abstract in English).