

Indonesia Human Development Report 2001 - UNDP
Indonesia Human Development Report 2001 - UNDP
Indonesia Human Development Report 2001 - UNDP

Create successful ePaper yourself
Turn your PDF publications into a flip-book with our unique Google optimized e-Paper software.
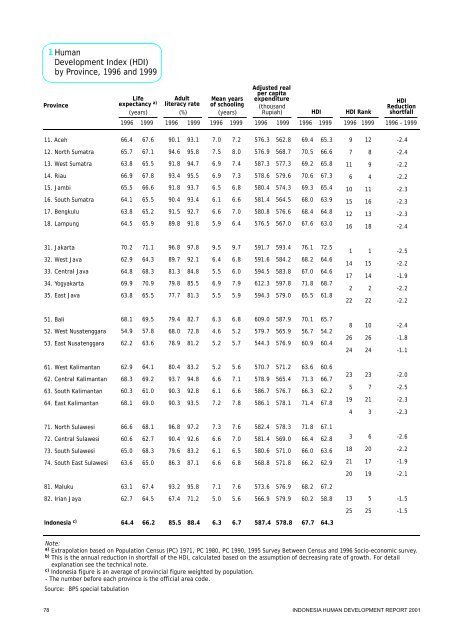
1 <strong>Human</strong><strong>Development</strong>Index(HDI)byProvince, 1996 and1999ProvinceLifeexpectancy a)(years)Adultliteracyrate(%)Mean yearsofschooling(years)Adjusted realpercapitaexpenditure(thousandRupiah)HDIHDI RankHDIReductionshortfall1996 1999 1996 1999 1996 1999 1996 1999 1996 1999199619991996 -199911.Aceh66.467.690.193.17.07.2576.3562.869.465.3912-2.412.North Sumatra65.767.194.695.87.58.0576.9568.770.566.678-2.413.WestSumatra63.865.591.894.76.97.4587.3577.369.265.8119-2.214.Riau66.967.893.495.56.97.3578.6579.670.667.364-2.215.Jambi65.566.691.893.76.56.8580.4574.369.365.41011-2.316.South Sumatra64.165.590.493.46.16.6581.4564.568.063.91516-2.317.Bengkulu18.Lampung63.864.565.265.991.589.892.791.86.65.97.06.4580.8576.5576.6567.068.467.664.863.012161318-2.3-2.431.Jakarta32.WestJava33.Central Java34.Yogyakarta35.EastJava70.262.964.869.963.871.164.368.370.965.596.889.781.379.877.797.892.184.885.581.39.56.45.56.95.59.76.86.07.95.9591.7591.6594.5612.3594.3593.4584.2583.8597.8579.076.168.267.071.865.572.564.664.668.761.81141722211514222-2.5-2.2-1.9-2.2-2.251.Bali52.WestNusatenggara53.EastNusatenggara68.154.962.269.557.863.679.468.078.982.772.881.26.34.65.26.85.25.7609.0579.7544.3587.9565.9576.970.156.760.965.754.260.482624102624-2.4-1.8-1.161.WestKalimantan62.Central Kalimantan63.South Kalimantan64.EastKalimantan62.968.360.368.164.169.261.069.080.493.790.390.383.294.892.893.55.26.66.17.25.67.16.67.8570.7578.9586.7586.1571.2565.4576.7578.163.671.366.371.460.666.762.267.8235194237213-2.0-2.5-2.3-2.371.North Sulawesi72.Central Sulawesi66.660.668.162.796.890.497.292.67.36.67.67.0582.4581.4578.3569.071.866.467.162.836-2.673.South Sulawesi65.068.379.683.26.16.5580.6571.066.063.61820-2.274.South EastSulawesi63.665.086.387.16.66.8568.8571.866.262.92117-1.92019-2.181.Maluku63.167.493.295.87.17.6573.6576.968.267.282.Irian Jaya62.764.567.471.25.05.6566.9579.960.258.8135-1.52525-1.5<strong>Indonesia</strong> c)64.466.285.588.46.36.7587.4578.867.764.3Note:a) Extrapolation based on Population Census(PC)1971, PC 1980,PC 1990,1995SurveyBetween Census and 1996 Socio-economicsurvey.b) This is the annual reduction in shortfall of the HDI,calculated basedon the assumption ofdecreasing rate ofgrowth. For detailexplanation see the technicalnote.c) <strong>Indonesia</strong> figure is an average ofprovincial figure weighted by population.-The number before each province isthe official areacode.Source: BPS special tabulation78INDONESIAHUMAN DEVELOPMENT REPORT<strong>2001</strong>
2 Gender-related<strong>Development</strong>Index(GDI)byProvince, 1996ProvinceLifeexpectancy a)Female(years)MaleAdultliteracyrate(%)Mean yearsofschooling(years)Proportionoflabour force(%)Female Male Female Male Female MaleGDIGDI Rank11.Aceh68.364.486.294.26.57.537.562.563.6612.North Sumatra67.663.892.097.26.98.039.460.665.0413.WestSumatra65.761.988.595.46.57.340.959.163.3714.Riau68.864.991.095.86.47.427.672.456.42115.Jambi67.463.587.895.85.87.131.768.358.81416.South Sumatra65.962.186.194.65.66.736.064.058.51617.Bengkulu65.761.987.595.46.07.241.258.864.4518.Lampung66.462.685.693.75.46.435.065.059.61231.Jakarta72.268.395.198.68.910.230.769.363.3832.WestJava64.761.085.693.85.86.930.469.656.42233.Central Java66.762.874.688.34.96.240.859.259.21334.Yogyakarta72.068.071.588.56.07.945.055.068.3135.EastJava65.761.970.086.04.86.239.360.757.91851.Bali70.066.171.887.35.47.244.655.465.6252.WestNusatenggara56.553.360.276.93.95.443.356.751.52653.EastNusatenggara64.060.375.482.64.85.643.856.256.82061.WestKalimantan64.761.072.388.34.55.938.761.358.61562.Central Kalimantan70.366.391.096.26.07.234.965.165.2363.South Kalimantan62.158.485.795.25.56.840.359.761.5964.EastKalimantan70.066.185.994.56.47.931.768.355.82471.North Sulawesi68.664.796.497.27.37.426.173.958.11772.Central Sulawesi62.358.787.193.66.27.032.367.759.81073.South Sulawesi66.963.176.083.65.66.629.071.054.82574.South EastSulawesi65.561.781.591.36.07.335.964.157.41981.Maluku65.061.290.695.76.67.533.166.959.81182.Irian Jaya64.560.760.973.64.35.840.259.856.123<strong>Indonesia</strong> b)66.262.480.590.95.66.936.263.858.9Note:a) Extrapolation basedon Population Census (PC)1971,PC 1980,PC 1990, 1995 Survey Between Censusand1996Socio-economic survey.b) <strong>Indonesia</strong> figure is an average ofprovincial figure weightedbypopulation.-The number before each province isthe official areacode.Source: BPS special tabulationHUMAN DEVELOPMENTINDICATORSAND INDICES 79
3 Gender-related<strong>Development</strong>Index(GDI)byProvince, 1999ProvinceLifeexpectancy a)Female(years)MaleAdultliteracyrate(%)Mean yearsofschooling(years)Proportionoflabour force(%)Female Male Female Male Female MaleGDIGDI RankReductionshortfall b)1996 -199911.Aceh69.665.690.196.26.87.738.461.659.08-2.312.North Sumatra69.165.193.698.07.58.541.158.961.23-2.213.WestSumatra67.463.592.697.07.27.740.359.760.75-1.914.Riau69.865.893.797.46.97.830.070.053.124-215.Jambi68.664.790.596.96.17.431.668.454.618-2.216.South Sumatra67.463.590.396.56.27.136.763.352.425-2.417.Bengkulu67.163.389.495.96.57.539.560.559.47-2.418.Lampung67.964.088.395.15.96.837.162.957.012-1.931.Jakarta73.269.396.898.99.010.434.565.561.22-1.832.WestJava66.262.489.295.26.27.332.367.754.617-1.633.Central Java70.366.378.491.45.46.740.859.257.410-1.634.Yogyakarta72.969.078.393.07.18.845.654.466.41-1.835.EastJava67.463.574.588.65.36.739.160.953.223-2.251.Bali71.667.575.490.25.97.745.254.860.46-2.552.WestNusatenggara59.455.965.481.24.56.043.156.945.926-2.353.EastNusatenggara65.561.777.483.55.25.943.057.056.814-0.461.WestKalimantan65.962.176.190.25.06.239.660.455.715-1.962.Central Kalimantan71.267.392.896.96.67.534.765.357.99-2.863.South Kalimantan62.859.189.496.35.97.241.059.056.913-2.364.EastKalimantan71.067.090.096.87.18.531.069.053.521-1.771.North Sulawesi70.066.197.397.27.57.628.571.553.920-2.272.Central Sulawesi64.560.790.394.96.67.433.666.454.119-2.473.South Sulawesi70.366.379.687.16.07.031.568.553.322-1.574.South EastSulawesi66.963.182.691.86.27.436.463.657.411-0.481.Maluku69.365.494.297.47.38.035.065.061.041.582.Irian Jaya66.462.664.877.34.86.441.158.955.716-1.0<strong>Indonesia</strong> c)68.164.284.192.96.17.337.262.955.9Note:a) Extrapolation basedon Population Census (PC)1971,PC 1980,PC 1990, 1995 Survey Between Censusand1996Socio-economic survey.b) This is the annual reduction in shortfall of the HDI,calculated basedon the assumption ofdecreasing rate ofgrowth. For detailexplanation see the technicalnote.c) <strong>Indonesia</strong> figure is an average ofprovincial figure weighted by population.-The number before each province isthe official areacode.Source: BPS special tabulation80INDONESIAHUMAN DEVELOPMENT REPORT<strong>2001</strong>
4 GenderEmpowerementMeasure (GEM)byProvince,1996 and1999ProvinceWomen intheparliament(% oftotal)Femalesin seniorofficial,managerial,and technical staff Females in thepositions labourforce(% oftotal) (% oftotal)GEM GEM Rank1996 1999 1996 1999 1996 1999 1996 1999 1996 199911.Aceh6.18.345.354.434.138.457.352.419612.North Sumatra10.92.846.153.833.841.162.547.371613.WestSumatra10.36.154.358.833.940.361.951.59814.Riau10.52.034.243.223.730.052.238.1262615.Jambi16.48.038.437.531.231.664.746.821716.South Sumatra9.23.246.752.429.036.758.241.7172517.Bengkulu12.310.045.645.536.839.566.456.51218.Lampung11.94.540.446.129.937.161.448.2101331.Jakarta14.67.934.734.923.234.556.146.4221832.WestJava10.87.838.236.025.532.355.847.7231433.Central Java10.76.740.644.731.540.860.551.212934.Yogyakarta8.47.840.246.737.945.663.158.85135.EastJava9.811.138.445.932.039.158.954.414451.Bali10.86.133.935.537.145.262.950.561052.WestNusatenggara10.16.134.137.235.743.158.746.2162053.EastNusatenggara9.82.132.435.737.143.056.446.4211861.WestKalimantan7.36.338.143.233.439.657.552.218762.Central Kalimantan12.62.537.646.333.934.763.743.542463.South Kalimantan6.88.740.747.136.141.058.955.115364.EastKalimantan11.412.533.939.221.931.052.749.3251271.North Sulawesi13.67.543.454.926.628.560.845.1112272.Central Sulawesi12.27.538.847.433.833.663.950.031173.South Sulawesi11.93.841.547.729.931.559.443.9132374.South EastSulawesi15.42.538.240.230.436.462.546.082181.Maluku6.57.538.755.333.535.056.552.720582.Irian Jaya9.72.727.834.233.141.155.847.72414<strong>Indonesia</strong> a)58.849.5Note:a) <strong>Indonesia</strong> figure is an average ofprovincial figure weighted by population.-The number before each province isthe official areacode.Source: BPS special tabulationHUMAN DEVELOPMENTINDICATORSAND INDICES 81
5 <strong>Human</strong>Poverty Index (HPI)byProvince, 1995 and1998ProvincePeople notexpectedto surviveage 40 c)Populationwithoutaccess tohealthUndernourishedchildrenunder(%)Adultiliteracy rate(%)Populationwithoutaccess tosafe water(%)facilities(%)age five(%)HPIHPI Rank1995 a) 1998 b) 1995 1998 1995 1998 1995 1998 1995 1998 1995 1998 1995 199811.Aceh14.612.710.76.961.261.512.237.648.935.628.931.4202312.North Sumatra15.813.56.44.248.447.911.920.937.535.323.524.571113.WestSumatra19.116.28.15.354.046.45.721.739.334.024.424.410914.Riau13.812.46.44.473.471.812.039.247.827.931.132.3222415.Jambi16.214.28.96.365.957.310.221.535.632.926.626.3151416.South Sumatra18.616.28.76.658.359.716.028.937.226.426.927.3161717.Bengkulu19.116.610.37.465.059.20.524.825.930.023.027.161618.Lampung17.815.411.38.262.054.49.234.530.229.124.827.9121831.Jakarta9.17.92.72.245.040.22.22.029.123.717.915.51132.WestJava20.818.29.47.862.462.110.622.433.627.226.326.9131533.Central Java17.411.718.115.247.647.811.017.134.730.524.023.29734.Yogyakarta9.48.218.114.553.948.91.18.621.917.319.918.54235.EastJava19.116.223.118.740.843.05.817.135.330.723.623.48851.Bali12.011.721.017.336.034.24.214.922.721.018.918.72352.WestNusatenggara35.431.530.527.264.762.55.117.544.039.734.933.7252553.EastNusatenggara22.119.521.219.650.841.917.138.249.638.729.929.5212161.WestKalimantan20.818.619.116.883.878.435.343.330.342.036.038.7262662.Central Kalimantan11.710.46.45.274.868.226.226.241.630.533.129.0242063.South Kalimantan25.924.510.17.250.246.712.716.237.429.026.524.4141064.EastKalimantan12.010.79.56.542.335.87.919.632.531.919.920.63471.North Sulawesi14.212.03.12.844.744.59.426.133.725.821.022.75572.Central Sulawesi25.421.29.57.457.751.710.530.240.034.927.828.4181973.South Sulawesi17.011.720.416.855.949.118.126.039.833.928.326.3191374.South EastSulawesi19.517.015.512.938.243.624.921.332.827.124.422.911681.Maluku20.413.16.74.247.452.123.223.840.729.327.124.7171282.Irian Jaya21.217.831.228.856.154.525.736.039.228.332.831.32322<strong>Indonesia</strong> d)18.315.214.411.653.151.910.621.635.430.025.225.2Note:a) 1996 figure; b) 1999figure; c) Extrapolation based on Population Census(PC) 1971, PC 1980,PC 1990,1995SurveyBetween Census and1996 Socio-economicsurvey. d) <strong>Indonesia</strong>figure isan average of provincial figures,weighted by population.-The number before each province isthe official areacode.Source: BPS special tabulation82INDONESIAHUMAN DEVELOPMENT REPORT<strong>2001</strong>
ProvinceDistrict11.Aceh12.North Sumatera13.WestSumatera01.SouthAceh02.South-eastAceh03.EastAceh04.CentralAceh05.WeastAceh06.Aceh Besar07.Pidie08.NorthAceh71.BandaAceh72.Sabang01.Nias02.SouthTapanuli03.Central Tapanuli04.NorthTapanuli05.Labuhan Batu06.Asahan07.Simalungun08.Dairi09.Karo10.DeliSerdang11.Langkat71.Sibolga72.Tanjung Balai73.Pematang Siantar74.TebingTinggi75.Medan76.Binjai01.South Pesisir02.Solok03.Sawah Lunto/Sijunjun04.Tanah Datar05.Padang Pariaman06.Agam07.Limapuluh Koto08.Pasaman71.Padang72.Solok73.Sawah Lunto74.Padang Panjang75.BukitTinggi76.PayakumbuhLifeexpectancy a)1999(years)1996 1999(%)Adultliteracyrate1996 1999(years)Mean yearsofschooling1996 1999(thousandRupiah)Adjusted realpercapitaexpenditure1996 1999HDI1996HDI Rank19991996HDIReductionshortfall1996-199966.465.763.862.866.766.165.566.968.066.467.367.167.965.063.164.163.864.165.565.864.070.364.665.467.065.568.768.167.867.762.658.658.765.662.865.663.159.467.264.769.767.669.765.767.667.165.564.067.867.366.768.169.267.668.468.268.666.464.565.565.265.566.967.265.470.666.068.868.466.970.169.569.269.164.360.260.467.264.467.264.761.168.866.370.169.269.866.890.194.691.883.587.494.592.787.686.884.791.696.894.073.397.692.094.296.193.992.494.695.894.795.198.396.098.997.598.797.388.389.387.692.189.591.893.390.096.294.795.497.098.696.393.195.894.791.390.793.997.291.294.487.694.597.794.885.799.393.896.296.593.793.696.895.594.097.298.597.098.497.898.897.393.494.791.793.293.594.294.893.997.297.697.497.498.797.17.07.56.95.96.76.97.16.17.26.37.010.28.04.67.06.57.86.46.66.57.57.57.56.78.77.59.18.69.68.56.25.85.96.75.86.76.55.89.28.27.59.29.48.07.28.07.46.37.07.07.86.28.06.77.310.38.45.77.76.98.27.36.97.17.67.97.77.78.87.89.58.99.98.96.96.27.07.16.56.96.86.69.68.77.89.59.78.4576.3576.9587.3563.7561.7566.6559.9558.0557.4577.2564.8582.4552.7476.8565.7519.2555.9562.6567.7561.7560.3574.6584.2557.6564.7601.0568.7588.1579.5585.5571.9574.9584.5575.5585.5575.5577.0570.7591.0574.9578.6579.2590.2579.4562.8568.7577.3560.6552.8565.5559.8561.5559.6567.6524.2583.0518.2413.7561.6537.6566.9550.9567.4563.1509.8576.2577.9561.3573.1570.3579.9573.0579.8565.1576.0572.9576.8576.2580.0578.1574.2570.0585.4579.8571.8586.9578.9578.669.470.569.264.267.769.568.367.168.467.869.574.270.155.568.563.867.968.068.968.268.373.270.568.372.072.573.774.274.373.666.164.064.569.267.269.168.064.274.170.373.173.676.171.465.366.665.862.163.965.466.064.366.864.163.170.563.750.465.262.165.764.065.165.161.169.166.167.168.966.870.969.570.868.564.461.661.966.164.466.364.662.070.468.068.870.870.967.99711214127801061441041258118662839922412111991114112296210547362319162517021920885142881182132064302675112892101541079414576149179231622881142071031501171192323690703777173119471432282169113987135214245941181662-2.4-2.4-2.2-1.8-2.3-2.4-2.0-2.0-1.7-2.3-2.7-2.4-2.8-2.3-2.2-1.7-1.9-2.3-2.3-2.1-2.8-2.5-2.5-1.6-2.2-2.8-2.2-2.6-2.4-2.7-1.7-1.9-1.9-2.2-2.0-2.1-2.2-1.8-2.4-2.0-2.5-2.2-2.8-2.3<strong>Human</strong><strong>Development</strong>Index(HDI)byDistrict,1996 and19996HUMAN DEVELOPMENTINDICATORSAND INDICES 83
14.Riau15.Jambi16.South Sumatera17.Bengkulu18.Lampung31.Jakarta01.Indragiri Hulu02.Indragiri Ilir03.Kepulauan Riau04.Kampar05.Bengkalis71.Pekan Baru72.Batam01.Kerinci02.Bungo Tebo03.Sarolangun Bangko04.Batanghari05.Tanjung Jabung71.Jambi01.Ogan Komering Ulu02.Ogan Komering Hilir03.MuaraEnim(Liot)04.Lahat05.MusiRawas06.MusiBanyuasin07.Bangka08.Balitung71.Palembang72.Pangkal Pinang01.South Bengkulu02.Rejang Lebong03.North Bengkulu71.Bengkulu01.South Lampung02.Central Lampung03.North Lampung04.WestLampung71.Bandar Lampung71.South Jakarta72.EastJakarta73.Central Jakarta74.WestJakarta75.North JakartaLifeexpectancy a)1999(years)1996 1999(%)Adultliteracyrate1996 1999(years)Mean yearsofschooling1996 1999(thousandRupiah)Adjusted realpercapitaexpenditure1996 1999HDI1996HDI Rank19991996HDIReductionshortfall1996-199966.965.564.163.864.570.263.867.167.464.867.770.068.467.162.465.064.666.667.266.461.162.461.959.965.365.065.566.467.962.560.864.267.963.765.463.763.766.370.170.669.370.570.367.866.665.565.265.971.164.868.068.365.768.770.269.368.263.666.265.767.868.467.862.563.863.361.366.766.466.967.868.363.962.265.669.365.166.865.165.167.771.171.570.271.471.293.491.890.491.589.896.891.894.489.393.093.098.493.593.389.991.093.287.895.490.187.491.691.790.087.487.190.494.694.487.493.288.798.088.986.890.792.995.497.796.896.697.395.195.593.793.492.791.897.892.896.890.995.795.599.596.394.992.492.895.292.195.391.593.495.496.291.293.387.793.595.993.490.492.590.498.391.789.292.292.496.397.798.497.797.897.16.96.56.16.65.99.56.35.86.36.26.79.57.97.05.76.15.75.68.65.95.36.05.65.55.15.56.18.37.55.76.55.59.55.65.65.45.88.39.99.79.79.38.77.36.86.67.06.49.76.76.26.66.37.010.09.17.76.46.36.05.98.56.25.56.56.86.25.56.06.78.77.96.26.55.810.16.16.25.66.08.710.010.19.79.49.2578.6580.4581.4580.8576.5591.7570.8553.7564.7573.9567.4585.2563.9567.1568.2579.1574.8531.0582.5574.9566.6575.7557.9564.1512.4579.9577.9586.4584.6559.5574.7561.4588.2572.2567.1517.4573.3579.8599.7590.4594.8589.1582.8579.6574.3564.5576.6567.0593.4574.2571.5585.2577.7570.9581.2596.3576.8568.0578.2573.6554.4585.1567.3543.3561.4560.4559.2435.7575.2579.2577.4585.1564.7576.4570.8592.5570.7571.4538.5561.7580.2623.8588.5585.0589.7586.370.669.368.068.467.676.167.568.268.568.469.975.971.169.965.668.468.164.672.868.664.066.864.963.861.967.268.572.272.364.466.665.774.966.466.462.467.571.877.276.476.076.174.667.365.463.964.863.072.564.266.366.565.366.971.770.967.562.765.064.663.668.964.759.863.163.160.453.863.565.968.368.062.062.763.271.863.463.960.762.868.575.172.871.372.271.561015121611361131011027195772177103116205349622015119522724913998444021016017611162161244132481386134111613181147888411074101564193124136168381342541851812492791719851582131961789174155246190481414712-2.2-2.3-2.3-2.3-2.4-2.5-2.1-1.8-1.8-2.2-2.1-2.6-0.8-2.0-2.0-2.2-2.2-1.4-2.4-2.3-2.3-2.2-1.7-2.1-2.8-2.3-2.0-2.4-2.5-1.9-2.3-1.9-2.3-2.1-2.0-1.7-2.4-2.3-2.1-2.5-2.7-2.5-2.3(continued)ProvinceDistrict<strong>Human</strong><strong>Development</strong>Index(HDI)byDistrict,1996 and19996INDONESIAHUMAN DEVELOPMENT REPORT<strong>2001</strong>84
ProvinceDistrict32.WestJava33.Central Java01.Pandeglang02.Lebak03.Bogor04.Sukabumi05.Cianjur06.Bandung07.Garut08.Tasikmalaya09.Ciamis10.Kuningan11.Cirebon12.Majalengka13.Sumedang14.Indramayu15.Subang16.Purwakarta17.Karawang18.Bekasi19.Tangerang20.Serang71.Bogor72.Sukabumi73.Bandung74.Cirebon75.Tangerang76.Bekasi01.Cilacap02.Banyumas03.Purbalingga04.Banjarnegara05.Kebumen06.Purworejo07.Wonosobo08.Magelang09.Boyolali10.Klaten11.Sukoharjo12.Wonogiri13.Karanganyar14.Sragen15.Grobogan16.Blora17.Rembang18.Pati19.Kudus20.Jepara21.Demak22.Semarang23.TemanggungLifeexpectancy a)1999(years)1996 1999(%)Adultliteracyrate1996 1999(years)Mean yearsofschooling1996 1999(thousandRupiah)Adjusted realpercapitaexpenditure1996 1999HDI1996HDI Rank19991996HDIReductionshortfall1996-199962.964.860.260.663.861.062.265.258.064.162.563.561.661.665.161.963.662.161.065.262.458.266.364.366.865.765.7-63.764.663.963.963.764.164.164.567.365.668.870.669.567.364.366.464.568.164.866.165.267.667.264.368.361.662.065.262.463.666.659.465.563.964.963.063.066.563.365.063.562.466.663.859.667.765.768.267.167.166.667.268.167.467.467.267.767.768.069.469.169.171.170.170.867.869.968.071.667.869.668.770.670.789.781.391.586.489.893.594.492.692.995.192.488.186.287.993.167.082.490.780.890.188.488.397.799.097.695.186.4-80.789.881.478.481.386.283.581.678.679.180.371.678.468.681.972.083.277.982.982.484.987.388.992.184.893.290.893.796.095.694.796.896.293.991.786.688.995.666.786.294.584.887.688.792.297.497.698.394.694.397.184.291.286.285.987.286.386.586.281.481.184.076.478.371.685.674.184.880.088.883.189.289.491.06.45.55.25.06.85.46.06.65.76.06.25.85.45.76.43.84.95.74.98.06.45.68.89.19.68.47.7-4.95.85.15.15.26.14.95.95.76.26.54.85.74.85.14.55.65.16.05.45.66.35.36.86.05.35.58.05.75.77.06.26.36.46.15.76.06.83.95.46.25.46.86.65.99.38.69.68.48.89.45.46.45.35.65.96.35.46.36.26.77.45.66.15.35.64.85.95.66.96.06.16.65.6591.6594.5562.4546.3585.5583.9580.5585.9568.2578.8592.2589.5574.5587.6590.1588.6590.0583.2582.5589.8578.5571.3575.3596.6589.8608.3570.2-582.4585.8586.8580.5581.3590.9583.0584.4586.3595.0590.2588.2584.7577.9584.3577.7581.4591.8587.7586.8589.1588.4586.8584.2583.8570.2570.3587.5579.2576.5584.5574.4577.7588.9592.6581.1587.0584.6588.1591.0585.5584.7582.4584.7577.7586.6590.1589.7586.4585.7-579.9581.0572.2577.9590.1590.5580.4585.9582.0589.0591.8584.2587.6581.3585.0576.4588.6584.8586.7589.5583.6591.0584.668.267.063.961.668.566.667.669.863.968.768.567.564.666.270.160.465.766.863.470.666.663.172.373.474.373.768.3-64.868.365.564.465.167.865.766.467.267.569.467.068.363.765.763.766.367.567.167.367.669.969.264.664.661.261.066.663.263.666.661.765.364.865.061.662.866.656.563.164.360.964.763.560.869.768.470.768.168.368.763.166.063.063.664.965.363.965.164.465.166.564.064.562.364.261.664.765.266.065.365.967.967.11417221251971551287422393100131<strong>2001</strong>6767263173148231611562383927142111119610918021119012417416314013584146108230175228166134143138129708715142312338217616781223109127123227192792691821442371311692402949205552431869518716612611215611814012183152138205146226128116931081006169-2.2-1.9-2.0-1.2-1.8-2.2-2.3-2.2-1.8-2.2-2.3-2.0-2.0-2.2-2.3-2.1-2.0-2.0-1.9-2.7-2.1-1.8-2.1-2.7-2.4-2.8-0.4-1.7-1.9-1.9-1.3-0.8-2.0-1.7-1.5-2.0-1.9-2.1-2.1-2.3-1.6-1.6-1.8-1.7-1.9-1.5-1.8-1.7-1.9-1.9<strong>Human</strong><strong>Development</strong>Index(HDI)byDistrict,1996 and19996(continued)HUMAN DEVELOPMENTINDICATORSAND INDICES 85
ProvinceDistrict24.Kendal25.Batang26.Pekalongan27.Pemalang28.Tegal29.Brebes71.Magelang72.Surakarta73.Salatiga74.Semarang75.Pekalongan76.Tegal01.Kulon Progo02.Bantul03.GunungKidul04.Sleman71.Yogyakarta01.Pacitan02.Ponorogo03.Trenggalek04.Tulungagung05.Blitar06.Kediri07.Malang08.Lumajang09.Jember10.Banyuwangi11.Bondowoso12.Situbondo13.Probolinggo14.Pasuruan15.Sidoarjo16.Mojokerto17.Jombang18.Nganjuk19.Madiun20.Magetan21.Ngawi22.Bojonegoro23.Tuban24.Lamongan25.Gresik26.Bangkalan27.Sampang28.Pamekasan29.Sumenep71.Kediri72.Blitar73.Malang34.Yogyakarta35.East JavaLifeexpectancy a)1999(years)1996 1999(%)Adultliteracyrate1996 1999(years)Mean yearsofschooling1996 1999(thousandRupiah)Adjusted realpercapitaexpenditure1996 1999HDI1996HDI Rank19991996HDIReductionshortfall1996-199962.364.663.061.061.659.866.870.366.069.964.663.170.468.569.970.771.268.266.068.970.066.966.264.663.258.862.657.259.656.859.666.365.965.065.365.269.365.363.964.264.865.759.255.059.460.566.768.764.569.963.864.768.166.564.565.263.369.170.969.570.268.166.671.369.570.171.672.169.866.669.470.168.567.866.364.959.764.258.861.358.561.367.967.566.666.966.869.667.065.565.866.467.360.956.761.160.968.469.666.270.965.578.283.983.077.679.472.892.592.695.290.388.686.279.279.266.782.693.677.773.682.586.682.579.380.972.668.981.456.163.265.876.193.384.785.480.676.379.274.574.765.876.286.156.144.065.061.292.289.390.879.877.784.385.884.282.383.583.093.492.995.793.689.886.582.882.683.085.795.180.875.787.285.082.485.684.277.272.581.963.864.468.383.095.487.588.585.179.781.579.478.673.880.391.363.054.972.766.892.992.394.485.581.34.74.74.94.65.04.38.38.78.78.16.66.46.26.44.57.89.75.05.05.15.85.25.55.14.64.45.23.74.33.94.78.35.66.25.75.25.54.64.74.24.96.33.22.14.23.58.07.48.46.95.55.45.15.35.25.64.89.08.89.28.77.16.66.86.87.18.510.35.35.35.76.15.76.35.55.24.45.64.34.44.15.38.86.27.06.15.66.05.35.44.85.77.63.72.54.63.78.58.28.67.95.9580.0587.3583.5577.5586.1583.1589.9587.2572.3584.0576.1582.7593.5598.2588.3602.9591.3586.5581.7579.0593.0591.1588.1587.9591.8581.9592.9589.9595.4586.2584.4591.4591.0591.7588.6590.9585.9593.1578.0585.1583.3587.9575.0562.3579.6598.5588.7595.6595.0612.3594.3584.9579.5568.9575.8583.1580.2597.5591.9602.7591.5577.2594.5583.7590.0552.4601.5598.9582.8575.7579.7586.5581.9577.2577.4575.0570.4583.2583.2582.3580.7571.6587.9580.1582.7576.9589.8585.4580.5560.5579.3577.4580.1563.6564.3565.4583.8588.8588.0590.0597.8579.063.166.365.062.063.760.572.374.371.472.967.866.870.069.565.372.976.167.164.568.071.167.966.865.963.259.165.455.459.257.261.572.368.168.366.865.668.365.063.161.564.568.655.048.258.258.971.872.471.171.865.562.163.661.860.762.260.270.270.571.570.265.965.366.465.863.669.873.463.960.465.265.963.864.262.459.754.961.353.454.853.858.969.164.665.163.462.864.761.959.459.561.866.452.447.355.554.768.668.968.068.761.8236165192247229262421552311231496879187335145206120561221531722342711852842702792524111511015217910719323725320995285290275273493858222208163219245206251252211269911385102165272153248115961591482032562762302822772802613513712217319113021725825722186283292274278453960222-1.4-2.0-2.1-1.5-1.6-0.9-1.9-2.50.7-2.2-1.8-1.7-2.3-2.3-1.7-2.2-2.3-2.1-2.3-2.1-2.6-2.3-2.0-2.2-2.1-2.2-2.3-1.7-2.2-2.0-1.9-2.3-2.2-2.2-2.2-2.0-2.2-2.1-2.2-1.7-2.0-1.9-1.8-1.2-1.9-2.2-2.2-2.3-2.2-2.2-2.2<strong>Human</strong><strong>Development</strong>Index(HDI)byDistrict,1996 and19996(continued)INDONESIAHUMAN DEVELOPMENT REPORT<strong>2001</strong>86
ProvinceDistrict74.Probolinggo75.Pasuruan76.Mojokerto77.Madiun78.Surabaya01.Jembrana02.Tabanan03.Badung04.Gianyar05.Klungkung06.Bangli07.Karangasem08.Buleleng71.Denpasar01.WestLombok02.Central Lombok03.EastLombok04.Sumbawa05.Dompu06.Bima71.Mataram01.WestSumba02.EastSumba03.Kupang04.Southern Central-Timor05.Northern Central-Timor06.Belu07.Alor08.FloresTimur09.Sikka10.Ende11.Ngada12.Manggarai71.Kupang01.Sambas02.Pontianak03.Sanggau04.Ketapang05.Sintang06.Kapuas Hulu71.Pontianak51.Bali52.WestNusaTenggara53.East NusaTenggara61.WestKalimantanLifeexpectancy a)1999(years)1996 1999(%)Adultliteracyrate1996 1999(years)Mean yearsofschooling1996 1999(thousandRupiah)Adjusted realpercapitaexpenditure1996 1999HDI1996HDI Rank19991996HDIReductionshortfall1996-199965.862.569.768.466.668.471.269.069.365.769.065.064.670.253.753.253.253.755.155.760.060.357.662.063.864.862.161.564.664.361.363.362.6-55.763.565.363.864.863.464.668.154.962.262.967.564.170.069.168.369.872.670.570.767.170.566.466.071.656.556.056.056.557.958.562.861.759.063.465.265.163.562.966.065.762.864.764.163.456.864.666.564.966.064.565.169.557.863.664.184.185.892.191.093.281.983.185.575.575.079.263.375.491.858.452.566.581.780.180.583.068.073.783.567.077.572.190.478.980.682.486.484.6-79.079.577.482.479.280.187.079.468.078.980.486.287.793.591.793.884.785.487.577.678.678.566.183.293.863.864.468.684.782.081.887.869.077.275.567.679.573.489.582.484.688.892.383.094.682.083.481.884.079.682.888.982.772.881.283.26.76.58.28.38.75.76.67.56.15.65.53.85.39.13.43.44.35.36.06.17.24.64.76.44.24.94.76.25.25.05.35.75.0-4.55.44.44.84.75.67.56.34.65.25.27.17.18.48.79.06.17.18.16.36.15.54.16.29.74.04.34.86.06.06.47.85.05.44.94.35.35.06.25.45.35.66.35.29.65.15.65.15.14.95.87.96.85.25.75.6600.5596.2605.1599.8583.1601.7610.5591.7576.8596.6585.0586.6591.1589.8562.1577.5570.4574.7560.7559.9578.2547.1561.1563.5512.0515.6551.0521.6553.0500.7562.6552.3509.7-552.9552.8539.9564.8522.8530.7583.0609.0579.7544.3570.7581.7583.0575.7585.3589.4583.67595.01588.14582.39587.18588.86578.01583.98595.65559.23567.61568.91568.57558.51565.31578.10437.64562.96557.71472.90487.56494.65485.96528.82440.01501.27566.54579.38-569.45570.12567.57569.60569.39570.09578.57587.9565.9576.9571.269.567.574.973.672.169.872.971.567.266.368.161.265.174.651.651.254.459.259.059.464.657.258.164.255.959.659.562.062.958.962.664.259.5-57.462.561.363.860.361.168.770.156.760.963.665.163.668.668.769.365.568.768.264.462.964.457.563.172.149.950.752.156.856.257.363.145.455.757.049.253.751.855.358.151.555.863.260.966.655.860.961.060.860.360.864.765.754.260.460.68213010244575325014116411725518912287288286269272268201280276215282265266248239274241215266278242254225264257948262423120164464433106425314118914226318382892872842682702641842932732662902812852752622862721772358027123923424325024213310262423-2.4-2.3-2.9-2.7-2.2-2.4-2.5-2.3-2.0-2.2-2.3-2.1-1.8-2.2-1.5-1.0-1.7-1.8-1.9-1.7-1.6-3.0-1.8-2.7-2.5-2.4-2.7-2.6-2.4-2.6-2.6-1.41.5-1.6-1.6-0.9-2.0-0.5-0.9-2.3-2.4-1.8-1.1-2.0<strong>Human</strong><strong>Development</strong>Index(HDI)byDistrict,1996 and19996(continued)HUMAN DEVELOPMENTINDICATORSAND INDICES 87
ProvinceDistrict62.Central Kalimantan63.South Kalimantan64.East Kalimantan71.North Sulawesi72.Central Sulawesi73.South Sulawesi01.WestKotawaringin02.EastKotawaringin03.Kapuas04.South Barito05.North Barito71.PalangkaRaya01.Tanah Laut02.Kota Baru03.Banjar04.Barito Kuala05.Tapin06.South Hulu Sungai07.Central Hulu Sungai08.North Hulu Sungai09.Tabalong71.Banjarmasin01.Pasir02.Kutai03.Berau04.Bulongan71.Balikpapan72.Samarinda01.Gorontalo02.Bolaang Mongondow03.Minahasa04.Sangihe Talaud71.Gorontalo72.Manado73.Bitung01.Luwuk Banggai02.Poso03.Donggala04.BualToli-Toli71.Kodya Palu01.Selayar02.Bulukumba03.Bantaeng04.Jeneponto05.TakalarLifeexpectancy a)1999(years)1996 1999(%)Adultliteracyrate1996 1999(years)Mean yearsofschooling1996 1999(thousandRupiah)Adjusted realpercapitaexpenditure1996 1999HDI1996HDI Rank19991996HDIReductionshortfall1996-199968.360.368.166.660.665.068.467.068.665.269.471.264.560.060.756.163.059.360.257.159.462.969.665.166.670.269.167.663.668.469.069.663.070.566.261.460.458.159.964.362.965.067.560.463.269.261.069.068.162.768.369.467.969.666.170.372.166.261.662.357.864.760.961.958.861.064.570.566.067.671.270.168.665.069.870.471.064.470.767.663.561.360.262.066.466.268.470.863.966.793.790.390.396.890.479.690.792.893.295.994.198.785.486.194.089.287.389.291.290.088.293.985.789.785.288.591.893.794.595.199.194.497.499.097.086.994.787.490.696.878.074.663.462.973.294.892.893.597.292.683.293.193.495.096.795.498.185.891.395.590.993.192.091.093.291.796.286.993.690.391.795.596.194.396.299.095.498.999.797.891.496.289.492.098.284.379.670.568.876.86.66.17.27.36.66.16.56.16.26.76.29.85.35.56.54.95.35.85.85.55.98.05.46.76.06.78.18.46.06.37.66.68.29.87.95.87.05.86.29.45.35.74.14.74.97.16.67.87.67.06.56.76.86.67.16.79.85.46.17.05.36.05.95.96.06.48.55.57.46.77.08.99.06.06.77.77.28.710.28.06.47.46.26.49.95.66.24.64.95.4578.9586.7586.1582.4581.4580.6571.5575.5555.8570.4561.1585.8574.3575.9583.7560.5572.7580.4571.4577.1574.0586.9576.6584.4576.6578.0574.2578.5556.1571.0580.3568.4580.8581.2588.4572.1580.7566.8568.9589.2572.4574.7558.2572.3576.8565.4576.7578.1578.3569.0571.0577.60563.69571.51571.93569.20582.24574.78576.15575.41576.11574.28583.29575.29576.22576.70587.32568.61578.23571.41580.90590.90579.04573.82573.99583.92576.66583.63587.29580.59566.72561.96567.55566.16577.29572.22574.26572.56572.95574.2371.366.371.471.866.466.070.069.769.269.470.376.966.063.967.460.865.564.765.063.264.269.969.169.167.871.272.072.266.670.873.771.370.576.272.564.867.562.764.872.663.364.260.658.162.466.762.267.867.162.863.667.165.367.165.967.472.362.561.863.759.063.961.961.760.661.867.164.765.865.068.270.669.163.366.969.368.066.772.567.662.462.660.061.668.962.162.960.956.960.7519431821697786836521712221372591811991912352157389891265546431576022536343719713324019735232215261276245721362017711117397656201220161260158215224247218721291011255421341757532577856320419825322540211188238267244-2.5-2.3-2.3-2.6-2.2-1.9-2.1-2.4-1.9-2.3-2.1-2.7-2.2-1.8-2.2-1.7-1.7-2.0-2.1-1.9-1.9-2.1-2.4-2.2-2.1-2.2-1.7-2.2-2.1-2.4-2.5-2.3-2.3-2.5-2.6-1.9-2.5-1.9-2.1-2.4-1.5-1.50.9-1.4-1.6<strong>Human</strong><strong>Development</strong>Index(HDI)byDistrict,1996 and19996(continued)INDONESIAHUMAN DEVELOPMENT REPORT<strong>2001</strong>88
06.Gowa07.Sinjai08.Maros09.Pangkep10.Barru11.Bone12.Soppeng13.Wajo14.Sidenreng Rappang15.Pinrang16.Enrekang17.Luwu18.TanaToraja19.Polewali Mamasa20.Majene21.Mamuju71.UjungPandang72.Pare Pare01.Buton02.Muna03.Kendari04.Kolaka71.Kendari01.South-eastMaluku02.Central Maluku03.North Maluku04.Central Halmahera71.Ambon01.Merauke02.Jaya Wijaya03.Jaya Pura04.Paniai05.Fak Fak06.Sorong07.Manokwari08.Yapen Waropen09.Biak Numfor71.Jaya Pura74.South-east Sulawesi81.Maluku82.IrianJayaLifeexpectancy a)1999(years)1996 1999(%)Adultliteracyrate1996 1999(years)Mean yearsofschooling1996 1999(thousandRupiah)Adjusted realpercapitaexpenditure1996 1999HDI1996HDI Rank19991996HDIReductionshortfall1996-199966.766.265.163.963.263.767.366.566.265.368.768.169.562.558.963.667.968.564.762.663.863.3-67.160.862.762.668.356.262.565.464.266.162.265.260.963.264.863.663.162.769.969.568.667.166.767.270.667.269.568.572.071.472.862.962.367.071.471.866.164.065.264.765.263.865.865.671.471.458.064.465.666.068.064.166.162.864.166.765.067.464.572.673.372.476.782.176.775.881.878.279.677.287.372.077.482.782.893.088.182.578.589.690.6-98.289.492.888.698.173.729.383.949.888.384.075.677.895.895.086.393.267.476.978.576.882.683.881.078.276.182.882.789.792.073.380.989.584.295.294.285.283.286.987.397.196.396.893.690.399.979.136.090.349.894.988.274.185.594.696.887.195.871.25.45.24.75.25.85.35.54.95.25.66.16.35.54.75.95.59.57.86.25.47.26.8-7.26.16.96.09.55.02.06.73.56.56.55.55.26.98.56.67.15.05.95.45.35.86.25.85.65.05.96.06.47.15.75.26.75.69.98.46.66.06.36.79.96.77.17.36.110.65.22.67.83.67.56.95.35.47.69.86.87.65.6574.6533.9567.8569.3582.7578.1581.2581.8584.4575.7550.8569.5564.5555.8571.2567.6582.8583.1564.9551.5559.0561.8-549.6564.3563.5558.1577.3551.6495.9568.3475.1537.7564.6574.2556.0584.8579.1568.8573.6566.9571.22571.76571.52576.33577.30568.18581.93578.74571.20574.22572.78574.61572.98574.53573.82574.30582.28575.47565.37556.85570.32563.52578.03578.10577.10579.54582.83583.32579.50583.43451.70578.03587.19579.79578.50588.93590.27571.8576.9579.964.561.062.463.365.563.866.166.666.165.565.368.865.261.262.564.673.371.365.461.766.866.6-69.864.667.064.974.356.843.966.748.965.664.664.460.869.671.066.268.260.262.762.561.562.763.161.864.060.963.863.567.268.063.559.462.162.771.469.762.559.862.562.168.364.766.265.567.373.057.048.765.643.667.363.960.160.866.069.762.967.258.82072582452321812251681571681811869218825524220128531842501501577520114719417281291154289178201212259785920132519519922919718022215123616017068561722592121941328202255200209501328910567326529110429466157252241923019525-1.71.6-1.3-1.2-1.9-1.8-1.8-2.6-1.9-1.81.7-1.4-1.7-1.7-1.0-1.7-1.9-1.8-2.0-1.7-2.3-2.4-2.61.7-1.61.9-1.70.72.1-1.5-2.21.7-1.3-2.30.4-2.3-1.7-2.1-1.5-1.5(continued)Note:Extrapolation based on Population Census(PC)1971, PC 1980,PC 1990,1995SurveyBetween Census and 1996 Socio-economicsurvey.The number before each districtisthe official area code.Districtrefers to both Regencyand Citya)Source: BPS special tabulationProvinceDistrict<strong>Human</strong><strong>Development</strong>Index(HDI)byDistrict,1996 and19996HUMAN DEVELOPMENTINDICATORSAND INDICES 89
ProvinceDistrict11.Aceh12.North Sumatera13.WestSumatera01.SouthAceh02.South-eastAceh03.EastAceh04.CentralAceh05.WeastAceh06.Aceh Besar07.Pidie08.NorthAceh71.BandaAceh72.Sabang01.Nias02.SouthTapanuli03.Central Tapanuli04.NorthTapanuli05.Labuhan Batu06.Asahan07.Simalungun08.Dairi09.Karo10.DeliSerdang11.Langkat71.Sibolga72.Tanjung Balai73.Pematang Siantar74.TebingTinggi75.Medan76.Binjai01.South Pesisir02.Solok03.Sawah Lunto/Sijunjun04.Tanah Datar05.Padang Pariaman06.Agam07.Limapuluh Koto08.Pasaman71.Padang72.Solok73.Sawah Lunto74.Padang Panjang75.BukitTinggi76.PayakumbuhLifeexpectancy a)Proportion ofpopulation(years)(% of totals) (%) (%)Adultliteracyrate(years)Mean yearsofschoolingShare ofearnedincomeGDIGDI Rank69.669.167.465.869.869.368.670.171.269.570.470.270.568.466.367.467.167.468.969.267.372.767.968.770.468.972.271.571.271.166.262.062.169.166.369.166.662.870.868.272.171.271.868.749.949.951.448.550.648.450.149.149.952.950.450.149.749.150.150.548.749.849.750.750.251.049.049.749.949.749.650.551.049.749.851.148.852.752.452.353.650.351.250.353.453.150.851.565.665.163.562.065.865.364.766.167.265.666.566.366.664.562.563.563.263.664.965.263.568.764.064.866.464.968.267.567.267.162.358.358.565.262.565.262.859.266.864.368.267.367.964.850.150.148.651.549.451.649.950.950.147.149.649.950.350.949.949.551.350.250.349.349.949.051.150.450.150.450.449.549.050.350.348.951.247.347.647.746.449.748.849.746.646.949.248.590.193.692.687.385.792.395.486.891.283.791.796.892.681.698.789.893.794.490.889.994.692.890.595.697.595.297.496.898.195.789.893.088.490.990.992.193.691.096.296.695.796.597.896.096.298.097.095.296.095.599.095.797.592.297.698.797.089.899.997.998.898.596.797.599.198.597.798.799.598.999.398.899.599.097.396.494.995.896.696.896.196.998.298.599.398.699.798.36.87.57.25.76.26.67.45.67.46.07.110.08.05.07.46.47.66.76.36.66.97.37.17.38.57.49.08.69.58.56.66.06.66.96.16.76.76.29.58.77.79.49.58.37.78.57.76.97.87.38.36.88.57.57.510.58.76.48.17.58.97.87.57.78.48.68.38.19.18.29.99.310.39.37.36.37.37.27.07.26.97.09.78.78.09.79.98.530.732.134.224.543.026.328.627.534.132.733.723.227.942.144.241.547.318.128.539.450.146.928.224.527.718.524.325.727.028.829.938.036.734.333.237.837.840.929.030.129.638.829.133.169.367.965.875.557.073.771.472.565.967.366.376.872.157.955.858.552.781.971.560.649.953.171.875.572.381.575.774.373.071.270.162.063.365.766.862.262.259.171.069.970.461.270.966.959.061.260.751.763.056.758.056.262.657.258.857.556.049.864.860.965.946.857.463.161.369.058.455.160.449.559.458.860.761.057.558.659.360.358.262.860.560.561.860.859.467.362.762.1835226241381081462812686118152242125082661242247497178632447587544912091806410326585740537662732Gender-related<strong>Development</strong>Index(GDI)byDistrict,19997MaleMale Male Male MaleFemaleFemale Female Female FemaleINDONESIAHUMAN DEVELOPMENT REPORT<strong>2001</strong>90
14.Riau15.Jambi16.South Sumatera17.Bengkulu18.Lampung31.Jakarta01.Indragiri Hulu02.Indragiri Ilir03.Kepulauan Riau04.Kampar05.Bengkalis71.Pekan Baru72.Batam01.Kerinci02.Bungo Tebo03.Sarolangun Bangko04.Batanghari05.Tanjung Jabung71.Jambi01.Ogan Komering Ulu02.Ogan Komering Hilir03.MuaraEnim(Liot)04.Lahat05.MusiRawas06.MusiBanyuasin07.Bangka08.Balitung71.Palembang72.Pangkal Pinang01.South Bengkulu02.Rejang Lebong03.North Bengkulu71.Bengkulu01.South Lampung02.Central Lampung03.North Lampung04.WestLampung71.Bandar Lampung71.South Jakarta72.EastJakarta73.Central Jakarta74.WestJakarta75.North JakartaLifeexpectancy a)(years) (%) (%)Adultliteracyrate(years)Mean yearsofschoolingShare ofearnedincomeGDIGDI Rank69.868.667.467.167.973.266.670.070.367.670.772.271.470.265.468.167.769.770.469.764.365.765.263.168.668.368.969.770.365.764.067.571.467.068.767.067.069.773.173.672.273.573.349.249.649.649.148.650.248.649.449.648.849.050.348.549.950.249.650.147.050.749.247.950.149.050.249.349.349.651.350.649.449.248.449.648.848.348.947.848.850.749.350.650.650.365.864.763.563.364.069.362.866.066.463.766.768.367.466.261.664.263.865.866.465.860.561.961.459.464.764.465.065.866.461.960.263.667.463.164.863.163.165.769.269.768.369.669.450.850.450.450.951.449.851.450.650.451.251.049.751.550.149.850.449.953.049.350.852.149.951.049.850.750.850.448.749.450.650.851.650.451.351.751.252.251.249.350.749.449.449.793.790.590.389.488.396.889.895.987.693.593.898.994.593.488.688.692.187.993.087.890.092.593.487.990.782.190.094.089.785.389.086.897.388.384.489.690.493.796.697.896.296.895.697.496.996.595.995.198.995.897.994.497.897.2100.098.396.496.397.198.295.897.795.196.898.398.894.695.993.097.198.097.495.595.993.799.395.093.994.794.298.898.999.099.298.898.76.96.16.26.55.99.06.15.96.25.86.69.78.67.25.65.45.25.38.05.75.06.06.45.75.15.46.28.17.35.56.05.39.75.55.75.35.48.29.49.59.08.78.57.87.47.17.56.810.47.36.56.96.87.410.49.58.17.27.16.76.49.06.76.07.07.36.75.96.57.19.38.56.87.06.310.66.66.66.06.59.110.710.710.410.210.021.124.924.031.629.025.229.117.416.524.314.119.522.224.330.430.024.715.323.331.524.120.227.427.626.619.516.224.621.837.134.134.027.427.630.231.527.827.227.123.127.525.323.978.975.176.068.471.074.870.982.683.575.785.980.577.875.769.670.075.384.776.768.575.979.872.672.473.480.583.875.478.262.965.966.072.672.469.868.572.272.872.976.972.574.776.153.154.652.459.457.061.257.447.946.554.444.854.957.955.955.858.053.344.855.659.249.947.655.051.646.747.445.755.953.259.458.759.563.055.458.055.755.660.064.760.361.960.959.124182571221232532701872801811131561571092042791678324125617922826725827615320578897325170107161165691365375284Male Male Male MaleFemale Female Female FemaleProportion ofpopulation(% of totals)MaleFemale(continued)ProvinceDistrictGender-related<strong>Development</strong>Index(GDI)byDistrict,19997HUMAN DEVELOPMENTINDICATORSAND INDICES 91
32.WestJava33.Central Java01.Pandeglang02.Lebak03.Bogor04.Sukabumi05.Cianjur06.Bandung07.Garut08.Tasikmalaya09.Ciamis10.Kuningan11.Cirebon12.Majalengka13.Sumedang14.Indramayu15.Subang16.Purwakarta17.Karawang18.Bekasi19.Tangerang20.Serang71.Bogor72.Sukabumi73.Bandung74.Cirebon75.Tangerang76.Bekasi01.Cilacap02.Banyumas03.Purbalingga04.Banjarnegara05.Kebumen06.Purworejo07.Wonosobo08.Magelang09.Boyolali10.Klaten11.Sukoharjo12.Wonogiri13.Karanganyar14.Sragen15.Grobogan16.Blora17.Rembang18.Pati19.Kudus20.Jepara21.Demak22.Semarang23.TemanggungLifeexpectancy a)(years) (%) (%)Adultliteracyrate(years)Mean yearsofschoolingShare ofearnedincomeGDIGDI Rank66.270.363.463.867.164.365.568.561.267.465.866.864.864.868.465.166.965.364.368.565.661.469.767.670.269.169.068.569.170.169.469.469.169.669.669.971.471.171.173.273.272.869.872.069.973.769.871.770.772.772.749.650.448.047.150.349.349.648.750.050.749.850.849.551.450.549.150.248.350.647.649.849.349.351.650.350.150.448.649.949.849.350.450.049.248.651.350.851.651.250.751.551.250.250.350.351.650.849.948.151.150.562.466.359.760.163.260.561.764.657.663.662.062.961.161.164.561.363.161.560.564.661.957.865.763.766.265.165.164.665.266.165.465.465.265.765.766.067.467.267.269.269.368.965.868.066.069.865.867.766.868.768.850.449.652.152.949.750.750.451.350.049.450.249.250.548.649.550.949.851.749.452.550.350.750.748.449.749.949.651.450.150.250.749.650.150.951.448.749.248.448.849.348.548.849.849.749.848.449.250.151.948.949.589.278.490.987.991.894.993.293.195.895.091.787.681.585.193.655.280.691.980.182.483.988.596.497.197.292.191.795.777.286.681.281.582.081.380.880.674.372.377.668.370.762.578.066.978.672.183.776.083.183.987.595.291.495.693.695.897.298.196.498.297.597.196.191.993.097.778.691.997.189.392.693.696.398.498.299.597.696.998.891.195.891.190.392.591.592.192.388.990.891.085.087.081.493.481.591.588.994.290.595.195.294.66.25.44.84.97.55.35.26.65.76.06.05.65.05.56.43.14.75.74.76.26.05.28.78.19.07.78.18.74.75.84.95.25.25.75.05.75.45.86.64.85.44.54.94.25.45.06.35.35.35.95.37.36.75.86.28.56.06.27.46.76.66.86.76.46.47.24.76.06.76.07.47.36.59.89.110.39.29.510.16.17.05.86.16.56.95.87.07.07.78.26.46.96.26.35.36.56.37.56.66.97.36.026.130.426.622.225.619.826.324.529.125.836.824.923.522.929.219.929.928.521.913.822.924.026.825.528.723.825.221.723.328.019.234.926.929.430.335.238.837.335.033.231.931.231.731.528.129.832.724.330.931.640.573.969.673.477.874.480.273.775.570.974.263.275.176.577.170.880.170.171.578.186.277.176.073.274.571.376.274.878.376.772.080.865.173.170.669.764.861.262.765.066.868.168.868.368.571.970.267.375.769.168.459.554.657.452.949.555.747.453.955.954.154.562.053.049.348.558.540.255.757.146.142.650.449.360.656.462.455.756.955.450.357.446.759.455.258.257.960.561.961.461.858.558.355.258.155.355.956.860.353.460.461.165.517102072451642591951541911863420624825192288162130274284237247551442916313316923912126877174104114563845419510117510517115513566203614810Male Male Male MaleFemale Female Female FemaleProportion ofpopulation(% of totals)MaleFemale(continued)ProvinceDistrictGender-related<strong>Development</strong>Index(GDI)byDistrict,19997INDONESIAHUMAN DEVELOPMENT REPORT<strong>2001</strong>92
24.Kendal25.Batang26.Pekalongan27.Pemalang28.Tegal29.Brebes71.Magelang72.Surakarta73.Salatiga74.Semarang75.Pekalongan76.Tegal01.Kulon Progo02.Bantul03.GunungKidul04.Sleman71.Yogyakarta01.Pacitan02.Ponorogo03.Trenggalek04.Tulungagung05.Blitar06.Kediri07.Malang08.Lumajang09.Jember10.Banyuwangi11.Bondowoso12.Situbondo13.Probolinggo14.Pasuruan15.Sidoarjo16.Mojokerto17.Jombang18.Nganjuk19.Madiun20.Magetan21.Ngawi22.Bojonegoro23.Tuban24.Lamongan25.Gresik26.Bangkalan27.Sampang28.Pamekasan29.Sumenep71.Kediri72.Blitar73.Malang34.Yogyakarta35.East JavaLifeexpectancy a)(years) (%) (%)Adultliteracyrate(years)Mean yearsofschoolingShare ofearnedincomeGDIGDI Rank66.670.168.466.467.165.171.173.071.572.270.168.573.471.572.173.774.271.868.571.472.170.569.868.266.861.566.160.563.160.263.169.969.568.668.868.871.668.967.467.768.469.362.658.362.962.670.471.768.172.967.450.251.550.250.350.050.752.150.852.051.550.449.849.549.649.849.851.250.851.650.451.950.749.949.851.252.051.051.351.350.150.251.451.150.851.351.450.450.848.250.250.748.752.152.350.952.751.350.051.049.950.862.766.164.562.663.261.467.169.167.668.366.164.669.567.568.269.870.467.964.667.568.266.565.864.362.957.962.357.059.456.659.465.965.564.764.964.967.765.063.563.964.565.359.054.959.259.066.467.764.269.063.549.848.549.849.750.049.347.949.248.048.549.650.250.550.450.250.248.849.248.449.648.149.350.150.348.848.049.048.748.749.949.848.648.949.248.748.649.649.251.849.849.351.347.947.749.147.348.750.049.050.149.277.279.876.674.178.075.989.089.392.890.384.880.475.574.274.678.491.772.567.482.479.376.379.177.371.463.273.953.955.157.976.993.283.382.978.771.672.070.970.464.473.287.055.946.864.557.588.787.691.678.374.591.691.992.490.989.390.398.196.898.997.295.092.890.491.292.393.098.689.784.792.291.288.792.391.483.683.190.774.675.079.489.497.892.294.492.188.492.088.186.583.288.295.671.564.482.177.797.697.097.493.088.64.84.64.74.65.14.28.28.18.58.06.55.96.15.86.67.59.64.74.75.35.75.35.64.94.73.94.73.63.73.34.78.25.66.35.44.85.14.54.64.25.07.03.12.03.82.97.87.58.07.15.36.05.56.05.96.15.59.89.710.09.47.67.37.67.87.79.511.16.06.06.16.66.27.16.15.75.16.65.25.14.96.09.46.87.86.86.37.16.16.25.56.38.24.53.05.54.69.28.89.28.86.734.025.827.030.424.226.433.735.541.833.628.525.439.035.446.138.336.039.234.040.229.531.329.228.425.021.632.921.730.020.429.324.829.129.728.932.735.127.122.222.429.623.935.037.626.931.232.228.032.638.728.766.074.273.069.675.873.666.364.558.266.471.574.661.064.653.961.764.060.866.059.870.568.770.871.675.078.467.178.370.079.670.775.270.970.371.167.364.972.977.877.670.476.165.062.473.168.867.872.067.461.371.357.352.152.353.750.249.764.266.569.864.657.454.364.662.163.567.469.461.555.063.557.257.256.554.347.839.155.437.646.637.751.156.756.157.254.656.460.451.747.045.553.955.147.343.545.446.462.260.262.066.453.212522121719924024317721512218814332153431802012912814218925429116829426929323113715012718414560227263277193176260282278271316736123Male Male Male MaleFemale Female Female FemaleProportion ofpopulation(% of totals)MaleFemale(continued)ProvinceDistrictGender-related<strong>Development</strong>Index(GDI)byDistrict,19997HUMAN DEVELOPMENTINDICATORSAND INDICES 93
74.Probolinggo75.Pasuruan76.Mojokerto77.Madiun78.Surabaya01.Jembrana02.Tabanan03.Badung04.Gianyar05.Klungkung06.Bangli07.Karangasem08.Buleleng71.Denpasar01.WestLombok02.Central Lombok03.EastLombok04.Sumbawa05.Dompu06.Bima71.Mataram01.WestSumba02.EastSumba03.Kupang04.Southern Central-Timor05.Northern Central-Timor06.Belu07.Alor08.FloresTimur09.Sikka10.Ende11.Ngada12.Manggarai71.Kupang01.Sambas02.Pontianak03.Sanggau04.Ketapang05.Sintang06.Kapuas Hulu71.Pontianak51.Bali52.WestNusaTenggara53.East NusaTenggara61.WestKalimantanLifeexpectancy a)(years) (%) (%)Adultliteracyrate(years)Mean yearsofschoolingShare ofearnedincomeGDIGDI Rank69.466.072.071.170.271.974.772.572.769.172.568.367.973.958.157.757.758.159.660.264.763.560.765.367.167.065.364.767.967.664.666.665.965.358.566.568.466.867.966.467.071.659.465.565.950.652.650.151.450.249.050.948.349.051.848.949.651.450.251.852.754.149.249.750.750.549.748.949.349.449.649.751.354.053.253.652.250.748.348.849.148.948.849.149.449.650.051.950.749.065.562.268.167.166.367.970.968.668.865.168.664.464.069.854.754.354.354.756.156.760.959.857.261.563.363.261.561.064.063.860.862.862.161.555.162.764.563.064.062.663.267.555.961.762.149.447.449.948.649.851.049.151.851.048.351.150.448.649.848.247.345.950.850.349.349.550.451.150.750.650.450.348.746.046.846.447.849.351.851.250.951.151.250.950.650.450.048.149.351.078.982.289.787.290.577.878.881.268.370.571.854.374.990.755.055.263.577.276.775.182.164.972.272.164.877.472.586.378.483.185.490.778.094.574.375.474.277.473.677.782.775.465.477.476.194.294.197.496.697.291.692.493.286.887.485.178.192.496.973.775.675.191.987.789.093.873.282.078.670.381.974.493.087.686.793.294.488.896.989.891.089.190.685.687.895.290.281.283.590.26.36.57.77.98.45.46.17.15.45.14.73.25.29.03.23.44.45.35.55.96.84.75.14.63.95.04.95.65.05.05.26.14.79.34.44.94.54.54.45.37.25.94.55.25.08.07.89.19.69.86.98.09.07.27.26.35.07.310.44.95.45.36.76.57.08.95.25.75.24.65.55.26.96.05.56.26.75.710.35.76.35.65.75.56.48.57.76.05.96.230.527.027.829.727.131.734.828.929.935.537.336.728.630.526.730.825.432.137.633.528.635.031.835.823.927.630.136.242.838.154.344.241.226.334.732.436.933.928.027.525.333.030.236.732.569.573.072.270.372.968.365.271.170.164.562.763.371.469.573.369.274.667.962.466.571.465.068.264.276.172.469.963.857.261.945.755.858.873.765.367.663.166.172.072.574.767.069.863.367.557.952.459.960.459.760.164.161.357.658.062.054.153.865.139.142.438.851.553.852.254.642.450.553.939.646.445.951.956.248.555.862.359.458.252.255.858.456.852.352.354.160.445.956.855.711221371627268184611710635190197112902862922291982181852852361942892722752241482501583079102220159981342162151926261415Male Male Male MaleFemale Female Female FemaleProportion ofpopulation(% of totals)MaleFemale(continued)ProvinceDistrictGender-related<strong>Development</strong>Index(GDI)byDistrict,19997INDONESIAHUMAN DEVELOPMENT REPORT<strong>2001</strong>94
62.Central Kalimantan63.South Kalimantan64.East Kalimantan71.North Sulawesi72.Central Sulawesi73.South Sulawesi01.WestKotawaringin02.EastKotawaringin03.Kapuas04.South Barito05.North Barito71.PalangkaRaya01.Tanah Laut02.Kota Baru03.Banjar04.Barito Kuala05.Tapin06.South Hulu Sungai07.Central Hulu Sungai08.North Hulu Sungai09.Tabalong71.Banjarmasin01.Pasir02.Kutai03.Berau04.Bulongan71.Balikpapan72.Samarinda01.Gorontalo02.Bolaang Mongondow03.Minahasa04.Sangihe Talaud71.Gorontalo72.Manado73.Bitung01.Luwuk Banggai02.Poso03.Donggala04.BualToli-Toli71.Kodya Palu01.Selayar02.Bulukumba03.Bantaeng04.Jeneponto05.TakalarLifeexpectancy a)(years) (%) (%)Adultliteracyrate(years)Mean yearsofschoolingShare ofearnedincomeGDIGDI Rank71.262.871.070.064.570.371.469.971.668.172.374.268.163.464.159.466.662.763.760.562.866.472.667.969.573.272.170.666.971.872.473.166.372.869.665.463.161.963.968.368.170.472.865.868.648.850.549.149.649.451.349.448.148.949.649.448.448.549.650.350.552.051.951.251.851.549.946.749.748.547.150.749.350.648.348.449.551.950.947.748.949.549.548.950.152.852.152.252.151.167.359.167.066.160.766.367.465.967.664.268.470.364.259.760.456.062.759.060.056.959.162.668.764.165.669.368.266.663.167.868.569.262.568.865.661.659.458.360.164.464.266.468.962.064.751.249.650.950.550.648.750.651.951.150.450.651.751.550.549.749.548.048.148.848.248.550.153.350.451.552.949.350.849.451.751.650.548.149.152.351.250.550.551.149.947.247.947.847.949.092.889.490.097.390.379.691.190.592.994.893.897.780.587.993.385.289.289.387.289.487.094.279.490.387.487.492.693.995.295.299.095.899.199.697.688.694.686.190.197.179.577.267.365.473.096.996.396.897.294.987.195.196.297.098.697.798.691.094.597.796.997.194.995.197.696.798.493.496.793.195.798.498.293.497.399.095.198.799.897.994.097.992.593.999.289.882.674.172.581.26.65.97.17.56.66.06.16.26.36.76.39.34.85.36.44.85.45.45.45.45.57.84.86.66.16.48.18.36.26.57.77.28.79.97.85.97.15.86.09.35.15.74.44.75.07.57.28.57.67.47.07.37.36.97.57.110.26.06.97.65.86.76.46.56.77.39.16.28.27.27.59.59.75.86.97.67.28.710.58.36.97.76.66.810.56.16.84.85.15.826.533.221.121.627.126.818.021.026.033.935.729.129.630.332.738.934.639.842.440.734.925.616.523.323.420.918.524.425.919.523.432.829.921.714.230.728.427.219.526.628.627.529.730.931.073.566.878.978.472.973.282.079.074.066.164.370.970.469.767.361.165.460.257.659.365.174.483.576.776.679.181.575.674.180.576.667.270.178.385.869.371.672.880.573.471.472.570.369.169.057.956.953.553.954.153.349.352.057.761.764.465.756.055.258.356.658.559.560.458.557.056.447.253.453.555.151.958.053.552.458.664.059.257.546.956.654.951.246.159.152.252.752.449.353.891321201922249222116421691511731001419374599413114326120220117722311020021290198111926414018223027385219208214246196Male Male Male MaleFemale Female Female FemaleProportion ofpopulation(% of totals)MaleFemale(continued)ProvinceDistrictGender-related<strong>Development</strong>Index(GDI)byDistrict,19997HUMAN DEVELOPMENTINDICATORSAND INDICES 95
06.Gowa07.Sinjai08.Maros09.Pangkep10.Barru11.Bone12.Soppeng13.Wajo14.Sidenreng Rappang15.Pinrang16.Enrekang17.Luwu18.TanaToraja19.Polewali Mamasa20.Majene21.Mamuju71.UjungPandang72.Pare Pare01.Buton02.Muna03.Kendari04.Kolaka71.Kendari01.South-eastMaluku02.Central Maluku03.North Maluku04.Central Halmahera71.Ambon01.Merauke02.Jaya Wijaya03.Jaya Pura04.Paniai05.Fak Fak06.Sorong07.Manokwari08.Yapen Waropen09.Biak Numfor71.Jaya Pura74.South-east Sulawesi81.Maluku82.IrianJayaProvinceDistrictLifeexpectancy a)(years) (%) (%)Adultliteracyrate(years)Mean yearsofschoolingShare ofearnedincomeGDIGDI Rank72.071.570.669.168.669.272.769.271.570.574.173.574.964.864.169.073.573.968.165.967.166.667.172.265.767.767.573.559.766.267.568.070.066.068.164.666.068.666.969.366.449.352.151.751.952.652.555.053.252.051.550.749.648.052.551.648.351.251.451.050.149.249.650.850.550.249.548.850.848.448.949.047.547.548.647.048.949.348.650.150.048.468.067.566.665.264.765.268.765.267.566.670.269.671.161.060.465.069.670.064.262.163.262.863.268.361.963.863.769.656.262.463.664.166.062.264.260.962.264.763.165.462.650.747.948.348.147.447.545.046.848.048.549.350.452.047.648.451.748.848.649.049.950.850.449.249.549.850.551.249.251.651.151.052.552.551.453.051.150.751.450.050.051.772.376.773.078.982.977.476.072.378.677.684.689.067.577.086.578.492.991.781.176.681.883.695.595.495.690.885.9100.075.023.786.942.294.085.065.281.892.094.782.694.264.881.780.581.186.984.885.481.080.787.988.395.095.078.685.393.089.497.797.089.990.991.991.098.897.398.196.394.699.983.048.393.557.495.791.482.489.297.398.791.897.477.35.55.24.85.26.25.45.34.55.55.45.86.65.24.96.35.09.37.86.05.35.76.29.36.46.96.85.610.54.51.57.12.96.96.14.44.76.99.16.27.34.86.55.75.96.46.36.36.15.76.56.77.17.66.15.57.16.210.59.07.26.86.97.210.67.07.37.96.610.85.93.78.54.28.07.66.26.18.310.47.48.06.429.126.022.318.621.828.025.819.220.921.635.124.233.732.328.028.227.329.837.035.533.824.225.326.234.527.230.136.932.948.126.346.417.927.625.230.329.324.132.231.335.270.974.077.781.478.272.074.280.879.178.464.975.866.367.772.071.872.770.263.064.566.275.874.773.865.572.869.963.167.151.973.753.682.172.474.869.770.775.967.868.764.855.651.146.843.947.251.850.341.847.548.163.156.659.952.552.555.361.461.859.256.258.450.856.957.960.956.757.869.852.647.756.243.450.755.851.154.658.858.457.461.055.7166233265281262225238287257252231397021021117244398214799234132111511361151209255149283235160232183889611416Gender-related<strong>Development</strong>Index(GDI)byDistrict,19997Male Male Male MaleFemale Female Female FemaleProportion ofpopulation(% of totals)MaleFemale(continued)Note:Extrapolation based on Population Census(PC)1971, PC 1980,PC 1990,1995SurveyBetween Census and 1996 Socio-economicsurvey.The number before each districtisthe official area code.Districtrefers to both Regencyand Citya)Source: BPS special tabulationINDONESIAHUMAN DEVELOPMENT REPORT<strong>2001</strong>96
11.Aceh12.North Sumatera13.WestSumatera01.SouthAceh02.South-eastAceh03.EastAceh04.CentralAceh05.WeastAceh06.Aceh Besar07.Pidie08.NorthAceh71.BandaAceh72.Sabang01.Nias02.SouthTapanuli03.Central Tapanuli04.NorthTapanuli05.Labuhan Batu06.Asahan07.Simalungun08.Dairi09.Karo10.DeliSerdang11.Langkat71.Sibolga72.Tanjung Balai73.Pematang Siantar74.TebingTinggi75.Medan76.Binjai01.South Pesisir02.Solok03.Sawah Lunto/Sijunjun04.Tanah Datar05.Padang Pariaman06.Agam07.Limapuluh Koto08.Pasaman71.Padang72.Solok73.Sawah Lunto74.Padang Panjang75.BukitTinggi76.Payakumbuh8.32.86.10.03.32.20.02.60.00.08.90.05.00.02.23.32.50.02.26.73.30.04.44.45.04.010.00.02.20.02.52.58.60.02.20.05.72.22.30.00.05.015.012.554.453.858.847.841.857.954.537.359.347.562.653.358.545.163.251.753.952.561.159.563.460.442.354.065.671.749.056.254.260.955.455.152.867.845.471.874.362.056.253.956.256.361.558.438.441.040.332.245.230.641.138.736.645.241.631.735.746.148.745.149.932.037.244.550.749.738.735.035.429.334.929.535.835.134.341.741.040.342.543.943.042.534.835.735.942.739.940.649.949.951.448.550.648.450.149.149.952.950.450.149.749.150.150.548.749.849.750.750.251.049.049.749.949.749.650.551.049.749.851.148.852.752.452.353.650.351.250.353.453.150.851.5271.9261.9299.6295.4340.4258.7265.8219.6323.3224.2290.9260.9219.1342.2311.6337.7329.7242.4219.1252.2350.5312.4214.0291.4289.2217.8205.4265.1282.6228.6321.5278.2331.7284.1257.2317.3263.0291.0331.9313.9281.1308.8253.6247.2383.4385.6389.5433.2372.6319.2463.6364.6360.1380.1408.1401.9314.7401.8373.2390.7366.4517.5325.8311.1359.1349.9344.9482.5412.7398.7343.2320.2427.2304.8392.8325.0397.2366.7382.7408.2327.1310.3433.4404.5375.2363.3411.0340.952.447.351.538.550.642.540.642.243.442.450.337.443.336.649.050.152.530.742.754.046.948.647.543.444.331.150.938.642.940.045.949.858.140.746.440.945.549.144.643.040.153.157.257.9616824562206228212189208632531912618967432842022912495110190170283592432012331397252271352241468416419923237117ProvinceDistrictWomen intheparliament(% oftotal) (% oftotal) GEMGEMRankFemalesin seniorofficial,managerial,and technical staffpositions(% oftotal) (% oftotal)(Thousand Rp)FemaleMaleFemales in thelabourforceFemalepopulationAverage nonagriculturalwageGenderEmpowerementMeasure (GEM),byDistrict,19998HUMAN DEVELOPMENTINDICATORSAND INDICES 97
14.Riau15.Jambi16.South Sumatera17.Bengkulu18.Lampung31.Jakarta01.Indragiri Hulu02.Indragiri Ilir03.Kepulauan Riau04.Kampar05.Bengkalis71.Pekan Baru72.Batam01.Kerinci02.Bungo Tebo03.Sarolangun Bangko04.Batanghari05.Tanjung Jabung71.Jambi01.Ogan Komering Ulu02.Ogan Komering Hilir03.MuaraEnim(Liot)04.Lahat05.MusiRawas06.MusiBanyuasin07.Bangka08.Balitung71.Palembang72.Pangkal Pinang01.South Bengkulu02.Rejang Lebong03.North Bengkulu71.Bengkulu01.South Lampung02.Central Lampung03.North Lampung04.WestLampung71.Bandar Lampung71.South Jakarta72.EastJakarta73.Central Jakarta74.WestJakarta75.North Jakarta(continued)2.08.03.210.04.57.92.54.46.74.47.00.0--2.90.07.510.05.012.58.911.12.94.56.713.62.23.37.012.00.07.72.210.02.24.44.40.02.2--------–43.237.552.445.546.134.945.244.240.439.747.444.041.851.140.835.533.623.244.248.143.849.548.267.246.449.652.857.835.722.153.949.548.146.547.345.325.149.540.739.436.631.023.930.131.636.739.536.934.635.027.927.534.827.028.531.937.930.636.032.822.829.436.433.138.739.338.639.632.126.836.732.541.641.437.837.035.837.237.937.136.535.730.838.635.535.249.249.649.649.148.650.248.649.449.648.849.050.348.549.950.249.650.147.050.749.247.950.149.050.249.349.349.651.350.649.449.248.449.648.848.348.947.848.850.749.350.650.650.3360.1281.6214.7254.6236.2376.9322.3216.4267.6263.0218.3400.0524.1289.2365.8279.4241.6237.3283.3255.2222.4246.3199.8190.1172.2228.6154.6212.3271.9276.0254.1294.3243.1216.8238.6210.8230.5250.8385.0403.2331.2378.1353.6579.4393.3393.7360.1337.6593.2423.2397.9511.9436.2492.4658.5861.7549.0370.1367.3359.7387.6389.3317.1346.6613.9343.2313.6311.3445.2292.5377.3470.6333.5346.2347.4378.2317.4326.3279.2353.2386.7573.4596.7549.0613.7612.338.146.841.756.548.246.446.236.637.943.836.233.0--42.141.449.946.927.551.354.850.837.146.544.347.936.934.345.647.036.455.449.054.344.549.647.734.144.8--------–261725213181372622511762662792142216912528855236125613216810325727614512226517902816775108277156--------–Women intheparliament(% oftotal) GEMGEMRank(% oftotal)FemalepopulationProvinceDistrictGenderEmpowerementMeasure (GEM),byDistrict,19998(Thousand Rp)FemaleMaleAverage nonagriculturalwage(% oftotal)Femalesin seniorofficial,managerial,and technical staffpositions(% oftotal)Females in thelabourforceINDONESIAHUMAN DEVELOPMENT REPORT<strong>2001</strong>98
32.WestJava33.Central Java01.Pandeglang02.Lebak03.Bogor04.Sukabumi05.Cianjur06.Bandung07.Garut08.Tasikmalaya09.Ciamis10.Kuningan11.Cirebon12.Majalengka13.Sumedang14.Indramayu15.Subang16.Purwakarta17.Karawang18.Bekasi19.Tangerang20.Serang71.Bogor72.Sukabumi73.Bandung74.Cirebon75.Tangerang76.Bekasi01.Cilacap02.Banyumas03.Purbalingga04.Banjarnegara05.Kebumen06.Purworejo07.Wonosobo08.Magelang09.Boyolali10.Klaten11.Sukoharjo12.Wonogiri13.Karanganyar14.Sragen15.Grobogan16.Blora17.Rembang18.Pati19.Kudus20.Jepara21.Demak22.Semarang23.Temanggung(continued)7.86.70.06.711.16.711.16.76.76.70.04.48.96.715.62.26.72.24.46.72.26.78.96.78.90.04.415.611.18.98.94.46.74.48.92.22.28.98.98.99.16.74.42.24.46.711.12.20.06.72.236.044.735.631.333.331.651.239.636.147.644.939.234.159.040.035.637.954.431.024.425.422.233.050.939.347.131.850.442.945.046.450.045.545.260.850.933.451.535.941.246.542.936.851.641.257.755.730.338.049.463.832.440.833.924.630.631.034.130.835.539.337.634.433.636.533.034.333.834.927.118.630.732.428.634.835.535.932.827.237.137.938.337.940.040.236.944.645.846.042.640.445.642.439.739.940.941.545.539.640.743.740.049.650.448.047.150.349.349.648.750.050.749.850.849.551.450.549.150.248.350.647.649.849.349.351.650.350.150.448.649.949.849.350.450.049.248.651.350.851.651.250.751.551.250.250.350.351.650.849.948.151.150.5284.0186.7238.8287.6413.5163.9193.1254.9207.7157.7282.8176.7164.4176.0276.0136.9207.1252.8262.0265.3289.1223.4433.7226.7285.4216.0330.7310.2155.9182.9101.7206.6152.9178.6180.8202.8197.0191.1214.0217.9150.7169.1214.6195.0199.8199.2158.9161.5182.8185.2216.5384.4294.7338.5328.7529.7298.3280.3348.9278.0293.5292.3278.8270.9340.3330.0287.7247.5340.1348.2379.9431.6339.5473.5354.0389.3387.8478.9418.9302.3287.3266.3235.5277.2288.2242.9300.6262.2273.4294.7297.1270.0274.0303.9281.9353.5332.3273.3329.3280.8311.3211.947.751.238.942.749.338.453.647.147.947.447.743.245.743.858.635.550.146.236.728.932.536.848.947.251.938.240.654.950.252.444.251.649.549.553.649.147.158.054.454.954.750.948.046.746.849.957.736.943.652.649.41492412038324634119102111105193143177427066138260285281259921154924722921644617351797832861206272225601011281277192581824282Women intheparliament(% oftotal) GEMGEMRank(% oftotal)FemalepopulationProvinceDistrictGenderEmpowerementMeasure (GEM),byDistrict,19998(Thousand Rp)FemaleMaleAverage nonagriculturalwage(% oftotal)Femalesin seniorofficial,managerial,and technical staffpositions(% oftotal)Females in thelabourforceHUMAN DEVELOPMENTINDICATORSAND INDICES 99
24.Kendal25.Batang26.Pekalongan27.Pemalang28.Tegal29.Brebes71.Magelang72.Surakarta73.Salatiga74.Semarang75.Pekalongan76.Tegal01.Kulon Progo02.Bantul03.GunungKidul04.Sleman71.Yogyakarta01.Pacitan02.Ponorogo03.Trenggalek04.Tulungagung05.Blitar06.Kediri07.Malang08.Lumajang09.Jember10.Banyuwangi11.Bondowoso12.Situbondo13.Probolinggo14.Pasuruan15.Sidoarjo16.Mojokerto17.Jombang18.Nganjuk19.Madiun20.Magetan21.Ngawi22.Bojonegoro23.Tuban24.Lamongan25.Gresik26.Bangkalan27.Sampang28.Pamekasan29.Sumenep71.Kediri72.Blitar73.Malang34.Yogyakarta35.East Java(continued)6.74.411.10.04.48.912.03.34.016.76.72.27.56.76.76.72.56.76.74.46.74.42.22.26.76.76.74.40.00.04.44.44.46.72.22.20.06.76.76.70.04.44.40.04.54.46.74.08.97.811.142.441.044.648.350.641.749.540.044.736.654.750.054.346.076.437.237.331.256.155.245.558.244.646.636.454.434.230.955.336.749.950.933.938.850.446.548.435.728.740.249.556.342.847.636.452.254.653.747.546.745.939.238.739.138.037.540.442.445.045.743.638.039.842.545.249.843.646.045.042.243.541.136.839.036.935.437.138.738.938.637.339.037.738.737.539.039.244.437.131.138.938.836.142.845.045.346.642.038.941.345.639.150.251.550.250.350.050.752.150.852.051.550.449.849.549.649.849.851.250.851.650.451.950.749.949.851.252.051.051.351.350.150.251.451.150.851.351.450.450.848.250.250.748.752.152.350.952.751.350.051.049.950.8213.3119.4130.4171.7187.0156.4215.1245.4319.2225.2201.1170.6230.6174.4283.9264.6219.5207.0184.6191.1161.3198.1163.0147.5141.0157.6207.6135.6169.4118.4164.4209.5177.6199.1216.2193.3195.6153.8184.5151.7201.6194.3246.8227.3111.8163.9221.2188.9212.9232.3197.1267.2216.3226.9240.5350.9296.2310.5365.6373.6344.6308.7331.1266.5262.2328.8329.5332.1262.3261.4218.4268.7253.0252.4217.6231.6337.4267.4312.2248.3274.1253.6384.0272.9283.3339.8256.5288.8243.8292.5334.6303.5349.3342.7308.0251.4314.7337.2309.1309.1308.1314.853.643.152.843.144.349.659.449.954.861.149.743.557.855.747.155.848.651.652.453.949.848.745.044.843.641.949.535.642.332.247.744.143.849.044.347.546.645.839.643.542.444.248.845.442.448.152.547.255.758.854.43319639198169763702417418781512114965245307394154158183219802682102821071741788817110912914123818520917293148207100441161614Women intheparliament(% oftotal) GEMGEMRank(% oftotal)FemalepopulationProvinceDistrictGenderEmpowerementMeasure (GEM),byDistrict,19998(Thousand Rp)FemaleMaleAverage nonagriculturalwage(% oftotal)Femalesin seniorofficial,managerial,and technical staffpositions(% oftotal)Females in thelabourforceINDONESIAHUMAN DEVELOPMENT REPORT<strong>2001</strong>100
74.Probolinggo75.Pasuruan76.Mojokerto77.Madiun78.Surabaya01.Jembrana02.Tabanan03.Badung04.Gianyar05.Klungkung06.Bangli07.Karangasem08.Buleleng71.Denpasar01.WestLombok02.Central Lombok03.EastLombok04.Sumbawa05.Dompu06.Bima71.Mataram01.WestSumba02.EastSumba03.Kupang04.Southern Central-Timor05.Northern Central-Timor06.Belu07.Alor08.FloresTimur09.Sikka10.Ende11.Ngada12.Manggarai71.Kupang01.Sambas02.Pontianak03.Sanggau04.Ketapang05.Sintang06.Kapuas Hulu71.Pontianak51.Bali52.WestNusaTenggara53.East NusaTenggara61.WestKalimantan(continued)3.33.34.00.06.70.00.05.75.78.00.02.92.20.07.57.57.35.30.00.00.00.00.05.05.70.00.00.00.06.73.30.00.010.00.00.00.00.00.00.00.06.16.12.16.344.535.758.752.143.541.949.845.517.343.526.034.031.339.233.223.941.533.739.343.037.737.533.930.630.543.236.929.035.245.039.942.626.238.840.751.530.251.333.431.241.235.537.235.743.234.636.337.943.037.843.845.839.145.046.847.648.547.444.042.047.341.741.842.342.739.042.940.136.632.740.134.342.650.247.954.948.448.730.644.337.839.336.742.142.933.245.442.943.039.850.652.650.151.450.249.050.948.349.051.848.949.651.450.251.852.754.149.249.750.750.549.748.949.349.449.649.751.354.053.253.652.250.748.348.849.148.948.849.149.449.650.051.950.749.0268.9179.3208.7222.8252.1187.3221.8274.1178.9198.8213.0200.2148.2278.2121.1126.3149.5281.3263.7232.9214.3261.7193.4293.7189.2186.0190.9184.4176.7183.7330.1297.1222.1282.3237.6301.5326.6295.2224.1219.4302.0229.1177.7233.6288.2324.7276.3331.1397.6411.5314.0350.5433.3342.8317.5323.9324.0334.1498.4240.9254.9313.7425.8320.9345.2342.5364.8278.2303.6292.0327.2231.5241.3237.7273.9338.5351.9301.2348.0356.2382.3362.3333.7418.8434.7442.7387.3308.6304.3395.147.240.345.442.549.144.546.951.337.255.141.347.839.442.943.140.543.347.744.843.439.634.440.747.134.835.335.633.540.843.846.547.441.152.645.044.742.045.638.136.538.750.546.246.452.2117231150205851661235625519222104239<strong>2001</strong>97230192106159188236275226118273271267278225175130112223411531622181442482632421020187Women intheparliament(% oftotal) GEMGEMRank(% oftotal)FemalepopulationProvinceDistrictGenderEmpowerementMeasure (GEM),byDistrict,19998(Thousand Rp)FemaleMaleAverage nonagriculturalwage(% oftotal)Femalesin seniorofficial,managerial,and technical staffpositions(% oftotal)Females in thelabourforceHUMAN DEVELOPMENTINDICATORSAND INDICES 101
62.Central Kalimantan63.South Kalimantan64.East Kalimantan71.North Sulawesi72.Central Sulawesi73.South Sulawesi01.WestKotawaringin02.EastKotawaringin03.Kapuas04.South Barito05.North Barito71.PalangkaRaya01.Tanah Laut02.Kota Baru03.Banjar04.Barito Kuala05.Tapin06.South Hulu Sungai07.Central Hulu Sungai08.North Hulu Sungai09.Tabalong71.Banjarmasin01.Pasir02.Kutai03.Berau04.Bulongan71.Balikpapan72.Samarinda01.Gorontalo02.Bolaang Mongondow03.Minahasa04.Sangihe Talaud71.Gorontalo72.Manado73.Bitung01.Luwuk Banggai02.Poso03.Donggala04.BualToli-Toli71.Kodya Palu01.Selayar02.Bulukumba03.Bantaeng04.Jeneponto(continued)2.58.712.57.57.53.80.03.32.24.00.04.03.82.55.93.30.04.210.03.30.02.23.32.20.03.313.36.77.07.517.87.44.27.58.00.05.06.86.73.34.05.74.02.946.347.139.254.947.447.730.942.751.358.843.349.552.933.357.450.047.957.743.046.647.244.039.537.343.925.644.240.960.042.762.660.560.349.332.050.044.852.530.548.653.238.746.546.643.541.131.028.533.731.429.128.539.939.636.933.538.238.141.543.642.544.045.047.344.733.025.531.532.732.328.534.026.324.528.533.032.133.523.437.637.631.525.033.634.430.333.736.248.850.549.149.649.451.349.448.148.949.649.448.448.549.650.350.552.051.951.251.851.549.946.749.748.547.150.749.350.648.348.449.551.950.947.748.949.549.548.950.152.852.152.252.1301.1281.7300.6303.9250.9321.1264.7302.6208.6299.2430.3383.3246.3301.6259.9312.0251.8275.1344.1221.2257.7300.7242.9382.8298.9214.0315.1265.8309.8285.4276.1342.0278.8340.9200.3214.9241.8257.1198.2284.6241.1353.7299.9312.6447.8395.6505.1439.7342.4401.9493.7453.4394.9382.7452.8471.6361.7426.0379.2378.8351.0326.9382.6289.6387.9430.9420.4578.6475.9387.4555.1424.1316.1383.3359.9345.8308.6621.1369.8292.0368.0316.4272.5398.2315.6404.7360.7396.143.355.149.345.150.043.927.539.743.249.545.749.048.443.251.352.044.752.759.751.945.242.635.538.637.834.547.346.546.543.556.652.846.344.835.243.547.349.137.444.644.844.545.945.524312221123287235195811429198194574816140250151204269244252274113133131186123813615727218411487254163160165140147Women intheparliament(% oftotal) GEMGEMRank(% oftotal)FemalepopulationProvinceDistrictGenderEmpowerementMeasure (GEM),byDistrict,19998(Thousand Rp)FemaleMaleAverage nonagriculturalwage(% oftotal)Femalesin seniorofficial,managerial,and technical staffpositions(% oftotal)Females in thelabourforceINDONESIAHUMAN DEVELOPMENT REPORT<strong>2001</strong>102
8 GenderEmpowerementMeasure (GEM),byDistrict,1999(continued)ProvinceDistrictFemalesin seniorofficial,managerial,and technical staffAverage nonagriculturalwageWomen intheFemales in the Femaleparliament positions labourforce population(Thousand Rp)(% oftotal) (% oftotal) (% oftotal) (% oftotal)GEMFemaleMaleGEMRank05.Takalar06.Gowa07.Sinjai08.Maros09.Pangkep10.Barru11.Bone12.Soppeng13.Wajo14.Sidenreng Rappang15.Pinrang16.Enrekang17.Luwu18.TanaToraja19.Polewali Mamasa20.Majene21.Mamuju71.UjungPandang72.Pare Pare6.75.33.33.36.78.08.93.312.50.02.98.02.95.010.04.26.77.08.051.856.854.541.954.461.855.460.050.845.948.150.048.738.451.949.040.743.049.031.829.226.929.023.923.828.628.130.427.128.835.431.535.938.532.130.033.130.651.149.352.151.751.952.652.555.053.252.051.550.749.648.052.551.648.351.251.4301.1263.6342.8229.4307.0288.4357.1304.6185.1215.5260.5373.5412.3309.9232.1338.5310.6348.4366.7312.0265.0358.1325.6421.4323.2367.7341.6339.7303.4382.7379.1593.1341.2303.9412.6339.3460.1380.151.148.542.238.139.142.149.539.945.133.038.155.342.251.354.645.450.148.251.558972112492402177723415228025018213542614965995374.South-east Sulawesi2.540.236.550.1300.9364.146.02101.Buton02.Muna03.Kendari04.Kolaka71.Kendari7.510.04.46.716.047.933.230.640.644.740.543.136.926.031.851.050.149.249.650.8337.2262.8244.5347.2292.6390.5361.0279.9382.1401.954.953.246.445.056.320361341551381.Maluku7.555.335.050.0333.0394.452.7501.South-eastMaluku02.Central Maluku03.North Maluku04.Central Halmahera71.Ambon3.12.28.90.08.663.062.350.637.552.936.134.934.133.038.050.550.249.548.850.8243.7311.3343.2304.8381.1388.6317.0475.3348.1400.141.646.852.142.157.4220126472151082.IrianJaya2.734.241.448.4490.1638.247.71401.Merauke02.Jaya Wijaya03.Jaya Pura04.Paniai05.Fak Fak06.Sorong07.Manokwari08.Yapen Waropen09.Biak Numfor71.Jaya Pura5.72.512.07.40.03.38.00.04.03.347.920.136.747.729.125.624.325.829.842.041.749.830.647.427.735.838.134.734.126.648.448.949.047.547.548.647.048.949.348.6513.5478.2462.7581.1531.3471.0287.3447.3411.0539.1748.4512.6572.1604.5932.6689.6523.8546.4513.2616.253.742.153.350.028.239.643.836.543.643.6312163568286237179264181180Note:The number before each districtisthe official area code.Districtrefers to both regencyand CitySource: BPS special tabulationHUMAN DEVELOPMENTINDICATORSAND INDICES 103
ProvinceDistrict11.Aceh12.North Sumatera13.WestSumatera01.SouthAceh02.South-eastAceh03.EastAceh04.CentralAceh05.WeastAceh06.Aceh Besar07.Pidie08.NorthAceh71.BandaAceh72.Sabang01.Nias02.SouthTapanuli03.Central Tapanuli04.NorthTapanuli05.Labuhan Batu06.Asahan07.Simalungun08.Dairi09.Karo10.DeliSerdang11.Langkat71.Sibolga72.Tanjung Balai73.Pematang Siantar74.TebingTinggi75.Medan76.Binjai01.South Pesisir02.Solok03.Sawah Lunto/Sijunjun04.Tanah Datar05.Padang Pariaman06.Agam07.Limapuluh Koto08.Pasaman71.Padang72.Solok73.Sawah Lunto74.Padang Panjang75.BukitTinggi76.Payakumbuh<strong>Human</strong>Poverty Index (HPI)byDistrict,19989People notexpectedto surviveage 40 a)(%) (%) (%) (%)Adultiliteracy rate(%)Populationwithoutaccess tosafe water12.713.516.218.812.413.214.212.010.412.811.411.711.314.617.916.216.616.113.813.316.28.515.314.111.513.89.110.010.410.518.325.322.413.418.013.417.424.410.914.89.210.49.614.06.94.25.38.79.36.12.88.85.612.45.52.35.214.30.76.23.83.56.36.43.24.56.02.81.53.01.72.21.22.76.65.48.36.86.55.85.36.12.82.42.62.61.32.961.547.946.473.764.647.654.575.561.378.861.023.535.948.366.161.663.763.942.338.250.945.955.645.310.720.98.069.228.263.353.934.650.944.461.744.147.340.255.011.429.216.121.735.637.620.921.773.945.740.237.156.021.321.745.90.025.047.746.920.960.841.112.014.419.818.113.923.50.02.110.60.00.00.046.421.735.612.633.821.733.737.810.30.00.00.00.00.035.635.334.030.935.637.721.053.149.541.733.624.926.359.030.233.032.323.627.131.750.729.241.437.334.726.729.323.236.336.432.434.932.538.241.039.138.132.528.128.528.018.621.031.8HPIHPI Rank31.424.524.441.734.029.326.542.830.733.332.612.520.636.333.727.436.630.219.720.228.721.726.325.011.813.411.721.615.523.331.424.629.122.632.224.728.327.821.912.313.79.610.816.8231198421001416814757281229224412819872402361092091441642842762852122671907117210219861171114120206282275292288257Populationwithoutaccess tohealthfacilitiesUndernourishedchildrenunderage fiveINDONESIAHUMAN DEVELOPMENT REPORT<strong>2001</strong>104
9 <strong>Human</strong>Poverty Index (HPI)byDistrict,1998ProvinceDistrictPeople notexpectedto surviveage 40 a)(%)Populationwithoutaccess tohealthUndernourishedchildrenunderAdultiliteracy rate(%)Populationwithoutaccess tosafe water(%)facilities(%)age five(%)HPIHPI Rank14.Riau12.44.471.839.227.932.32401.Indragiri Hulu02.Indragiri Ilir03.Kepulauan Riau04.Kampar05.Bengkalis71.Pekan Baru72.Batam17.412.011.615.811.19.010.27.23.29.14.44.50.53.747.797.559.267.782.276.044.558.159.311.849.048.96.225.042.932.322.829.221.032.925.034.943.822.234.135.326.722.1343202412713720415.Jambi14.26.357.321.532.926.31401.Kerinci02.Bungo Tebo03.Sarolangun Bangko04.Batanghari05.Tanjung Jabung71.Jambi11.719.614.915.712.411.55.17.67.24.87.94.737.060.865.154.394.428.321.230.836.515.822.22.022.839.239.434.533.521.819.331.233.024.934.913.224475491673427716.South Sumatera16.26.659.728.926.427.31701.Ogan Komering Ulu02.Ogan Komering Hilir03.MuaraEnim(Liot)04.Lahat05.MusiRawas06.MusiBanyuasin07.Bangka08.Balitung71.Palembang72.Pangkal Pinang12.421.619.120.024.014.214.613.812.411.68.56.64.63.88.86.712.36.54.16.654.165.660.883.569.779.561.568.022.857.547.015.746.936.141.723.146.723.26.30.023.429.323.233.328.626.425.020.433.128.629.127.231.136.033.830.231.426.315.420.4102130792343877114427023417.Bengkulu16.67.459.224.830.027.11601.South Bengkulu02.Rejang Lebong03.North Bengkulu71.Bengkulu19.022.216.010.29.67.59.61.780.756.147.761.416.824.950.05.234.028.128.131.431.327.129.722.9731339719518.Lampung15.48.254.434.529.127.91801.South Lampung02.Central Lampung03.North Lampung04.WestLampung71.Bandar Lampung16.814.016.816.812.68.310.87.87.63.758.748.952.768.056.626.924.561.359.62.428.626.532.933.927.227.223.934.437.720.5130184381423331.Jakarta7.92.240.22.023.715.5171.South Jakarta72.EastJakarta73.Central Jakarta74.WestJakarta75.North Jakarta7.77.49.07.57.92.91.62.32.32.35.756.516.426.672.71.34.10.32.20.825.024.817.221.426.28.319.99.011.923.1294239293283191HUMAN DEVELOPMENTINDICATORSAND INDICES 105
32.WestJava33.Central Java01.Pandeglang02.Lebak03.Bogor04.Sukabumi05.Cianjur06.Bandung07.Garut08.Tasikmalaya09.Ciamis10.Kuningan11.Cirebon12.Majalengka13.Sumedang14.Indramayu15.Subang16.Purwakarta17.Karawang18.Bekasi19.Tangerang20.Serang71.Bogor72.Sukabumi73.Bandung74.Cirebon75.Tangerang76.Bekasi01.Cilacap02.Banyumas03.Purbalingga04.Banjarnegara05.Kebumen06.Purworejo07.Wonosobo08.Magelang09.Boyolali10.Klaten11.Sukoharjo12.Wonogiri13.Karanganyar14.Sragen15.Grobogan16.Blora17.Rembang18.Pati19.Kudus20.Jepara21.Demak22.Semarang23.Temanggung(continued)(%) (%) (%)Adultiliteracy rate(%)Populationwithoutaccess tosafe water18.211.723.322.516.721.719.414.326.916.118.917.220.620.614.520.116.919.721.714.319.226.512.615.811.813.513.614.313.411.913.013.013.412.612.612.110.210.510.57.97.98.312.49.412.17.312.49.811.08.58.47.815.26.89.26.34.04.45.33.23.86.18.313.411.14.433.313.85.515.212.411.37.82.62.41.75.45.72.915.88.813.814.112.813.713.513.818.618.916.023.621.728.414.425.915.220.011.216.910.810.69.062.147.852.660.659.056.662.270.864.980.060.765.356.953.559.159.770.753.170.151.277.363.968.947.233.817.867.874.958.851.068.963.756.357.833.828.937.154.764.841.358.340.935.024.820.953.649.844.652.341.650.722.417.144.551.315.434.655.914.321.210.413.622.423.412.634.330.429.322.226.924.330.729.111.30.04.40.020.00.024.317.617.117.136.512.346.627.320.017.117.125.917.151.325.930.114.929.614.431.414.428.517.127.230.539.623.929.532.531.821.225.930.527.732.333.937.319.925.734.828.932.511.620.335.531.410.922.927.318.511.633.321.030.021.632.724.133.928.019.125.318.617.728.830.720.334.050.635.443.040.028.532.733.1HPIHPI Rank26.923.233.032.724.929.935.325.128.828.524.928.528.125.726.732.532.025.531.521.430.731.926.115.515.012.625.120.827.821.327.524.629.622.827.120.720.024.124.323.026.031.320.224.521.328.625.427.722.624.123.61574955167942716210711216711211715513759641567021481661472672722791622241202161271729819713322823818218119314973236176216111158124198182187Populationwithoutaccess tohealthfacilitiesUndernourishedchildrenunderage fiveProvinceDistrict<strong>Human</strong>Poverty Index (HPI)byDistrict,19989People notexpectedto surviveage 40 a)(%)INDONESIAHUMAN DEVELOPMENT REPORT<strong>2001</strong>106
24.Kendal25.Batang26.Pekalongan27.Pemalang28.Tegal29.Brebes71.Magelang72.Surakarta73.Salatiga74.Semarang75.Pekalongan76.Tegal01.Kulon Progo02.Bantul03.GunungKidul04.Sleman71.Yogyakarta01.Pacitan02.Ponorogo03.Trenggalek04.Tulungagung05.Blitar06.Kediri07.Malang08.Lumajang09.Jember10.Banyuwangi11.Bondowoso12.Situbondo13.Probolinggo14.Pasuruan15.Sidoarjo16.Mojokerto17.Jombang18.Nganjuk19.Madiun20.Magetan21.Ngawi22.Bojonegoro23.Tuban24.Lamongan25.Gresik26.Bangkalan27.Sampang28.Pamekasan29.Sumenep71.Kediri72.Blitar73.Malang34.Yogyakarta35.East Java(continued)(%) (%) (%)Adultiliteracy rate(%)Populationwithoutaccess tosafe water17.511.914.517.816.720.110.68.19.99.011.914.47.610.09.27.36.79.614.310.19.211.312.314.817.226.318.328.224.028.924.012.212.814.213.813.99.813.716.115.614.613.224.834.124.424.811.59.815.08.216.215.714.215.817.716.517.06.67.14.36.410.213.517.217.417.114.34.919.224.312.815.017.614.415.822.827.518.136.235.631.717.04.612.511.614.920.318.520.621.426.219.78.737.045.127.333.27.17.75.614.518.748.670.771.358.370.944.018.139.016.815.362.521.439.953.742.946.460.547.835.348.954.752.252.339.057.244.560.346.760.751.565.726.640.949.442.844.626.143.438.438.544.246.743.348.343.844.664.670.242.148.943.017.117.113.417.110.323.80.00.00.06.60.00.023.79.69.58.60.017.114.210.414.117.117.134.236.427.117.134.518.317.129.512.111.117.117.117.117.131.728.123.912.910.544.722.829.536.40.00.00.08.617.134.321.933.634.439.641.519.214.021.029.329.731.221.524.07.518.111.319.812.529.917.526.617.123.434.933.134.440.033.754.329.833.022.828.427.922.613.439.227.533.339.529.448.343.462.932.521.120.025.917.330.7HPIHPI Rank24.926.128.327.229.227.410.412.910.112.622.015.321.121.816.618.116.821.720.621.421.023.621.323.831.730.127.735.633.434.631.217.318.722.921.822.316.728.124.626.224.520.837.639.635.032.820.321.217.218.523.41671471141301011282892782912792052712212072612492572092292142221872161856890124244637752532461952072012591171721461762241512325423522025428Populationwithoutaccess tohealthfacilitiesUndernourishedchildrenunderage fiveProvinceDistrict<strong>Human</strong>Poverty Index (HPI)byDistrict,19989People notexpectedto surviveage 40 a)(%)HUMAN DEVELOPMENTINDICATORSAND INDICES 107
74.Probolinggo75.Pasuruan76.Mojokerto77.Madiun78.Surabaya01.Jembrana02.Tabanan03.Badung04.Gianyar05.Klungkung06.Bangli07.Karangasem08.Buleleng71.Denpasar01.WestLombok02.Central Lombok03.EastLombok04.Sumbawa05.Dompu06.Bima71.Mataram01.WestSumba02.EastSumba03.Kupang04.Southern Central-Timor05.Northern Central-Timor06.Belu07.Alor08.FloresTimur09.Sikka10.Ende11.Ngada12.Manggarai71.Kupang01.Sambas02.Pontianak03.Sanggau04.Ketapang05.Sintang06.Kapuas Hulu71.Pontianak51.Bali52.WestNusaTenggara53.East NusaTenggara61.WestKalimantan(continued)(%) (%) (%)Adultiliteracy rate(%)Populationwithoutaccess tosafe water12.918.69.310.611.711.26.18.78.413.58.714.615.37.234.535.735.734.531.228.820.923.227.819.816.616.819.720.815.315.821.117.518.719.833.717.714.517.115.317.816.711.731.519.518.613.812.36.58.36.215.314.612.522.421.421.533.916.86.236.335.631.415.318.018.212.231.022.824.532.520.526.610.517.615.411.27.717.05.418.016.618.216.020.417.211.117.327.219.616.841.026.655.949.34.543.925.963.023.827.128.930.423.743.164.752.279.558.942.951.961.648.430.847.544.730.437.940.854.755.454.614.439.724.870.287.478.669.075.385.885.434.262.541.978.40.00.00.00.012.214.914.917.036.714.925.529.214.96.224.917.512.833.917.537.70.026.640.535.949.162.523.338.229.953.541.218.665.30.533.641.369.548.057.260.70.014.917.538.243.332.130.123.215.025.824.319.320.613.718.813.424.725.121.244.135.338.635.046.245.634.844.131.949.541.151.855.529.341.825.738.232.831.929.339.348.151.238.241.239.930.521.039.738.742.0HPIHPI Rank18.617.118.615.711.620.615.623.820.819.019.527.818.116.539.035.437.634.430.034.324.532.729.133.235.134.730.526.730.332.032.217.632.916.737.141.546.536.641.043.727.718.733.729.538.72472552472652862292661852242452411202492621326153892401765510248313683137846461251532591892191041243252126Populationwithoutaccess tohealthfacilitiesUndernourishedchildrenunderage fiveProvinceDistrict<strong>Human</strong>Poverty Index (HPI)byDistrict,19989People notexpectedto surviveage 40 a)(%)INDONESIAHUMAN DEVELOPMENT REPORT<strong>2001</strong>108
62.Central Kalimantan63.South Kalimantan64.East Kalimantan71.North Sulawesi72.Central Sulawesi73.South Sulawesi01.WestKotawaringin02.EastKotawaringin03.Kapuas04.South Barito05.North Barito71.PalangkaRaya01.Tanah Laut02.Kota Baru03.Banjar04.Barito Kuala05.Tapin06.South Hulu Sungai07.Central Hulu Sungai08.North Hulu Sungai09.Tabalong71.Banjarmasin01.Pasir02.Kutai03.Berau04.Bulongan71.Balikpapan72.Samarinda01.Gorontalo02.Bolaang Mongondow03.Minahasa04.Sangihe Talaud71.Gorontalo72.Manado73.Bitung01.Luwuk Banggai02.Poso03.Donggala04.BualToli-Toli71.Kodya Palu01.Selayar02.Bulukumba03.Bantaeng04.Jeneponto05.Takalar(continued)(%) (%) (%)Adultiliteracy rate(%)Populationwithoutaccess tosafe water10.424.510.712.021.211.710.212.29.915.18.96.715.023.322.031.517.624.722.828.324.417.88.615.312.77.89.211.316.99.68.88.018.08.412.719.724.025.422.514.715.011.58.319.014.15.27.26.52.87.416.86.96.65.03.34.71.914.28.84.59.26.98.09.06.88.33.813.26.49.78.34.53.95.73.81.04.61.10.32.28.63.810.68.01.915.820.429.531.223.268.246.735.844.551.749.140.680.571.455.573.171.353.034.658.990.448.864.557.749.643.74.855.743.452.062.28.018.965.039.133.945.846.138.435.536.045.857.754.370.173.148.542.366.658.826.216.219.626.130.226.026.222.531.642.760.80.529.016.223.559.216.216.216.228.15.30.024.731.421.518.90.512.039.316.720.742.615.323.90.025.043.634.835.05.720.542.733.922.133.930.529.031.925.834.933.922.230.926.851.723.634.228.219.327.330.129.029.029.029.029.038.623.334.832.328.131.734.632.527.420.022.730.121.529.930.932.738.933.530.937.533.947.148.245.2HPIHPI Rank29.024.420.622.728.426.320.931.230.135.036.524.626.520.627.143.523.027.826.028.322.214.324.526.025.025.410.315.832.219.517.525.822.519.516.123.130.032.429.925.231.230.231.735.333.52010451913223759032211721412291335193120149114202273176149164158290264612412521542002412631919260941617587682745Populationwithoutaccess tohealthfacilitiesUndernourishedchildrenunderage fiveProvinceDistrict<strong>Human</strong>Poverty Index (HPI)byDistrict,19989People notexpectedto surviveage 40 a)(%)HUMAN DEVELOPMENTINDICATORSAND INDICES 109
9 <strong>Human</strong>Poverty Index (HPI)byDistrict,1998(continued)ProvinceDistrictPeople notexpectedto surviveage 40 a)(%)Populationwithoutaccess tohealthUndernourishedchildrenunderAdultiliteracy rate(%)Populationwithoutaccess tosafe water(%)facilities(%)age five(%)HPIHPI Rank06.Gowa07.Sinjai08.Maros09.Pangkep10.Barru11.Bone12.Soppeng13.Wajo14.Sidenreng Rappang15.Pinrang16.Enrekang17.Luwu18.TanaToraja19.Polewali Mamasa20.Majene21.Mamuju71.UjungPandang72.Pare Pare9.410.011.213.414.113.38.513.310.011.36.97.55.920.822.013.77.57.023.121.523.217.416.219.021.823.917.217.310.38.026.719.110.515.94.85.863.941.564.750.161.850.356.267.260.864.651.844.922.352.057.168.118.151.039.727.328.245.037.130.850.022.420.619.939.738.433.133.933.966.41.90.044.921.534.044.126.624.531.629.131.543.028.331.738.129.033.438.227.241.335.523.431.033.029.926.033.029.627.130.327.926.725.528.930.340.411.421.525189804994149499813384119137156105841128721374.South-east Sulawesi17.012.943.621.327.122.9601.Buton02.Muna03.Kendari04.Kolaka71.Kendari15.118.816.717.516.714.816.813.112.72.943.241.247.845.631.315.627.148.914.50.025.535.624.425.524.421.326.028.921.715.521614910520926781.Maluku13.14.252.123.829.324.71201.South-eastMaluku02.Central Maluku03.North Maluku04.Central Halmahera71.Ambon9.119.115.715.97.63.73.26.49.80.162.458.254.742.229.625.516.847.420.30.017.329.333.621.743.024.525.431.820.817.01761586722425682.IrianJaya17.828.854.536.028.331.32201.Merauke02.Jaya Wijaya03.Jaya Pura04.Paniai05.Fak Fak06.Sorong07.Manokwari08.Yapen Waropen09.Biak Numfor71.Jaya Pura30.918.116.015.212.118.615.121.018.614.220.964.09.750.25.111.825.914.55.43.265.844.244.675.459.155.255.369.450.025.541.244.831.235.535.732.271.336.031.20.028.326.328.329.228.332.328.330.028.328.335.247.725.042.628.728.837.532.626.414.230116471091071757143274Note:a) Extrapolation based on Population Census(PC)1971, PC 1980,PC 1990,1995SurveyBetween Census and 1996 Socio-economicsurvey.The number before each districtisthe official area code.Districtrefers to both regencyand City.Source: BPS special tabulation110INDONESIAHUMAN DEVELOPMENT REPORT<strong>2001</strong>
ProvinceDistrict11.Aceh12.North Sumatera13.WestSumatera01.SouthAceh02.South-eastAceh03.EastAceh04.CentralAceh05.WeastAceh06.Aceh Besar07.Pidie08.NorthAceh71.BandaAceh72.Sabang01.Nias02.SouthTapanuli03.Central Tapanuli04.NorthTapanuli05.Labuhan Batu06.Asahan07.Simalungun08.Dairi09.Karo10.DeliSerdang11.Langkat71.Sibolga72.Tanjung Balai73.Pematang Siantar74.TebingTinggi75.Medan76.Binjai01.South Pesisir02.Solok03.Sawah Lunto/Sijunjun04.Tanah Datar05.Padang Pariaman06.Agam07.Limapuluh Koto08.Pasaman71.Padang72.Solok73.Sawah Lunto74.Padang Panjang75.BukitTinggi76.PayakumbuhHealth ConditionbyDistrict,199910Infantmortalityrate(%)Population withhealth problem(%)Morbidityrate394148543840433737393536354452484948424148264643364228313233537070415241516734442832304222.015.832.021.819.619.417.515.818.021.428.526.131.423.314.319.617.918.012.811.320.25.521.015.616.111.711.610.812.613.020.548.531.932.335.332.434.523.324.748.449.844.838.943.111.99.119.413.913.412.913.57.28.09.913.115.620.210.67.712.811.011.88.68.57.04.211.08.711.07.76.66.77.28.415.129.323.219.222.517.823.514.112.329.633.420.121.922.96.85.96.98.45.78.17.17.47.16.45.65.86.73.66.57.75.84.66.98.55.27.54.85.48.56.17.75.87.16.06.56.67.37.77.67.57.07.86.15.16.35.75.25.838.448.434.539.750.042.434.438.826.430.240.038.439.444.149.651.246.062.241.849.356.620.243.758.143.427.953.159.348.440.329.641.539.525.735.030.235.634.532.829.528.344.935.036.8(%)Birth deliveryassisted bymedicalpersonnel75.483.877.653.863.291.262.441.8100.085.272.097.4100.048.142.490.692.967.781.892.081.995.988.985.995.096.5100.097.997.5100.084.856.578.075.677.486.591.750.988.7100.088.4100.098.096.2(days)Average durationofillness(%)Populationself-medicatingHUMAN DEVELOPMENTINDICATORSAND INDICES 111
14.Riau15.Jambi16.South Sumatera17.Bengkulu18.Lampung31.Jakarta01.Indragiri Hulu02.Indragiri Ilir03.Kepulauan Riau04.Kampar05.Bengkalis71.Pekan Baru72.Batam01.Kerinci02.Bungo Tebo03.Sarolangun Bangko04.Batanghari05.Tanjung Jabung71.Jambi01.Ogan Komering Ulu02.Ogan Komering Hilir03.MuaraEnim(Liot)04.Lahat05.MusiRawas06.MusiBanyuasin07.Bangka08.Balitung71.Palembang72.Pangkal Pinang01.South Bengkulu02.Rejang Lebong03.North Bengkulu71.Bengkulu01.South Lampung02.Central Lampung03.North Lampung04.WestLampung71.Bandar Lampung71.South Jakarta72.EastJakarta73.Central Jakarta74.WestJakarta75.North JakartaInfantmortalityrate(%) (%)Population withhealth problem(%)Morbidityrate3843484946245137364734283236564547383638615557664344423836556248325042505039242228232317.317.621.417.825.628.920.58.823.219.922.85.913.019.020.919.515.215.115.514.921.315.820.414.114.919.728.338.122.615.812.918.025.829.029.215.212.935.124.832.536.123.232.210.711.312.111.313.715.613.95.911.212.515.13.86.816.015.711.77.110.67.48.812.810.310.98.69.411.113.419.810.89.68.913.113.616.813.68.46.320.614.916.319.112.717.45.36.15.16.35.34.65.84.84.96.25.14.84.26.86.15.96.85.65.65.55.54.95.56.24.15.36.54.76.05.56.66.76.15.85.15.84.94.64.64.54.64.94.253.141.748.337.145.851.139.849.136.258.364.452.346.444.045.839.032.858.230.943.044.249.143.446.660.439.445.950.956.538.136.138.435.741.747.358.249.139.649.556.652.845.148.9(%)Birth deliveryassisted bymedicalpersonnel68.360.273.871.057.493.671.740.474.432.878.790.897.083.949.439.434.944.893.085.843.873.455.980.168.664.678.296.888.856.671.463.791.457.846.430.697.059.095.193.9100.093.887.9(days)Average durationofillness(continued)ProvinceDistrictHealth ConditionbyDistrict,199910(%)Populationself-medicatingINDONESIAHUMAN DEVELOPMENT REPORT<strong>2001</strong>112
32.WestJava33.Central Java01.Pandeglang02.Lebak03.Bogor04.Sukabumi05.Cianjur06.Bandung07.Garut08.Tasikmalaya09.Ciamis10.Kuningan11.Cirebon12.Majalengka13.Sumedang14.Indramayu15.Subang16.Purwakarta17.Karawang18.Bekasi19.Tangerang20.Serang71.Bogor72.Sukabumi73.Bandung74.Cirebon75.Tangerang76.Bekasi01.Cilacap02.Banyumas03.Purbalingga04.Banjarnegara05.Kebumen06.Purworejo07.Wonosobo08.Magelang09.Boyolali10.Klaten11.Sukoharjo12.Wonogiri13.Karanganyar14.Sragen15.Grobogan16.Blora17.Rembang18.Pati19.Kudus20.Jepara21.Demak22.Semarang23.Temanggung(continued)Infantmortalityrate(%) (%)Population withhealth problem(%)Morbidityrate533665634961564374485551595944575057614355733947364141413740404139393731323324242538293722383034262622.228.615.821.820.927.028.116.826.526.625.422.129.022.825.711.921.538.028.820.517.419.115.926.225.129.022.211.429.330.734.920.331.622.827.826.421.731.125.217.638.025.329.325.724.232.723.330.923.932.130.612.816.010.412.613.713.818.410.216.214.910.016.615.414.915.57.810.920.016.713.09.510.310.013.813.612.69.58.117.214.020.311.716.612.614.816.09.716.412.29.314.914.318.215.115.818.315.221.614.615.715.26.15.66.65.36.15.55.86.16.38.06.86.56.77.47.77.15.95.15.23.95.46.15.55.66.94.95.65.55.95.15.35.66.26.35.75.94.95.86.36.54.95.94.84.85.35.04.26.25.55.15.950.146.143.852.844.453.657.753.453.345.448.531.954.450.939.454.357.767.462.051.649.137.549.549.447.947.236.157.152.555.344.840.151.337.246.743.137.641.838.231.645.236.947.849.428.341.244.538.640.845.056.7(%)Birth deliveryassisted bymedicalpersonnel51.563.215.511.457.618.230.252.022.844.744.173.059.163.664.651.064.318.060.940.066.031.463.658.879.083.294.992.851.064.237.538.061.167.226.751.375.591.597.180.4100.078.057.047.251.155.545.665.144.578.944.4(days)Average durationofillnessProvinceDistrictHealth ConditionbyDistrict,199910(%)Populationself-medicatingHUMAN DEVELOPMENTINDICATORSAND INDICES 113
24.Kendal25.Batang26.Pekalongan27.Pemalang28.Tegal29.Brebes71.Magelang72.Surakarta73.Salatiga74.Semarang75.Pekalongan76.Tegal01.Kulon Progo02.Bantul03.GunungKidul04.Sleman71.Yogyakarta01.Pacitan02.Ponorogo03.Trenggalek04.Tulungagung05.Blitar06.Kediri07.Malang08.Lumajang09.Jember10.Banyuwangi11.Bondowoso12.Situbondo13.Probolinggo14.Pasuruan15.Sidoarjo16.Mojokerto17.Jombang18.Nganjuk19.Madiun20.Magetan21.Ngawi22.Bojonegoro23.Tuban24.Lamongan25.Gresik26.Bangkalan27.Sampang28.Pamekasan29.Sumenep71.Kediri72.Blitar73.Malang34.Yogyakarta35.East Java(continued)Infantmortalityrate(%) (%)Population withhealth problem(%)Morbidityrate(%)Birth deliveryassisted bymedicalpersonnel(days)Average durationofillness51374452495733253128374323322822202943312835384551735377667866383943424230424847444068866768363045254831.426.421.224.634.132.731.732.227.729.633.641.230.033.749.821.833.421.922.423.534.226.227.921.729.821.726.027.533.836.420.823.533.534.035.628.022.220.115.227.624.327.115.821.823.817.827.929.036.633.225.715.314.313.011.021.221.811.615.916.818.020.322.018.717.720.810.413.611.714.016.519.115.216.213.319.112.916.917.417.724.515.214.522.517.920.512.811.613.011.117.916.316.111.816.417.211.316.019.117.915.815.65.86.16.06.25.96.07.55.96.55.15.26.75.64.56.76.05.87.46.88.57.06.65.36.36.16.76.17.37.16.56.05.55.76.36.06.06.56.15.85.94.95.26.55.56.27.96.16.66.55.76.245.151.142.246.454.948.049.238.841.852.852.853.728.444.637.640.352.741.037.150.961.640.247.448.953.253.746.242.236.239.343.128.739.643.846.944.036.135.639.948.532.038.336.044.044.938.247.744.554.441.144.689.446.441.451.867.664.897.1100.096.093.576.284.062.666.191.491.9100.051.979.458.190.477.687.761.465.238.460.050.064.040.263.398.983.573.576.088.685.788.162.658.463.190.033.314.645.740.796.696.388.484.267.2ProvinceDistrictHealth ConditionbyDistrict,199910(%)Populationself-medicatingINDONESIAHUMAN DEVELOPMENT REPORT<strong>2001</strong>114
74.Probolinggo75.Pasuruan76.Mojokerto77.Madiun78.Surabaya01.Jembrana02.Tabanan03.Badung04.Gianyar05.Klungkung06.Bangli07.Karangasem08.Buleleng71.Denpasar01.WestLombok02.Central Lombok03.EastLombok04.Sumbawa05.Dompu06.Bima71.Mataram01.WestSumba02.EastSumba03.Kupang04.Southern Central-Timor05.Northern Central-Timor06.Belu07.Alor08.FloresTimur09.Sikka10.Ende11.Ngada12.Manggarai71.Kupang01.Sambas02.Pontianak03.Sanggau04.Ketapang05.Sintang06.Kapuas Hulu71.Pontianak51.Bali52.WestNusaTenggara53.East NusaTenggara61.WestKalimantan(continued)Infantmortalityrate(%) (%)Population withhealth problem(%)Morbidityrate394529333629182726412744462286888886807859647657495057594647605154855244504652493181565425.031.332.633.025.040.122.032.935.225.331.344.332.021.237.635.530.531.739.829.736.337.450.034.424.241.941.536.135.637.541.242.434.637.120.919.715.727.414.219.727.131.333.836.720.416.718.912.917.913.129.216.425.021.916.724.232.223.710.330.927.918.220.126.524.021.433.242.329.018.136.338.427.322.927.729.729.624.423.412.410.77.717.58.710.714.121.824.128.311.57.14.96.86.55.75.35.84.35.55.65.44.86.04.96.97.25.16.46.77.15.27.26.97.04.96.87.87.46.36.97.27.76.45.47.36.06.05.34.35.75.65.36.56.86.037.841.755.253.149.936.322.845.923.630.329.519.331.934.732.025.633.841.137.232.537.533.436.027.319.316.723.137.420.130.331.224.740.148.145.639.952.743.136.825.940.430.132.930.442.1(%)Birth deliveryassisted bymedicalpersonnel68.589.3100.096.394.871.1100.099.1100.094.191.076.289.7100.042.954.536.542.434.828.045.220.924.323.527.041.844.732.961.464.241.058.427.083.054.137.332.347.943.648.884.392.040.537.950.0(days)Average durationofillnessProvinceDistrictHealth ConditionbyDistrict,199910(%)Populationself-medicatingHUMAN DEVELOPMENTINDICATORSAND INDICES 115
62.Central Kalimantan63.South Kalimantan64.East Kalimantan71.North Sulawesi72.Central Sulawesi73.South Sulawesi01.WestKotawaringin02.EastKotawaringin03.Kapuas04.South Barito05.North Barito71.PalangkaRaya01.Tanah Laut02.Kota Baru03.Banjar04.Barito Kuala05.Tapin06.South Hulu Sungai07.Central Hulu Sungai08.North Hulu Sungai09.Tabalong71.Banjarmasin01.Pasir02.Kutai03.Berau04.Bulongan71.Balikpapan72.Samarinda01.Gorontalo02.Bolaang Mongondow03.Minahasa04.Sangihe Talaud71.Gorontalo72.Manado73.Bitung01.Luwuk Banggai02.Poso03.Donggala04.BualToli-Toli71.Kodya Palu01.Selayar02.Bulukumba03.Bantaeng04.Jeneponto05.Takalar(continued)Infantmortalityrate(%) (%)Population withhealth problem(%)Morbidityrate32673337603631383145272045656280516763776752264639242835503027245326395666716344453625554316.831.125.623.520.724.221.312.315.521.210.728.730.834.926.828.835.037.132.731.131.029.524.524.431.420.423.531.029.721.426.113.525.314.932.619.823.317.625.521.122.111.027.529.426.59.617.312.015.013.914.111.49.09.211.16.311.817.422.811.716.721.225.820.716.614.714.410.511.717.913.111.212.715.514.918.310.918.48.622.114.814.213.216.810.716.37.616.715.415.15.75.45.55.96.96.74.95.55.67.26.85.85.94.85.95.35.06.45.05.05.95.26.45.46.75.84.65.35.55.05.69.07.35.56.36.66.18.66.14.96.87.66.37.07.553.652.342.341.145.344.150.540.862.559.643.556.854.848.440.558.058.248.451.652.057.660.841.637.440.437.343.049.442.848.534.231.330.755.244.145.447.236.747.359.550.254.642.540.340.4(%)Birth deliveryassisted bymedicalpersonnel62.458.565.271.153.456.965.049.466.757.273.884.165.647.956.242.547.451.657.159.262.880.355.264.270.941.081.076.053.868.771.753.771.2100.092.960.652.552.525.092.266.451.022.127.835.9(days)Average durationofillnessProvinceDistrictHealth ConditionbyDistrict,199910(%)Populationself-medicatingINDONESIAHUMAN DEVELOPMENT REPORT<strong>2001</strong>116
10 Health ConditionbyDistrict,1999(continued)ProvinceDistrictInfantmortality Population withrate health problem(%) (%)Morbidityrate(%)Average durationofillness(days)Populationself-medicating(%)Birth deliveryassisted bymedicalpersonnel(%)06.Gowa07.Sinjai08.Maros09.Pangkep10.Barru11.Bone12.Soppeng13.Wajo14.Sidenreng Rappang15.Pinrang16.Enrekang17.Luwu18.TanaToraja19.Polewali Mamasa20.Majene21.Mamuju71.UjungPandang72.Pare Pare29313541434126413135202317596241232129.932.024.924.727.919.710.920.153.325.816.929.914.521.023.621.122.626.322.822.913.415.116.211.35.411.022.713.79.315.49.013.218.913.912.714.97.65.26.56.37.36.49.27.66.67.57.76.29.26.45.16.75.66.152.547.123.841.836.141.248.146.944.854.040.341.339.040.945.650.345.947.060.648.862.361.952.561.973.151.659.976.750.859.533.730.238.826.488.381.574.South-east Sulawesi5017.010.66.549.735.601.Buton02.Muna03.Kendari04.Kolaka71.Kendari4554495118.222.115.813.515.310.116.310.97.97.37.17.15.86.85.250.138.450.058.159.351.624.339.312.865.381.Maluku4016.511.46.854.948.501.South-eastMaluku02.Central Maluku03.North Maluku04.Central Halmahera71.Ambon285547472319.918.116.614.610.417.010.912.110.26.46.99.15.06.56.078.840.258.156.853.744.145.653.127.573.582.IrianJaya5222.514.15.515.557.001.Merauke02.Jaya Wijaya03.Jaya Pura04.Paniai05.Fak Fak06.Sorong07.Manokwari08.Yapen Waropen09.Biak Numfor71.Jaya Pura8053474637544559544320.931.88.430.13.716.926.522.316.421.211.418.66.316.82.413.816.118.19.716.84.95.65.45.83.75.14.65.16.56.316.99.613.410.819.634.712.311.116.528.252.435.277.932.753.967.861.574.080.274.8Note:a) Extrapolation based on Population Census(PC)1971, PC 1980,PC 1990,1995SurveyBetween Census and 1996 Socio-economicsurvey.The number before each districtisthe official area code.Districtrefers to both regencyand City.Source: BPS special tabulationHUMAN DEVELOPMENTINDICATORSAND INDICES 117
ProvinceDistrict11.Aceh12.North Sumatera13.WestSumatera01.SouthAceh02.South-eastAceh03.EastAceh04.CentralAceh05.WeastAceh06.Aceh Besar07.Pidie08.NorthAceh71.BandaAceh72.Sabang01.Nias02.SouthTapanuli03.Central Tapanuli04.NorthTapanuli05.Labuhan Batu06.Asahan07.Simalungun08.Dairi09.Karo10.DeliSerdang11.Langkat71.Sibolga72.Tanjung Balai73.Pematang Siantar74.TebingTinggi75.Medan76.Binjai01.South Pesisir02.Solok03.Sawah Lunto/Sijunjun04.Tanah Datar05.Padang Pariaman06.Agam07.Limapuluh Koto08.Pasaman71.Padang72.Solok73.Sawah Lunto74.Padang Panjang75.BukitTinggi76.Payakumbuhage 7-12 age 13-15 age 16-18 age 19-24 age 7-15 age 16-18 age 19-24School participationrate96.397.296.792.396.797.098.692.099.298.496.499.198.894.596.594.598.696.897.398.497.798.096.198.798.296.298.198.598.299.397.195.795.397.595.697.195.895.599.496.398.298.499.196.481.787.484.077.781.878.783.373.186.684.483.592.690.776.290.486.295.777.977.790.294.394.985.988.891.579.494.392.891.291.183.880.578.192.090.584.480.568.793.282.586.388.289.487.348.463.963.944.755.047.752.438.263.043.743.275.169.841.057.957.086.355.551.163.070.476.059.058.973.454.181.773.776.877.063.046.355.565.166.868.948.745.383.074.981.177.282.169.812.114.918.93.75.910.38.84.723.26.710.042.77.55.35.011.219.35.56.29.113.111.610.913.010.86.915.210.233.221.511.17.23.912.415.515.07.05.841.718.88.224.124.314.03.02.94.76.11.63.22.25.43.01.22.32.11.85.22.13.51.33.54.12.71.61.74.51.62.34.31.30.72.31.14.75.95.23.33.24.06.88.22.24.62.72.83.25.010.411.816.620.68.211.46.619.57.59.05.56.07.223.27.319.17.415.617.613.58.712.816.58.512.417.43.23.36.37.316.232.627.215.115.412.423.121.85.216.48.914.56.313.812.914.021.529.513.017.810.019.08.48.88.04.614.133.112.029.416.220.420.816.117.412.313.110.918.420.08.02.36.39.920.035.034.720.120.130.224.628.49.525.714.018.69.422.2School dropoutrateSchoolAttendancebyDistrict,199911INDONESIAHUMAN DEVELOPMENT REPORT<strong>2001</strong>118
11SchoolAttendancebyDistrict,1999(continued)ProvinceDistrictSchool participationrateSchool dropoutrateage 7-12 age 13-15 age 16-18 age 19-24 age 7-15 age 16-18 age 19-2414.Riau96.385.253.49.42.611.213.901.Indragiri Hulu02.Indragiri Ilir03.Kepulauan Riau04.Kampar05.Bengkalis71.Pekan Baru72.Batam97.194.896.496.295.798.196.281.079.985.385.183.795.793.252.438.057.442.552.376.464.512.65.56.54.53.826.85.23.42.63.03.02.41.71.214.313.415.115.68.54.011.613.315.020.527.110.46.46.815.Jambi96.281.149.88.13.511.716.101.Kerinci02.Bungo Tebo03.Sarolangun Bangko04.Batanghari05.Tanjung Jabung71.Jambi97.296.195.894.696.697.686.677.980.877.280.486.758.548.638.237.439.675.28.15.95.74.94.418.43.04.52.13.25.52.25.514.114.713.618.13.611.616.515.422.523.18.416.South Sumatera95.277.047.19.35.018.020.801.Ogan Komering Ulu02.Ogan Komering Hilir03.MuaraEnim(Liot)04.Lahat05.MusiRawas06.MusiBanyuasin07.Bangka08.Balitung71.Palembang72.Pangkal Pinang97.192.594.895.792.995.992.397.097.095.984.057.674.278.472.274.072.980.888.788.552.825.639.949.435.627.051.154.470.472.65.63.08.06.34.81.15.26.024.89.93.27.86.24.57.94.06.43.93.44.214.730.519.417.422.925.915.513.07.515.316.027.528.522.318.628.726.520.211.323.117.Bengkulu95.482.255.617.33.716.817.001.South Bengkulu02.Rejang Lebong03.North Bengkulu71.Bengkulu96.795.392.898.686.580.973.295.357.654.132.086.511.68.54.242.22.75.34.41.520.321.519.35.720.321.218.69.418.Lampung95.181.049.69.22.912.315.201.South Lampung02.Central Lampung03.North Lampung04.WestLampung71.Bandar Lampung94.596.793.096.397.384.180.074.776.390.348.847.038.649.271.110.35.93.67.520.93.21.94.12.62.113.410.316.98.29.018.99.819.717.212.331.Jakarta98.492.473.423.61.65.95.571.South Jakarta72.EastJakarta73.Central Jakarta74.WestJakarta75.North Jakarta98.098.697.799.098.093.295.691.789.990.672.479.973.568.172.825.522.626.123.321.81.50.62.32.02.05.53.07.88.16.24.03.45.77.18.3HUMAN DEVELOPMENTINDICATORSAND INDICES 119
32.WestJava33.Central Java01.Pandeglang02.Lebak03.Bogor04.Sukabumi05.Cianjur06.Bandung07.Garut08.Tasikmalaya09.Ciamis10.Kuningan11.Cirebon12.Majalengka13.Sumedang14.Indramayu15.Subang16.Purwakarta17.Karawang18.Bekasi19.Tangerang20.Serang71.Bogor72.Sukabumi73.Bandung74.Cirebon75.Tangerang76.Bekasi01.Cilacap02.Banyumas03.Purbalingga04.Banjarnegara05.Kebumen06.Purworejo07.Wonosobo08.Magelang09.Boyolali10.Klaten11.Sukoharjo12.Wonogiri13.Karanganyar14.Sragen15.Grobogan16.Blora17.Rembang18.Pati19.Kudus20.Jepara21.Demak22.Semarang23.Temanggung(continued)age 7-12 age 13-15 age 16-18 age 19-24 age 7-15 age 16-18 age 19-24School participationrate95.497.493.293.592.494.194.996.395.195.398.295.695.596.096.294.598.396.997.594.794.694.994.298.197.596.998.598.298.698.496.996.397.598.796.297.998.897.998.898.199.498.497.198.098.799.099.298.698.699.398.372.281.557.254.978.962.849.373.469.565.677.471.570.665.977.159.270.570.758.273.172.473.587.691.288.389.792.696.885.882.873.769.184.392.867.182.489.091.596.690.792.588.383.977.782.782.889.272.078.883.973.745.449.424.132.754.934.927.443.233.038.144.351.836.029.850.936.937.038.929.154.247.031.871.472.464.676.964.476.951.553.549.637.357.666.535.456.361.073.969.554.250.556.641.741.044.345.043.837.336.654.434.211.410.24.62.515.03.42.18.93.62.95.76.510.23.37.93.73.75.94.810.611.74.427.613.232.620.918.916.37.210.05.45.97.19.83.49.414.115.723.412.210.28.06.43.23.37.76.14.36.87.23.93.31.65.43.35.84.53.03.42.72.61.41.63.20.81.76.53.83.82.72.44.91.44.11.42.32.31.20.61.02.22.73.01.50.82.11.11.10.70.60.40.21.00.71.21.01.10.42.11.61.11.710.37.119.68.110.912.45.810.311.85.96.04.213.77.43.022.112.39.913.510.715.010.39.54.86.75.97.74.48.27.17.710.15.42.13.26.73.74.33.32.62.13.63.08.47.42.83.58.08.95.89.311.39.419.612.614.313.08.58.213.57.03.86.315.36.86.231.413.89.416.47.316.613.110.83.35.18.710.84.418.310.79.513.511.38.09.910.74.97.94.51.63.94.56.59.38.26.13.68.89.28.110.4School dropoutrateProvinceDistrictSchoolAttendancebyDistrict,199911INDONESIAHUMAN DEVELOPMENT REPORT<strong>2001</strong>120
24.Kendal25.Batang26.Pekalongan27.Pemalang28.Tegal29.Brebes71.Magelang72.Surakarta73.Salatiga74.Semarang75.Pekalongan76.Tegal01.Kulon Progo02.Bantul03.GunungKidul04.Sleman71.Yogyakarta01.Pacitan02.Ponorogo03.Trenggalek04.Tulungagung05.Blitar06.Kediri07.Malang08.Lumajang09.Jember10.Banyuwangi11.Bondowoso12.Situbondo13.Probolinggo14.Pasuruan15.Sidoarjo16.Mojokerto17.Jombang18.Nganjuk19.Madiun20.Magetan21.Ngawi22.Bojonegoro23.Tuban24.Lamongan25.Gresik26.Bangkalan27.Sampang28.Pamekasan29.Sumenep71.Kediri72.Blitar73.Malang34.Yogyakarta35.East Java(continued)age 7-12 age 13-15 age 16-18 age 19-24 age 7-15 age 16-18 age 19-24School participationrate97.996.397.594.894.093.198.197.999.598.696.894.399.798.799.498.9100.097.496.797.499.697.598.195.193.888.596.594.989.192.196.499.198.598.098.798.899.198.798.496.699.298.585.076.895.296.6100.0100.097.599.295.479.374.772.672.477.767.896.292.897.290.680.980.797.092.797.394.796.085.194.579.992.682.885.079.272.257.580.565.070.250.775.595.589.791.387.394.396.288.781.473.992.391.954.642.757.071.795.597.785.195.480.444.634.830.429.747.732.084.176.483.671.452.247.786.570.184.782.782.842.563.338.263.352.160.336.538.531.341.832.536.423.833.679.548.264.460.561.273.454.139.135.057.864.728.211.533.935.478.676.568.080.650.39.64.04.04.78.75.523.934.939.930.411.38.219.319.534.055.062.93.710.94.78.15.68.89.44.44.95.04.84.11.66.817.65.612.812.56.06.03.14.84.67.614.26.42.61.21.719.114.841.944.011.32.43.22.61.92.14.10.31.30.90.62.34.30.31.30.30.00.01.10.60.50.92.11.31.42.77.93.04.88.45.64.20.41.21.00.70.00.30.60.72.01.12.24.78.84.14.40.30.31.80.52.59.913.08.616.28.516.22.41.73.52.89.915.42.15.50.45.82.23.82.07.64.18.83.611.37.218.210.924.322.621.014.94.06.36.93.21.51.55.33.011.17.34.610.636.617.216.92.85.95.83.59.210.112.216.211.911.719.24.56.53.82.913.013.02.87.71.82.84.18.816.44.810.010.57.511.713.526.513.421.324.923.619.45.39.88.15.49.36.710.24.811.810.24.919.232.419.325.63.110.58.73.912.0School dropoutrateProvinceDistrictSchoolAttendancebyDistrict,199911HUMAN DEVELOPMENTINDICATORSAND INDICES 121
74.Probolinggo75.Pasuruan76.Mojokerto77.Madiun78.Surabaya01.Jembrana02.Tabanan03.Badung04.Gianyar05.Klungkung06.Bangli07.Karangasem08.Buleleng71.Denpasar01.WestLombok02.Central Lombok03.EastLombok04.Sumbawa05.Dompu06.Bima71.Mataram01.WestSumba02.EastSumba03.Kupang04.Southern Central-Timor05.Northern Central-Timor06.Belu07.Alor08.FloresTimur09.Sikka10.Ende11.Ngada12.Manggarai71.Kupang01.Sambas02.Pontianak03.Sanggau04.Ketapang05.Sintang06.Kapuas Hulu71.Pontianak51.Bali52.WestNusaTenggara53.East NusaTenggara61.WestKalimantan(continued)age 7-12 age 13-15 age 16-18 age 19-24 age 7-15 age 16-18 age 19-24School participationrate92.697.198.799.597.195.499.698.898.997.496.790.596.499.188.493.794.397.192.191.794.877.493.685.890.988.883.891.892.386.993.495.089.796.991.387.390.088.491.293.194.896.793.089.090.378.487.794.495.390.782.992.890.391.692.673.074.879.288.758.364.970.874.177.684.782.172.080.066.557.270.466.982.569.872.977.269.660.892.472.679.778.765.170.880.083.983.671.569.776.057.559.472.284.069.642.781.272.165.671.343.040.862.274.925.432.438.347.057.860.364.035.254.225.026.830.130.448.631.629.449.930.313.679.239.941.336.425.023.243.869.463.441.834.441.08.612.514.219.828.05.615.214.014.08.04.85.29.032.65.52.24.53.71.65.829.96.47.14.33.73.21.94.95.54.511.23.11.343.75.38.65.73.44.59.225.115.17.38.19.53.51.60.50.61.32.80.32.00.40.83.43.32.91.39.35.55.52.37.35.83.97.04.56.96.83.58.42.75.89.86.53.75.91.66.27.03.87.32.43.55.02.15.86.05.49.511.86.12.16.416.61.32.25.03.18.119.27.72.830.723.925.011.022.119.47.339.027.435.927.316.430.220.224.741.132.328.335.18.027.331.917.535.325.918.612.16.921.729.525.28.913.58.47.65.613.84.55.06.59.010.419.213.73.034.828.727.919.030.223.510.240.444.435.036.412.730.727.629.549.047.426.838.68.025.736.628.934.325.416.812.08.525.532.826.2School dropoutrateProvinceDistrictSchoolAttendancebyDistrict,199911INDONESIAHUMAN DEVELOPMENT REPORT<strong>2001</strong>122
11SchoolAttendancebyDistrict,1999(continued)ProvinceDistrictSchool participationrateSchool dropoutrateage 7-12 age 13-15 age 16-18 age 19-24 age 7-15 age 16-18 age 19-2462.Central Kalimantan97.580.649.510.63.217.020.701.WestKotawaringin02.EastKotawaringin03.Kapuas04.South Barito05.North Barito71.PalangkaRaya96.197.597.597.798.098.080.577.980.481.778.690.846.240.950.451.742.575.34.64.15.07.59.039.94.52.53.54.42.32.223.223.712.616.014.58.338.418.019.826.315.18.963.South Kalimantan94.772.243.010.05.016.420.501.Tanah Laut02.Kota Baru03.Banjar04.Barito Kuala05.Tapin06.South Hulu Sungai07.Central Hulu Sungai08.North Hulu Sungai09.Tabalong71.Banjarmasin91.891.394.794.997.193.995.097.595.696.570.267.265.463.675.566.773.762.075.391.630.333.551.722.138.625.736.533.245.966.12.42.917.94.46.63.73.43.03.721.47.26.26.85.64.75.34.53.43.42.630.318.614.029.111.223.710.615.814.58.835.924.718.332.421.120.916.420.825.79.964.East Kalimantan97.084.658.313.83.110.814.201.Pasir02.Kutai03.Berau04.Bulongan71.Balikpapan72.Samarinda92.797.495.495.499.198.771.084.771.676.093.891.142.650.448.151.276.866.96.29.86.38.914.522.27.32.44.94.61.12.325.610.412.813.25.06.324.716.021.823.06.410.071.North Sulawesi93.676.746.510.16.823.229.901.Gorontalo02.Bolaang Mongondow03.Minahasa04.Sangihe Talaud71.Gorontalo72.Manado73.Bitung86.794.197.994.796.297.396.759.971.489.285.480.788.674.034.428.353.349.755.368.236.95.52.36.35.612.227.29.110.68.72.95.16.14.58.624.933.521.220.326.510.446.237.139.735.827.424.78.636.472.Central Sulawesi94.669.438.97.45.823.125.001.Luwuk Banggai02.Poso03.Donggala04.BualToli-Toli71.Kodya Palu96.497.891.294.496.566.772.266.364.985.132.237.532.428.771.13.75.75.50.925.15.34.18.15.13.822.324.128.731.35.724.324.627.839.97.373.South Sulawesi91.169.645.013.36.718.919.501.Selayar02.Bulukumba03.Bantaeng04.Jeneponto05.Takalar94.091.274.576.991.262.868.541.360.663.435.634.524.033.230.41.52.01.94.35.96.06.115.513.35.416.714.636.330.822.821.821.735.231.927.4HUMAN DEVELOPMENTINDICATORSAND INDICES 123
11SchoolAttendancebyDistrict,1999(continued)ProvinceDistrictSchool participationrateSchool dropoutrateage 7-12 age 13-15 age 16-18 age 19-24 age 7-15 age 16-18 age 19-2406.Gowa07.Sinjai08.Maros09.Pangkep10.Barru11.Bone12.Soppeng13.Wajo14.Sidenreng Rappang15.Pinrang16.Enrekang17.Luwu18.TanaToraja19.Polewali Mamasa20.Majene21.Mamuju71.UjungPandang72.Pare Pare90.992.592.193.495.291.194.891.194.094.396.193.391.684.390.685.395.595.066.863.068.764.170.960.773.954.667.363.881.380.380.253.568.266.586.082.140.637.438.043.951.434.144.931.037.233.857.848.665.223.843.325.372.863.78.71.09.48.06.91.82.66.05.53.26.18.610.31.34.32.340.15.66.87.97.86.04.06.95.57.69.67.04.95.05.39.66.910.83.24.020.022.019.319.012.715.114.119.420.429.919.721.416.525.712.330.78.412.025.124.524.615.319.413.819.225.429.820.722.720.924.732.514.735.85.815.474.South-east Sulawesi93.977.049.911.05.821.423.301.Buton02.Muna03.Kendari04.Kolaka71.Kendari95.090.494.692.897.879.674.472.673.992.753.151.242.441.373.08.87.47.35.635.85.27.85.76.91.818.727.524.823.86.523.934.528.218.47.481.Maluku94.484.861.917.83.014.416.301.South-eastMaluku02.Central Maluku03.North Maluku04.Central Halmahera71.Ambon93.691.196.893.798.385.883.682.878.797.366.962.950.232.592.42.214.815.44.835.83.12.92.96.21.314.816.114.835.10.023.915.918.729.16.182.IrianJaya82.875.550.512.94.520.028.501.Merauke02.Jaya Wijaya03.Jaya Pura04.Paniai05.Fak Fak06.Sorong07.Manokwari08.Yapen Waropen09.Biak Numfor71.Jaya Pura78.570.891.874.191.194.089.691.194.896.969.058.682.880.082.590.465.977.587.690.834.730.664.443.057.355.646.531.069.385.66.19.023.47.310.36.03.33.625.633.28.86.83.81.82.71.75.81.44.02.427.228.114.324.112.418.721.723.622.17.146.434.923.626.912.435.323.642.824.511.4Note:a) Extrapolation based on Population Census(PC)1971, PC 1980,PC 1990,1995SurveyBetween Census and 1996 Socio-economicsurvey.The number before each districtisthe official area code.Districtrefers to both regencyand City.Source: BPS special tabulation124INDONESIAHUMAN DEVELOPMENT REPORT<strong>2001</strong>
ProvinceDistrict11.Aceh12.North Sumatera13.WestSumatera01.SouthAceh02.South-eastAceh03.EastAceh04.CentralAceh05.WeastAceh06.Aceh Besar07.Pidie08.NorthAceh71.BandaAceh72.Sabang01.Nias02.SouthTapanuli03.Central Tapanuli04.NorthTapanuli05.Labuhan Batu06.Asahan07.Simalungun08.Dairi09.Karo10.DeliSerdang11.Langkat71.Sibolga72.Tanjung Balai73.Pematang Siantar74.TebingTinggi75.Medan76.Binjai01.South Pesisir02.Solok03.Sawah Lunto/Sijunjun04.Tanah Datar05.Padang Pariaman06.Agam07.Limapuluh Koto08.Pasaman71.Padang72.Solok73.Sawah Lunto74.Padang Panjang75.BukitTinggi76.Payakumbuh41.848.949.630.725.438.339.529.838.142.648.175.567.138.625.130.233.543.956.955.940.954.545.555.480.174.490.030.164.636.849.054.948.658.236.847.648.240.347.286.281.987.079.761.938.552.153.626.335.452.445.524.538.721.239.076.564.151.733.938.436.336.157.761.849.154.144.454.789.379.192.030.871.836.746.165.449.155.638.355.952.759.845.088.670.883.978.364.414.17.52.58.411.422.215.912.04.117.716.61.52.611.15.54.62.19.99.113.66.53.09.021.20.70.31.32.31.24.16.91.18.11.61.30.42.12.81.52.61.10.70.42.411.14.01.98.18.016.611.49.32.113.014.50.52.09.20.70.71.39.15.28.03.22.33.99.70.70.20.61.80.22.34.60.86.90.21.20.42.13.00.71.61.20.80.01.034.620.234.948.035.717.019.050.451.261.526.66.734.137.941.461.250.38.35.734.153.533.914.46.96.611.66.53.51.62.069.836.447.626.034.58.119.575.623.616.814.91.00.22.630.416.832.745.131.010.18.858.437.252.621.35.431.437.129.659.643.98.06.033.849.421.48.34.611.53.42.83.02.02.663.456.137.824.037.316.94.453.218.917.222.93.80.21.4Housing ConditionbyDistrict,1996 and1999121996 19961999 1999Householdswith accessto safe waterHouseholdswithdirtfloor(%) (%)1996 1999Householdswithoutaccess to sanitation(%)HUMAN DEVELOPMENTINDICATORSAND INDICES 125
12 Housing ConditionbyDistrict,1996 and1999(continued)ProvinceDistrictHouseholdswith accessto safe waterHouseholdswithdirtfloor(%) (%)1996 1999 1996 1999Householdswithoutaccess to sanitation(%)1996 199914.Riau32.328.25.62.614.711.401.Indragiri Hulu02.Indragiri Ilir03.Kepulauan Riau04.Kampar05.Bengkalis71.Pekan Baru72.Batam52.87.944.339.319.334.859.352.32.540.832.317.824.055.516.00.31.39.05.81.20.62.70.01.06.83.50.20.627.118.111.934.44.70.50.728.53.612.826.55.11.30.215.Jambi39.942.711.46.220.920.301.Kerinci02.Bungo Tebo03.Sarolangun Bangko04.Batanghari05.Tanjung Jabung71.Jambi49.537.633.450.06.163.063.039.234.945.75.671.72.212.823.013.47.04.92.95.513.18.92.32.834.626.232.321.09.41.735.830.931.18.614.63.716.South Sumatera39.040.314.111.124.122.301.Ogan Komering Ulu02.Ogan Komering Hilir03.MuaraEnim(Liot)04.Lahat05.MusiRawas06.MusiBanyuasin07.Bangka08.Balitung71.Palembang72.Pangkal Pinang39.335.225.927.332.717.840.045.574.550.845.934.439.216.530.320.538.532.077.242.524.118.56.84.124.527.35.10.61.70.619.016.74.43.418.322.62.40.21.70.321.224.444.446.133.810.946.138.11.09.322.018.939.544.421.69.643.942.83.78.417.Bengkulu40.740.813.312.132.531.101.South Bengkulu02.Rejang Lebong03.North Bengkulu71.Bengkulu35.735.149.139.419.343.952.338.614.23.727.80.87.62.129.31.649.732.638.13.646.738.935.73.218.Lampung41.445.643.234.410.712.001.South Lampung02.Central Lampung03.North Lampung04.WestLampung71.Bandar Lampung48.839.039.435.937.441.351.147.332.043.444.444.360.237.75.435.133.448.126.93.722.92.97.817.95.224.42.86.035.49.731.Jakarta58.459.81.10.31.00.871.South Jakarta72.EastJakarta73.Central Jakarta74.WestJakarta75.North Jakarta25.637.775.877.893.627.343.583.673.494.30.21.40.71.61.20.60.00.30.20.70.31.80.30.22.10.10.20.01.12.6126INDONESIAHUMAN DEVELOPMENT REPORT<strong>2001</strong>
32.WestJava33.Central Java01.Pandeglang02.Lebak03.Bogor04.Sukabumi05.Cianjur06.Bandung07.Garut08.Tasikmalaya09.Ciamis10.Kuningan11.Cirebon12.Majalengka13.Sumedang14.Indramayu15.Subang16.Purwakarta17.Karawang18.Bekasi19.Tangerang20.Serang71.Bogor72.Sukabumi73.Bandung74.Cirebon75.Tangerang76.Bekasi01.Cilacap02.Banyumas03.Purbalingga04.Banjarnegara05.Kebumen06.Purworejo07.Wonosobo08.Magelang09.Boyolali10.Klaten11.Sukoharjo12.Wonogiri13.Karanganyar14.Sragen15.Grobogan16.Blora17.Rembang18.Pati19.Kudus20.Jepara21.Demak22.Semarang23.Temanggung(continued)41.852.656.738.839.034.539.635.030.235.548.841.045.440.747.248.939.140.039.345.829.841.463.054.964.652.940.2-40.147.240.838.846.738.360.749.860.550.662.454.037.660.053.978.167.465.353.857.163.562.562.537.952.247.439.441.043.437.829.235.120.039.334.743.146.540.940.329.346.929.948.822.736.131.152.866.282.232.225.141.249.031.136.343.742.266.271.162.945.335.258.741.759.165.075.279.146.450.255.447.758.449.310.447.718.07.15.03.80.50.20.62.08.25.923.77.80.634.024.93.341.612.920.016.50.50.70.717.24.2-47.242.349.748.652.842.144.552.860.029.126.050.934.167.179.081.465.269.926.958.466.652.448.27.137.811.49.32.02.70.30.60.51.16.63.012.56.00.024.213.52.930.028.413.611.20.20.70.53.01.40.734.731.140.238.537.638.734.540.949.721.120.434.625.461.173.475.453.156.916.344.355.238.540.422.830.557.255.715.124.428.69.415.010.521.318.739.826.615.248.735.917.936.15.617.361.53.90.50.637.73.5-21.939.757.826.730.016.416.026.526.140.832.68.031.532.318.719.239.623.423.126.537.319.328.620.830.960.650.610.830.525.76.312.215.08.415.036.725.115.939.431.317.539.612.021.256.345.52.40.23.36.70.327.632.959.432.828.627.614.523.519.836.225.47.135.024.720.414.346.722.527.423.343.423.429.3ProvinceDistrictHousing ConditionbyDistrict,1996 and1999121996 19961999 1999Householdswith accessto safe waterHouseholdswithdirtfloor(%) (%)1996 1999Householdswithoutaccess to sanitation(%)HUMAN DEVELOPMENTINDICATORSAND INDICES 127
24.Kendal25.Batang26.Pekalongan27.Pemalang28.Tegal29.Brebes71.Magelang72.Surakarta73.Salatiga74.Semarang75.Pekalongan76.Tegal01.Kulon Progo02.Bantul03.GunungKidul04.Sleman71.Yogyakarta01.Pacitan02.Ponorogo03.Trenggalek04.Tulungagung05.Blitar06.Kediri07.Malang08.Lumajang09.Jember10.Banyuwangi11.Bondowoso12.Situbondo13.Probolinggo14.Pasuruan15.Sidoarjo16.Mojokerto17.Jombang18.Nganjuk19.Madiun20.Magetan21.Ngawi22.Bojonegoro23.Tuban24.Lamongan25.Gresik26.Bangkalan27.Sampang28.Pamekasan29.Sumenep71.Kediri72.Blitar73.Malang34.Yogyakarta35.East Java(continued)52.745.730.046.335.744.472.547.782.973.542.373.746.944.048.145.854.758.668.558.647.047.768.961.453.453.050.870.545.343.161.662.674.252.863.355.281.167.567.759.450.345.464.186.663.260.637.241.151.247.461.351.429.328.741.729.156.081.961.083.284.737.578.660.146.357.153.639.552.264.751.145.347.847.761.042.855.539.753.339.348.534.373.459.150.657.255.473.956.661.661.555.853.356.751.756.255.435.429.857.951.157.072.657.834.646.826.142.88.67.97.716.212.36.750.716.645.514.04.253.449.950.428.927.827.629.618.631.233.551.443.249.926.24.331.627.442.859.73.672.181.677.868.927.638.379.249.89.411.08.87.323.934.660.050.926.638.420.431.14.93.97.29.85.76.638.611.133.46.21.744.239.441.022.020.519.626.512.525.622.343.644.641.317.41.922.821.734.653.119.763.775.166.653.818.928.068.638.68.06.24.83.615.828.345.356.456.659.043.650.311.21.80.54.012.228.03.133.84.229.00.56.828.837.415.725.018.622.857.860.956.070.569.276.064.235.535.032.920.822.712.335.154.556.323.513.624.554.545.444.89.418.613.917.436.252.459.258.352.941.859.65.62.52.83.019.323.42.629.23.128.10.95.621.438.015.722.415.917.252.356.154.367.363.475.761.117.230.531.120.619.013.929.049.951.520.49.923.351.938.241.77.118.75.716.131.9ProvinceDistrictHousing ConditionbyDistrict,1996 and1999121996 19961999 1999Householdswith accessto safe waterHouseholdswithdirtfloor(%) (%)1996 1999Householdswithoutaccess to sanitation(%)INDONESIAHUMAN DEVELOPMENT REPORT<strong>2001</strong>128
74.Probolinggo75.Pasuruan76.Mojokerto77.Madiun78.Surabaya01.Jembrana02.Tabanan03.Badung04.Gianyar05.Klungkung06.Bangli07.Karangasem08.Buleleng71.Denpasar01.WestLombok02.Central Lombok03.EastLombok04.Sumbawa05.Dompu06.Bima71.Mataram01.WestSumba02.EastSumba03.Kupang04.Southern Central-Timor05.Northern Central-Timor06.Belu07.Alor08.FloresTimur09.Sikka10.Ende11.Ngada12.Manggarai71.Kupang01.Sambas02.Pontianak03.Sanggau04.Ketapang05.Sintang06.Kapuas Hulu71.Pontianak51.Bali52.WestNusaTenggara53.East NusaTenggara61.WestKalimantan(continued)60.474.233.050.894.460.761.846.175.864.863.967.670.249.829.331.437.148.060.546.830.148.356.556.646.352.657.748.144.833.740.987.166.0-25.68.112.920.721.710.621.562.637.253.717.559.073.444.150.795.556.174.137.076.272.971.169.676.356.935.347.820.541.157.148.138.451.669.252.555.369.662.159.245.344.645.485.660.375.229.812.621.431.024.714.214.665.837.558.121.66.412.39.17.31.515.83.71.43.65.28.821.69.00.824.838.743.711.622.62.67.017.527.852.284.780.670.167.363.954.935.049.845.9-0.81.51.60.312.10.00.07.727.054.82.43.14.87.72.52.510.11.93.13.83.06.715.36.20.614.630.128.910.619.64.35.712.323.759.774.674.563.563.357.842.630.139.546.611.30.71.21.80.83.90.00.05.619.348.11.337.441.615.75.11.340.718.514.932.931.847.771.536.64.552.076.360.754.544.742.826.837.428.524.01.81.237.422.421.740.129.314.227.9-48.937.652.130.257.647.52.832.256.123.540.731.535.419.10.21.035.014.711.217.527.241.161.126.34.162.564.968.247.351.546.020.749.831.841.42.97.233.723.232.540.433.418.335.80.339.038.950.438.442.151.82.424.956.928.236.9ProvinceDistrictHousing ConditionbyDistrict,1996 and1999121996 19961999 1999Householdswith accessto safe waterHouseholdswithdirtfloor(%) (%)1996 1999Householdswithoutaccess to sanitation(%)HUMAN DEVELOPMENTINDICATORSAND INDICES 129
12 Housing ConditionbyDistrict,1996 and1999(continued)ProvinceDistrictHouseholdswith accessto safe waterHouseholdswithdirtfloor(%) (%)1996 1999 1996 1999Householdswithoutaccess to sanitation(%)1996 199962.Central Kalimantan26.531.82.61.941.119.001.WestKotawaringin02.EastKotawaringin03.Kapuas04.South Barito05.North Barito71.PalangkaRaya52.026.810.132.121.541.359.419.528.644.526.928.718.30.00.50.20.00.212.30.00.00.20.01.125.031.457.843.872.43.918.320.111.433.345.42.663.South Kalimantan52.853.33.32.527.918.101.Tanah Laut02.Kota Baru03.Banjar04.Barito Kuala05.Tapin06.South Hulu Sungai07.Central Hulu Sungai08.North Hulu Sungai09.Tabalong71.Banjarmasin50.366.237.515.557.150.441.343.048.191.447.065.441.19.651.235.542.350.456.395.216.110.80.10.38.70.40.20.01.50.213.36.90.30.24.60.20.00.12.40.015.326.220.550.539.535.830.953.220.89.717.218.76.622.313.537.317.841.823.55.264.East Kalimantan63.564.22.11.415.511.401.Pasir02.Kutai03.Berau04.Bulongan71.Balikpapan72.Samarinda50.956.148.337.285.784.844.356.648.037.892.081.14.43.40.10.20.40.73.32.70.20.00.70.022.621.632.118.51.26.225.49.733.426.71.42.971.North Sulawesi51.055.514.09.725.725.001.Gorontalo02.Bolaang Mongondow03.Minahasa04.Sangihe Talaud71.Gorontalo72.Manado73.Bitung35.749.951.856.647.567.068.135.060.966.154.253.961.664.518.912.014.821.64.75.310.515.511.57.912.93.33.08.655.543.56.431.218.72.79.756.042.26.026.311.82.79.372.Central Sulawesi45.148.318.213.849.647.401.Luwuk Banggai02.Poso03.Donggala04.BualToli-Toli71.Kodya Palu50.947.040.653.334.864.054.242.345.729.942.121.911.46.82.531.415.69.14.62.458.143.458.453.817.250.936.563.449.912.873.South Sulawesi49.050.94.53.539.036.401.Selayar02.Bulukumba03.Bantaeng04.Jeneponto05.Takalar31.248.537.231.852.126.951.557.733.441.20.21.32.81.26.40.00.91.21.35.474.652.657.265.038.978.944.762.759.540.0130INDONESIAHUMAN DEVELOPMENT REPORT<strong>2001</strong>
12 Housing ConditionbyDistrict,1996 and1999(continued)ProvinceDistrictHouseholdswith accessto safe waterHouseholdswithdirtfloor(%) (%)1996 1999 1996 1999Householdswithoutaccess to sanitation(%)1996 199906.Gowa07.Sinjai08.Maros09.Pangkep10.Barru11.Bone12.Soppeng13.Wajo14.Sidenreng Rappang15.Pinrang16.Enrekang17.Luwu18.TanaToraja19.Polewali Mamasa20.Majene21.Mamuju71.UjungPandang72.Pare Pare46.360.941.654.841.147.443.936.224.242.038.538.864.541.749.139.583.450.436.158.535.349.938.249.743.832.839.235.448.255.177.748.042.931.981.949.05.81.82.80.51.01.00.62.32.40.53.617.13.36.12.317.12.22.64.51.31.80.60.20.80.31.71.50.92.512.84.24.00.812.91.83.439.932.964.062.251.650.715.526.534.937.954.342.312.657.976.947.22.918.136.231.958.458.748.047.220.125.727.831.251.037.39.655.762.156.34.213.674.South-east Sulawesi58.556.417.014.237.035.001.Buton02.Muna03.Kendari04.Kolaka71.Kendari61.949.971.635.5-56.858.852.254.468.75.08.331.913.0-3.16.632.511.97.659.146.218.533.2-46.342.025.237.914.581.Maluku55.447.928.723.444.243.701.South-eastMaluku02.Central Maluku03.North Maluku04.Central Halmahera71.Ambon56.351.849.054.273.437.641.845.357.870.427.735.532.138.15.035.025.324.731.91.756.655.643.241.511.548.661.543.927.99.182.IrianJaya46.245.515.812.648.838.901.Merauke02.Jaya Wijaya03.Jaya Pura04.Paniai05.Fak Fak06.Sorong07.Manokwari08.Yapen Waropen09.Biak Numfor71.Jaya Pura43.342.841.620.937.558.249.952.341.582.634.255.855.424.640.944.844.730.650.074.514.615.016.58.630.324.221.410.115.96.220.712.76.82.216.820.318.913.77.31.951.479.340.042.854.138.041.355.641.412.446.254.540.438.040.218.738.956.322.714.5Note:The number before each districtisthe official area code.Districtrefers to both regencyand City.Source: BPS special tabulationHUMAN DEVELOPMENTINDICATORSAND INDICES 131
ProvinceDistrict11.Aceh12.North Sumatera13.WestSumatera01.SouthAceh02.South-eastAceh03.EastAceh04.CentralAceh05.WeastAceh06.Aceh Besar07.Pidie08.NorthAceh71.BandaAceh72.Sabang01.Nias02.SouthTapanuli03.Central Tapanuli04.NorthTapanuli05.Labuhan Batu06.Asahan07.Simalungun08.Dairi09.Karo10.DeliSerdang11.Langkat71.Sibolga72.Tanjung Balai73.Pematang Siantar74.TebingTinggi75.Medan76.Binjai01.South Pesisir02.Solok03.Sawah Lunto/Sijunjun04.Tanah Datar05.Padang Pariaman06.Agam07.Limapuluh Koto08.Pasaman71.Padang72.Solok73.Sawah Lunto74.Padang Panjang75.BukitTinggi76.PayakumbuhReal percapitaGRDPin 1998 a)Annual growth in real per capita GRDP(Thousand Rupiah) (%)6.29.46.96.66.17.04.46.57.66.46.71.67.88.89.87.66.66.89.27.57.811.324.311.816.95.85.98.55.07.55.15.34.66.76.99.86.33.86.25.122.46.87.56.45.76.96.15.96.36.54.66.77.56.16.1-0.37.15.06.08.77.29.39.12.69.68.04.18.416.48.74.34.87.57.35.66.04.66.97.26.96.65.16.44.6-2.57.37.46.63.45.43.54.43.93.52.44.14.44.84.1-3.05.82.53.53.55.77.17.75.35.57.55.83.64.56.45.31.75.60.32.83.12.14.33.83.93.62.23.71.80.93.24.33.5-7.4-9.4-6.9-4.93.7-9.5-1.4-4.2-2.3-5.7-10.2-14.7-2.8-7.2-10.3-6.2-7.2-1.5-0.8-3.61.6-6.0-8.7-4.1-8.8-8.7-5.7-14.1-21.8-14.9-6.1-5.3-6.0-5.3-5.3-4.5-6.1-5.1-9.8-6.9-10.0-5.7-7.9-5.6-10.8-9.4-6.9-4.93.7-10.5-1.4-4.2-2.3-5.7-13.6-14.7-2.8-7.2-10.3-6.2-7.2-1.5-0.8-3.61.6-6.0-8.7-4.3-8.8-8.7-5.7-14.1-21.8-14.9-6.1-5.3-6.0-5.3-5.3-4.5-6.1-5.1-9.8-6.9-10.0-5.7-7.9-5.6-1.94.23.54.43.9-2.82.44.14.44.8-3.9-3.05.82.53.53.55.77.17.75.35.57.55.8-9.74.56.45.31.75.60.32.83.12.14.33.83.93.62.23.71.80.93.24.33.50.66.76.15.96.33.94.66.77.56.1-1.8-0.37.15.06.08.77.29.39.12.69.68.04.15.916.48.74.34.87.57.35.66.04.66.97.26.96.65.16.44.6-2.57.37.46.6-0.99.26.96.66.14.24.46.57.66.4-4.11.67.88.89.87.66.66.89.27.57.811.324.38.816.95.85.98.55.07.55.15.34.66.76.99.86.33.86.25.122.46.87.56.4EconomicPerformancebyDistrict,199913with oiland gaswithoutoil andgaswith oilandgaswithoutoilandgas1995 19951996 19961997 19971998 19981,5091,9641,6781,2771,1501,4431,9161,2971,7821,2451,8711,1872,1331,1641,5891,6411,4682,4602,8812,1261,4282,4411,4861,8662,6652,9342,7622,.2172,3221,3271,0281,1711,5721,3931,4381,5191,7459712,9801,9513,8562,0542,0991,7152,5481,9761.6781,2771,1501,5161,9161,2971,7821,2456,0281,1872,1331,1641,5891,6411,4682,4602,8812,1261,4282,4411,4862,0302,6652,9342,7622,2172,3221.3271,0281,1711,5721,3931,4381,5191,7459712,9801,9513,8562,0542,0991,715INDONESIAHUMAN DEVELOPMENT REPORT<strong>2001</strong>132
14.Riau15.Jambi16.South Sumatera17.Bengkulu18.Lampung31.Jakarta01.Indragiri Hulu02.Indragiri Ilir03.Kepulauan Riau04.Kampar05.Bengkalis71.Pekan Baru72.Batam01.Kerinci02.Bungo Tebo03.Sarolangun Bangko04.Batanghari05.Tanjung Jabung71.Jambi01.Ogan Komering Ulu02.Ogan Komering Hilir03.MuaraEnim(Liot)04.Lahat05.MusiRawas06.MusiBanyuasin07.Bangka08.Balitung71.Palembang72.Pangkal Pinang01.South Bengkulu02.Rejang Lebong03.North Bengkulu71.Bengkulu01.South Lampung02.Central Lampung03.North Lampung04.WestLampung71.Bandar Lampung71.South Jakarta72.EastJakarta73.Central Jakarta74.WestJakarta75.North Jakarta(continued)Real percapitaGRDPin 1998 a)Annual growth in real per capita GRDP(Thousand Rupiah) (%)5.35.97.01.78.07.35.56.14.34.94.8-3.2-1.56.74.73.85.99.24.96.67.09.07.75.05.96.25.66.913.36.76.3-5.9-0.711.28.46.97.94.19.36.111.45.36.88.36.07.43.76.17.76.57.19.75.55.64.19.48.15.84.75.18.44.95.88.38.96.66.95.711.48.36.57.13.56.72.70.96.86.25.06.64.710.35.911.66.07.76.51.33.51.12.83.54.95.36.94.12.97.75.33.01.4-0.31.52.41.21.43.43.01.78.01.16.04.54.16.72.73.40.1-2.12.33.60.6-3.83.64.00.26.55.04.5-2.0-9.0-8.3-4.4-9.5-19.5-5.60.1-1.3-3.8-0.3-7.2-4.3-5.5-9.5-10.7-8.3-8.2-9.7-7.9-4.1-3.5-3.7-6.8-9.2-6.5-5.4-14.8-3.3-1.6-1.3-4.3-10.4-7.1-6.2-9.01.4-18.0-21.3-17.7-7.6-25.9-23.7-5.3-5.7-6.9-4.4-9.5-19.5-9.30.1-14.0-36.04.8-7.2-4.3-5.5-9.5-8.4-8.86.1-10.3-7.4-4.1-1.7-3.7-4.7-5.8-6.5-5.4-13.7-3.3-1.6-1.3-4.3-10.4-7.1-6.2-9.01.4-18.0-21.3-17.7-7.6-25.9-23.70.81.82.41.12.83.54.35.32.5-0.3-2.17.75.33.01.4-0.31.54.61.31.33.41.21.75.6-1.06.04.53.16.72.73.40.1-2.12.33.60.6-3.83.64.00.26.55.04.53.86.46.63.76.17.76.17.15.52.42.04.19.48.15.84.76.28.46.05.68.36.56.65.84.311.48.36.07.13.56.72.70.96.86.25.06.64.710.35.911.66.07.70.55.75.21.78.07.312.16.12.70.5-0.5-3.2-1.56.74.73.85.09.24.96.47.04.77.7-2.02.96.25.66.113.36.76.3-5.9-0.711.28.46.97.94.19.36.111.45.36.82,0961,1681,4311,1589525,9431,3551,5962,2641,2371,5181,77811,6861,2438378529841,6561,5661,0141,1511,8831,1931,0701,2711,9411,9791,8241,4451,1401,4158661,3218129867446031,6834,9304,35915,8203,8717,2364,7731,2541,6921,1589525,9431,3711,5965,1822,4699,2621,77811,6861,2438378741,1041,9561,6491,0811,1512,9381,1931,3591,8681,9411,9792,0111,4451,1401,4158661,3218129867446031,6834,9304,35915,8203,8717,236with oiland gaswithoutoil andgaswith oilandgaswithoutoilandgas1995 19951996 19961997 19971998 1998ProvinceDistrictEconomicPerformancebyDistrict,199913HUMAN DEVELOPMENTINDICATORSAND INDICES 133
32.WestJava33.Central Java01.Pandeglang02.Lebak03.Bogor04.Sukabumi05.Cianjur06.Bandung07.Garut08.Tasikmalaya09.Ciamis10.Kuningan11.Cirebon12.Majalengka13.Sumedang14.Indramayu15.Subang16.Purwakarta17.Karawang18.Bekasi19.Tangerang20.Serang71.Bogor72.Sukabumi73.Bandung74.Cirebon75.Tangerang01.Cilacap02.Banyumas03.Purbalingga04.Banjarnegara05.Kebumen06.Purworejo07.Wonosobo08.Magelang09.Boyolali10.Klaten11.Sukoharjo12.Wonogiri13.Karanganyar14.Sragen15.Grobogan16.Blora17.Rembang18.Pati19.Kudus20.Jepara21.Demak22.Semarang23.Temanggung(continued)Real percapitaGRDPin 1998 a)Annual growth in real per capita GRDP(Thousand Rupiah) (%)8.27.95.27.05.25.95.79.36.16.86.95.96.75.06.36.46.46.27.28.73.55.363.243.88.41.312.04.37.811.36.45.96.619.75.26.47.218.37.16.26.93.04.04.44.27.16.66.625.95.513.17.15.45.88.37.66.19.66.17.36.16.76.210.87.16.37.16.58.160.65.36.88.96.46.78.012.111.83.86.26.25.66.99.85.95.96.48.07.06.66.82.31.72.7-0.36.05.85.715.05.33.21.52.22.31.72.22.94.12.42.73.03.22.24.72.51.43.11.13.61.20.82.54.22.42.37.45.9-10.12.9-1.7-0.32.11.9-1.40.61.52.01.41.92.61.8-3.41.63.03.2-1.82.83.12.97.0-17.8-9.5-26.5-20.2-23.0-11.7-6.6-19.6-12.3-9.0-9.9-5.8-21.8-10.7-12.1-11.0-8.8-12.6-19.6-25.0-13.6-15.4-28.0-31.1-21.8-6.8-20.66.3-7.5-6.0-5.2-14.1-7.0-10.1-3.7-10.0-12.0-12.5-5.4-11.4-10.3-10.70.9-12.3-4.7-13.0-1.4-12.1-18.5-11.3-17.2-8.4-26.5-20.2-23.0-11.7-6.6-19.6-12.3-9.0-9.9-5.8-21.8-10.7-12.1-5.9-8.8-12.6-19.6-25.0-13.6-15.4-28.0-31.1-21.8-6.8-20.610.7-7.5-6.0-5.2-14.1-7.0-10.1-3.7-10.0-12.0-12.5-5.4-11.4-10.3-10.7-6.2-12.3-4.7-13.0-1.4-12.1-18.5-11.32.41.82.22.31.72.22.94.12.42.73.03.22.24.72.5-7.13.11.13.61.20.82.54.22.42.37.45.9-4.22.9-1.7-0.32.11.9-1.40.61.52.01.41.92.61.8-3.42.13.03.2-1.82.83.12.97.014.36.55.45.88.37.66.19.66.17.36.16.76.210.87.130.67.16.58.160.65.36.88.96.46.78.012.15.13.86.26.25.66.99.85.95.96.48.07.06.66.82.32.92.7-0.36.05.85.715.05.37.57.35.27.05.25.95.79.36.16.86.95.96.75.06.3-1.06.46.27.28.73.55.363.243.88.41.312.01.97.811.36.45.96.619.75.26.47.218.37.16.26.93.04.34.44.27.16.66.625.95.51,5331,2048458161,1059681,0791,8391,0891,0441,2299477899511,1351,0051,2601,4191,4582,5001,3842,8112,6982,8712,0813,0644,1062,2186977681,0097419137379531,0041,0251,4387471,4827715658518268344,3061,0237541,1871,0151,6161,2828458161,1059681,0791,8391,0891,0441,2299477899511,1353,2491,2601,4191,4582,5001,3842,8112,6982,8712,0813,0644,1063,7336977681,0097419137379531,0041,0251,4387471,4827715658518268344,3061,0237541,1871,015with oiland gaswithoutoil andgaswith oilandgaswithoutoilandgas1995 19951996 19961997 19971998 1998ProvinceDistrictEconomicPerformancebyDistrict,199913INDONESIAHUMAN DEVELOPMENT REPORT<strong>2001</strong>134
24.Kendal25.Batang26.Pekalongan27.Pemalang28.Tegal29.Brebes71.Magelang72.Surakarta73.Salatiga74.Semarang75.Pekalongan76.Tegal01.Kulon Progo02.Bantul03.GunungKidul04.Sleman71.Yogyakarta01.Pacitan02.Ponorogo03.Trenggalek04.Tulungagung05.Blitar06.Kediri07.Malang08.Lumajang09.Jember10.Banyuwangi11.Bondowoso12.Situbondo13.Probolinggo14.Pasuruan15.Sidoarjo16.Mojokerto17.Jombang18.Nganjuk19.Madiun20.Magetan21.Ngawi22.Bojonegoro23.Tuban24.Lamongan25.Gresik26.Bangkalan27.Sampang28.Pamekasan29.Sumenep71.Kediri72.Blitar73.Malang34.Yogyakarta35.East Java(continued)Real percapitaGRDPin 1998 a)Annual growth in real per capita GRDP(Thousand Rupiah) (%)5.56.26.55.84.95.06.818.06.39.87.52.4-6.07.08.77.59.316.26.45.07.58.36.63.05.88.30.17.26.96.65.25.25.95.61.31.15.65.56.26.72.37.64.94.15.4-8.812.310.06.86.67.25.26.15.95.55.54.68.58.25.910.81.52.64.15.36.86.37.45.26.35.111.36.06.25.96.68.25.56.46.36.75.65.96.05.111.05.15.86.66.27.16.19.45.73.95.14.412.110.56.76.47.93.22.12.93.34.43.62.63.32.57.8-2.5-1.82.61.73.61.73.13.33.75.04.43.84.03.64.64.16.02.64.12.84.12.03.83.3-1.13.24.13.64.37.44.05.53.91.82.83.610.72.53.02.65.0-12.9-10.9-9.5-0.8-8.40.5-7.8-14.7-2.6-19.6-13.3-11.0-15.2-13.8-7.4-9.6-12.6-6.6-7.8-8.8-7.0-0.4-0.7-7.6-10.9-7.9-6.6-15.3-5.7-9.9-14.8-18.3-9.1-13.5-1.2-6.7-8.2-6.5-6.0-10.6-5.7-12.8-0.8-13.5-14.6-10.8-3.4-4.4-11.3-11.2-10.7-12.9-10.9-9.5-0.8-8.40.5-7.8-14.7-2.6-19.6-13.3-11.0-15.2-13.8-7.4-9.6-12.6-6.6-7.8-8.8-7.0-0.4-0.7-7.6-10.9-7.9-6.6-15.3-5.7-9.9-14.8-18.3-9.1-13.5-1.2-6.7-8.2-6.5-6.0-10.6-5.7-12.8-0.8-13.5-14.6-1.7-3.4-4.4-11.3-11.2-10.63.22.12.93.34.43.62.63.32.57.8-2.5-1.82.61.73.61.73.13.33.75.04.43.84.03.64.64.16.02.64.12.84.12.03.83.3-1.13.24.13.64.37.44.05.53.91.82.813.110.72.53.02.65.15.26.15.95.55.54.68.58.25.910.81.52.64.15.36.86.37.45.26.35.111.36.06.25.96.68.25.56.46.36.75.65.96.05.111.05.15.86.66.27.16.19.45.73.95.1-4.312.110.56.76.47.85.56.26.55.84.95.06.818.06.39.87.52.4-6.07.08.77.59.316.26.45.07.58.36.63.05.88.30.17.26.96.65.25.25.95.61.31.15.65.56.26.72.37.64.94.15.4-8.212.310.06.86.67.21,6801,1041,1028576517372,3612,3242,2783,3331,0439391,1991,0601,2851,6092,9456557567351,1369961,0051,0989569831,0877341,3821,3271,0392,4821,4169461,1278489458188351,0338933,28794768065386721,3571,3092,8511,5541,6251,6801,1041,1028576517372,3612,3242,2783,3331,0439391,1991,0601,2851,6092,9456557567351,1369961,0051,0989569831,0877341,3821,3271,0392,4821,4169461,1278489458188351,0338933,28794768065397821,3571,3092,8511,5541,628with oiland gaswithoutoil andgaswith oilandgaswithoutoilandgas1995 19951996 19961997 19971998 1998ProvinceDistrictEconomicPerformancebyDistrict,199913HUMAN DEVELOPMENTINDICATORSAND INDICES 135
74.Probolinggo75.Pasuruan76.Mojokerto77.Madiun78.Surabaya01.Jembrana02.Tabanan03.Badung04.Gianyar05.Klungkung06.Bangli07.Karangasem08.Buleleng71.Denpasar01.WestLombok02.Central Lombok03.EastLombok04.Sumbawa05.Dompu06.Bima71.Mataram01.WestSumba02.EastSumba03.Kupang04.Southern Central-Timor05.Northern Central-Timor06.Belu07.Alor08.FloresTimur09.Sikka10.Ende11.Ngada12.Manggarai01.Sambas02.Pontianak03.Sanggau04.Ketapang05.Sintang06.Kapuas Hulu71.Pontianak51.Bali52.WestNusaTenggara53.East NusaTenggara61.WestKalimantan(continued)Real percapitaGRDPin 1998 a)Annual growth in real per capita GRDP(Thousand Rupiah) (%)6.15.88.07.39.66.36.96.77.87.36.76.57.16.75.76.67.07.23.44.68.80.24.410.54.21.07.89.312.16.65.38.63.00.07.07.19.67.87.58.46.67.26.46.87.35.65.75.67.48.66.56.56.27.36.66.36.36.66.44.76.56.76.43.95.88.32.75.98.12.05.05.85.18.17.96.43.34.30.08.49.011.58.08.97.27.86.86.26.08.61.03.32.26.15.03.84.13.85.24.53.44.04.73.82.82.24.14.91.52.95.10.51.51.78.25.37.12.52.88.45.45.33.10.03.34.28.55.54.24.54.94.43.63.84.8-8.0-7.3-5.8-5.9-17.4-4.9-4.8-7.4-3.4-3.4-3.2-3.4-3.8-7.6-7.6-2.9-4.1-2.4-2.6-4.4-4.80.9-7.0-8.3-10.50.8-7.2-15.6-7.4-4.1-10.9-4.2-5.40.0-0.1-7.0-0.8-4.6-5.5-0.1-3.0-5.2-4.3-6.9-3.8-8.0-7.3-5.8-5.9-17.4-4.9-4.8-7.4-3.4-3.4-3.2-3.4-3.8-7.6-7.6-2.9-4.1-2.4-2.6-4.4-4.80.9-7.0-8.3-10.50.8-7.2-15.6-7.4-4.1-10.9-4.2-5.40.0-0.1-7.0-0.8-4.6-5.5-0.1-3.0-5.2-4.3-6.9-3.81.03.32.26.15.03.84.13.85.24.53.44.04.73.82.82.24.14.91.52.95.10.51.51.78.25.37.12.52.88.45.45.33.10.03.34.28.55.54.24.54.94.43.63.84.85.65.75.67.48.66.56.56.27.36.66.36.36.66.44.76.56.76.43.95.88.32.75.98.12.05.05.85.18.17.96.43.34.30.08.49.011.58.08.97.27.86.86.26.08.66.15.88.07.39.66.36.96.77.87.36.76.57.16.75.76.67.07.23.44.68.80.24.410.54.21.07.89.312.16.65.38.63.00.07.07.19.67.87.58.46.67.26.46.87.32,1171,5551,9851,6354,6452,1321,9565,2442,3622,2981,9211,4561,5743,0217946616991,2129799601,1455018991,2174976816396055756967436825191,2242,2081,4861,7189751,5154,0352,4318527121,8712,1171,5551,9851,6354,6452,1321,9565,2442,3622,2981,9211,4561,5743,0217946616991,2129799601,1455018991,2174976816396055756967436825191,2242,2081,4861,7189751,5154,0352,4318527121,871with oiland gaswithoutoil andgaswith oilandgaswithoutoilandgas1995 19951996 19961997 19971998 1998ProvinceDistrictEconomicPerformancebyDistrict,199913INDONESIAHUMAN DEVELOPMENT REPORT<strong>2001</strong>136
62.Central Kalimantan63.South Kalimantan64.East Kalimantan71.North Sulawesi72.Central Sulawesi73.South Sulawesi01.WestKotawaringin02.EastKotawaringin03.Kapuas04.South Barito05.North Barito71.PalangkaRaya01.Tanah Laut02.Kota Baru03.Banjar04.Barito Kuala05.Tapin06.South Hulu Sungai07.Central Hulu Sungai08.North Hulu Sungai09.Tabalong71.Banjarmasin01.Pasir02.Kutai03.Berau04.Bulongan71.Balikpapan72.Samarinda01.Gorontalo02.Bolaang Mongondow03.Minahasa04.Sangihe Talaud71.Gorontalo72.Manado73.Bitung01.Luwuk Banggai02.Poso03.Donggala04.BualToli-Toli71.Kodya Palu01.Selayar02.Bulukumba03.Bantaeng04.Jeneponto05.Takalar(continued)Real percapitaGRDPin 1998 a)Annual growth in real per capita GRDP(Thousand Rupiah) (%)6.97.59.78.85.56.84.96.65.66.815.91.73.65.58.75.86.46.36.112.215.77.47.812.429.91.519.51.410.35.19.09.09.96.713.85.36.95.25.15.27.58.36.114.06.08.78.89.110.05.67.16.09.48.79.016.4-0.65.410.07.33.27.36.37.519.413.87.86.212.611.66.910.83.58.36.114.69.97.96.813.46.57.75.45.80.711.18.76.810.95.25.02.03.13.21.33.03.24.34.76.67.45.8-2.6-1.31.81.63.13.11.50.38.55.22.23.0-1.95.36.11.83.21.75.83.53.6-1.06.72.74.5-1.62.00.65.2-3.70.35.24.8-6.5-6.2-1.3-1.5-6.0-5.7-7.5-7.1-7.8-5.4-6.4-1.7-16.53.3-6.1-9.2-2.5-4.8-18.1-7.814.4-13.8-2.9-2.215.0-1.5-3.8-0.4-3.7-9.21.91.91.0-3.22.9-6.3-3.7-5.2-6.7-9.2-1.8-1.30.4-7.8-5.1-6.5-5.30.3-1.5-6.0-5.2-7.5-7.1-7.8-5.4-6.4-1.7-16.53.3-6.1-9.2-2.5-4.8-18.1-6.927.5-13.8-2.90.915.0-1.8-3.3-0.4-3.7-9.21.91.91.0-3.22.9-6.3-3.7-5.2-6.7-9.2-1.8-1.30.4-7.8-5.15.02.32.43.21.33.03.24.34.76.67.45.8-2.6-1.31.81.63.13.11.50.813.25.22.23.1-1.95.90.41.83.21.75.83.53.6-1.06.72.74.5-1.62.00.65.2-3.70.35.24.88.78.87.510.05.67.16.09.48.79.016.4-0.65.410.07.33.27.36.37.519.212.47.86.27.411.67.710.93.58.36.114.69.97.96.813.46.57.75.45.80.711.18.76.810.95.26.97.52.28.85.56.84.96.65.66.815.91.73.65.58.75.86.46.36.112.114.57.47.83.529.9-4.8-2.31.410.35.19.09.09.96.713.85.36.95.25.15.27.58.36.114.06.02,3501,9434,5021,4341,0701,2013,1712,4061,5612,3133,6502,2981,4113,3851,5132,4991,4251,2988741,6181,7102,2222,8415,5537,2123,7673,6614,4961,0681,0381,6341,0851,3521,9392,9181,0031,1609339911,5071,0559308566789212,3501,9758,4011,4341,0701,2073,1712,4061,5612,3133,6502,2981,4113,3851,5132,4991,4251,2988741,6522,2302,2222,84114,8127,2124,1878,0594,4961,0681,0381,6341,0851,3521,9392,9181,0031,1609339911,5071,055930856678921with oiland gaswithoutoil andgaswith oilandgaswithoutoilandgas1995 19951996 19961997 19971998 1998ProvinceDistrictEconomicPerformancebyDistrict,199913HUMAN DEVELOPMENTINDICATORSAND INDICES 137
13 EconomicPerformancebyDistrict,1999(continued)ProvinceDistrictReal percapitaGRDPin 1998 a)Annual growth in real per capita GRDP(Thousand Rupiah) (%)with oilandgaswithoutoilandgaswith oiland gaswithoutoil andgas1995 1996 1997 1998 1995 1996 1997 199806.Gowa07.Sinjai08.Maros09.Pangkep10.Barru11.Bone12.Soppeng13.Wajo14.Sidenreng Rappang15.Pinrang16.Enrekang17.Luwu18.TanaToraja19.Polewali Mamasa20.Majene21.Mamuju71.UjungPandang72.Pare Pare9429141,1581,4239871,2571,0321,4041,0971,2457681,0387548461,1927172,2461,3279429141,1581,4239871,2571,0321,2871,0971,2457681,0387548461,1927172,2461,3275.87.13.44.74.46.18.87.08.57.25.35.88.46.71.83.37.09.15.15.84.55.25.25.99.09.56.56.05.36.18.27.19.96.07.76.94.51.93.210.74.32.10.1-7.03.01.73.2-1.03.86.83.93.84.86.7-5.3-4.7-6.7-7.6-4.6-5.7-4.86.8-9.0-3.2-3.9-4.0-0.9-4.2-8.1-6.1-8.4-5.75.87.13.44.74.46.18.87.08.57.25.35.88.46.71.83.37.09.15.15.84.55.25.25.99.09.56.56.05.36.18.27.19.96.07.76.94.51.93.210.74.32.10.1-7.03.01.73.2-1.03.86.83.93.84.86.7-5.3-4.7-6.7-7.6-4.6-5.7-4.8-2.1-9.0-3.2-3.9-4.0-0.9-4.2-8.1-6.1-8.4-5.774.South-east Sulawesi9079074.03.63.0-7.84.03.63.0-7.801.Buton02.Muna03.Kendari04.Kolaka7698298841,1937698298841,1931.16.60.99.54.35.15.6-1.52.21.33.92.6-10.5-6.2-8.2-6.31.16.60.99.54.35.15.6-1.52.21.33.92.6-10.5-6.2-8.2-6.381.Maluku1,3391,3334.15.51.9-6.24.15.52.0-6.201.South-eastMaluku02.Central Maluku03.North Maluku04.Central Halmahera71.Ambon9871,0621,1921,4672,4999871,0421,1921,4672,49910.90.92.21.47.26.85.22.16.48.2-9.23.12.54.94.1-5.0-6.2-6.6-7.5-6.210.90.72.21.47.26.85.22.16.48.2-9.23.42.54.94.1-5.0-6.2-6.6-7.5-6.282.IrianJaya4,0743,94816.210.14.813.018.510.95.013.201.Merauke02.Jaya Wijaya03.Jaya Pura04.Paniai05.Fak Fak06.Sorong07.Manokwari08.Yapen Waropen09.Biak Numfor71.Jaya Pura1,1485641,7621,47044,6333,9361,9601,7472,1702,4251,1485641,7621,47044,6332,8991,9601,7472,1702,4255.34.12.06.034.7-5.63.94.65.03.314.25.05.16.314.90.85.07.26.34.32.41.70.923.31.121.03.14.82.30.7-13.2-4.7-11.2-3.731.70.6-13.1-12.9-3.5-12.55.34.12.06.034.74.13.94.65.03.314.25.05.16.314.95.25.07.26.34.32.41.70.923.31.130.23.14.82.30.7-13.2-4.7-11.2-3.731.7-1.4-13.1-12.9-3.5-12.5Note:a) Basedon 1993pricesThe number before each districtisthe official area code.Districtrefers to both regencyand City.Source: BPS special tabulation138INDONESIAHUMAN DEVELOPMENT REPORT<strong>2001</strong>
ProvinceDistrict11.Aceh12.North Sumatera13.WestSumatera01.SouthAceh02.South-eastAceh03.EastAceh04.CentralAceh05.WeastAceh06.Aceh Besar07.Pidie08.NorthAceh71.BandaAceh72.Sabang01.Nias02.SouthTapanuli03.Central Tapanuli04.NorthTapanuli05.Labuhan Batu06.Asahan07.Simalungun08.Dairi09.Karo10.DeliSerdang11.Langkat71.Sibolga72.Tanjung Balai73.Pematang Siantar74.TebingTinggi75.Medan76.Binjai01.South Pesisir02.Solok03.Sawah Lunto/Sijunjun04.Tanah Datar05.Padang Pariaman06.Agam07.Limapuluh Koto08.Pasaman71.Padang72.Solok73.Sawah Lunto74.Padang Panjang75.BukitTinggi76.PayakumbuhLabourforceparticipationrateEmployeeworkingPercapitaexpenditurePovertyOpenunemploymentEmploymentin informalsector(%) (%) (%)
14.Riau15.Jambi16.South Sumatera17.Bengkulu18.Lampung31.Jakarta01.Indragiri Hulu02.Indragiri Ilir03.Kepulauan Riau04.Kampar05.Bengkalis71.Pekan Baru72.Batam01.Kerinci02.Bungo Tebo03.Sarolangun Bangko04.Batanghari05.Tanjung Jabung71.Jambi01.Ogan Komering Ulu02.Ogan Komering Hilir03.MuaraEnim(Liot)04.Lahat05.MusiRawas06.MusiBanyuasin07.Bangka08.Balitung71.Palembang72.Pangkal Pinang01.South Bengkulu02.Rejang Lebong03.North Bengkulu71.Bengkulu01.South Lampung02.Central Lampung03.North Lampung04.WestLampung71.Bandar Lampung71.South Jakarta72.EastJakarta73.Central Jakarta74.WestJakarta75.North Jakarta(continued)LabourforceparticipationrateEmployeeworkingPercapitaexpenditurePovertyOpenunemploymentEmploymentin informalsector(%) (%) (%)
32.WestJava33.Central Java01.Pandeglang02.Lebak03.Bogor04.Sukabumi05.Cianjur06.Bandung07.Garut08.Tasikmalaya09.Ciamis10.Kuningan11.Cirebon12.Majalengka13.Sumedang14.Indramayu15.Subang16.Purwakarta17.Karawang18.Bekasi19.Tangerang20.Serang71.Bogor72.Sukabumi73.Bandung74.Cirebon75.Tangerang76.Bekasi01.Cilacap02.Banyumas03.Purbalingga04.Banjarnegara05.Kebumen06.Purworejo07.Wonosobo08.Magelang09.Boyolali10.Klaten11.Sukoharjo12.Wonogiri13.Karanganyar14.Sragen15.Grobogan16.Blora17.Rembang18.Pati19.Kudus20.Jepara21.Demak22.Semarang23.Temanggung(continued)LabourforceparticipationrateEmployeeworkingPercapitaexpenditurePovertyOpenunemploymentEmploymentin informalsector(%) (%) (%)
24.Kendal25.Batang26.Pekalongan27.Pemalang28.Tegal29.Brebes71.Magelang72.Surakarta73.Salatiga74.Semarang75.Pekalongan76.Tegal01.Kulon Progo02.Bantul03.GunungKidul04.Sleman71.Yogyakarta01.Pacitan02.Ponorogo03.Trenggalek04.Tulungagung05.Blitar06.Kediri07.Malang08.Lumajang09.Jember10.Banyuwangi11.Bondowoso12.Situbondo13.Probolinggo14.Pasuruan15.Sidoarjo16.Mojokerto17.Jombang18.Nganjuk19.Madiun20.Magetan21.Ngawi22.Bojonegoro23.Tuban24.Lamongan25.Gresik26.Bangkalan27.Sampang28.Pamekasan29.Sumenep71.Kediri72.Blitar73.Malang34.Yogyakarta35.East Java(continued)LabourforceparticipationrateEmployeeworkingPercapitaexpenditurePovertyOpenunemploymentEmploymentin informalsector(%) (%) (%)
74.Probolinggo75.Pasuruan76.Mojokerto77.Madiun78.Surabaya01.Jembrana02.Tabanan03.Badung04.Gianyar05.Klungkung06.Bangli07.Karangasem08.Buleleng71.Denpasar01.WestLombok02.Central Lombok03.EastLombok04.Sumbawa05.Dompu06.Bima71.Mataram01.WestSumba02.EastSumba03.Kupang04.Southern Central-Timor05.Northern Central-Timor06.Belu07.Alor08.FloresTimur09.Sikka10.Ende11.Ngada12.Manggarai71.Kupang01.Sambas02.Pontianak03.Sanggau04.Ketapang05.Sintang06.Kapuas Hulu71.Pontianak51.Bali52.WestNusaTenggara53.East NusaTenggara61.WestKalimantan(continued)LabourforceparticipationrateEmployeeworkingPercapitaexpenditurePovertyOpenunemploymentEmploymentin informalsector(%) (%) (%)
62.Central Kalimantan63.South Kalimantan64.East Kalimantan71.North Sulawesi72.Central Sulawesi73.South Sulawesi01.WestKotawaringin02.EastKotawaringin03.Kapuas04.South Barito05.North Barito71.PalangkaRaya01.Tanah Laut02.Kota Baru03.Banjar04.Barito Kuala05.Tapin06.South Hulu Sungai07.Central Hulu Sungai08.North Hulu Sungai09.Tabalong71.Banjarmasin01.Pasir02.Kutai03.Berau04.Bulongan71.Balikpapan72.Samarinda01.Gorontalo02.Bolaang Mongondow03.Minahasa04.Sangihe Talaud71.Gorontalo72.Manado73.Bitung01.Luwuk Banggai02.Poso03.Donggala04.BualToli-Toli71.Kodya Palu01.Selayar02.Bulukumba03.Bantaeng04.Jeneponto05.Takalar(continued)ProvinceRegency/CityLabourforceparticipationrateEmployeeworkingPercapitaexpenditurePovertyOpenunemploymentEmploymentin informalsector(%) (%) (%)
06.Gowa07.Sinjai08.Maros09.Pangkep10.Barru11.Bone12.Soppeng13.Wajo14.Sidenreng Rappang15.Pinrang16.Enrekang17.Luwu18.TanaToraja19.Polewali Mamasa20.Majene21.Mamuju71.UjungPandang72.Pare Pare01.Buton02.Muna03.Kendari04.Kolaka71.Kendari01.South-eastMaluku02.Central Maluku03.North Maluku04.Central Halmahera71.Ambon01.Merauke02.Jaya Wijaya03.Jaya Pura04.Paniai05.Fak Fak06.Sorong07.Manokwari08.Yapen Waropen09.Biak Numfor71.Jaya Pura74.South-east Sulawesi81.Maluku82.IrianJaya(continued)ProvinceDistrictLabourforceparticipationrateEmployeeworkingPercapitaexpenditurePovertyOpenunemploymentEmploymentin informalsector(%) (%) (%)
146INDONESIAHUMAN DEVELOPMENT REPORT<strong>2001</strong>
TechnicalNotesCalculating the<strong>Human</strong> <strong>Development</strong>IndicesThe diagram here offers an overview of how the four human development indices used in the <strong>Indonesia</strong><strong>Human</strong><strong>Development</strong><strong>Report</strong>areconstructed,highlightingboththeirsimilaritiesandtheirdifferences. Adetailed explanationofthecomputationispresentedinthefollowingpages.HDIDIMENSIONAlongandhealthylifeKnowledgeAdecentstandardoflivingINDICATORLife expectancyatbirthAdult literacyrate (Lit)Lit indexMean years ofschooling (MYS)MYS IndexAdjusted realpercapitaexpenditure(PPPrupiah)DIMENSIONINDEXLife expectancyindexEducation indexIncome indexHUMANDEVELOPMENTINDEX(HDI)HPIDIMENSIONAlongandhealthylifeKnowledgeAdecentstandardoflivingINDICATORProbability at birthofnot surviving toage 40AdultilliteracyratePercentageofpopulationwithoutaccesstosafe waterPercentageofpopulationwithoutaccesstohealthfacilitiesPercentage ofundernourishedchildren underage fiveDeprivation in adecentstandardoflivingHUMANPOVERTYINDEX(HDI)fordevelopingcountriesGDIDIMENSIONINDICATORAlongandhealthylifeFemale lifeexpectancyatbirthMale lifeexpectancyatbirthFemaleadultliteracyrateKnowledgeFemaleMYSMaleadultliteracyrateMaleMYSAdecentstandardoflivingFemaleestimatedearnedincomeMaleestimatedearnedincomeDIMENTIONINDEXFemale lifeexpectancyindexMale lifeexpectancyindexFemale educationindexMale educationindexFemaleincomeindexMaleincomeindexEQUALLYDISTRIBUTEDINDEXEquallydistributedlife expectancyindexEqually distributed education indexGENDER RELATEDDEVELOPMENTINDEX(GDI)Equallydistributedincome indexGEIDIMENSIONPoliticalparticipationEconomicparticipationanddecisionmakingPowerovereconomicresourcesINDICATORFemale and male sharesofparliamentaryseatsFemale and male shared ofjobsassenior officials,managers,professional andtechnicalpositionsFemale andmale estimatedearned incomeEQUALLYDISTRIBUTEDEQUIVALENTPERCENTAGEEDEP forparliamentaryrepresentationEDEPfor participation anddecision makingGENDEREMPOWEREMENTMEASURE(GEM)EDEP for incomeHUMAN DEVELOPMENTINDICATORSAND INDICES 147
Computing the indicesThe <strong>Human</strong> <strong>Development</strong> Index (HDI)The HDI is based on three components: longevity, asmeasured by life expectancy at birth; educationalattainment, as measured by the combination of adultliteracy rate (two-thirds weight) and mean years ofschooling (one-third weight); and standard of living, asmeasured by adjusted per capita expenditure (PPP Rupiah).The index is defined as the simple average of the indicesof those three components:HDI = 1/3 (Index X1 + Index X2 + Index X3)Where X1, X2 and X3 are longevity, educational attainment andstandard of living respectively.For any component of the HDI, individual index canbe computed according to the general formula:Index X(i,j) = (X(i,j) - X(i-min)) / (X(i-max) - X(i-min))Where :X(i,j) : Indicator ith for region jX(i-min) : Minimum value of XiX(i-max) : Maximum value of XiLongevityLongevity is measured by using the indicator of lifeexpectancy at birth (e0). The e0 presented in this reportis based on the extrapolation of the e0 figure based onend-1996 and end-1999 situation as the correspondenceof the infant mortality rate (IMR) for the same period.For this publication, the estimation of IMR at provinciallevel is calculated based on data series from 1971 census,1980 census, 1990 census, and the pooled data of 1995survey between census (SUPAS) and 1996 socioeconomicsurvey (SUSENAS). The calculation methodfollows the indirect technique based on two basic data -i.e. the average number of live births and the averagenumber of children still living - reported from each fiveyearclass of mother ages between 15 - 49 years old. Byapplying this technique, there will be seven estimationpoints for each time reference from each data source.As a result there are 28 IMR estimations for all timereferences from which the estimation of IMR is calculated.It is done after the omission of any unreliable figuresreported by the eldest and the youngest maternal groups.Table 1Maximum and minimum value of each HDI indicatorHDI Maximum Minimum NotesComponent Value ValueLife Expectancy 85 25 <strong>UNDP</strong>StandardLiteracy Rate 100 0 <strong>UNDP</strong>StandardMean Years of 15 0 <strong>UNDP</strong> usesSchoolingcombinedgrossenrolmentratioPurchasing Power 737,720 a) 300,000 <strong>UNDP</strong> uses(1996) adjusted real360,000 per capita(1999) b) GNPNotes:a) Projection of the highest purchasing power for Jakarta in 2018(the end of the second long term development period) after adjustedwith Atkinson formula. This projection is based on the assumptionof 6.5 percent growth in purchasing power during the period of1993-2018.b) Equal to two times the poverty line of the province with thelowest per capita consumption in 1990 (rural area of South Sulawesi).For 1999, the minimum value was adjusted to Rp. 360,000. Thisadjustment is necessary, as the economic crisis has drasticallyreduced the purchasing power of the people. It is reflected by theincrease in poverty level and the decrease in the real wages. Theadditional Rp. 60,000 is based on the difference between the “oldpoverty line” and the “new poverty line” that is amounted toaround Rp. 5,000 per month (= Rp. 60,000 per year).The estimation of IMR at regency/city level is basedon the pooled data from SUPAS 1995 and SUSENAS 1996.This pooled data is considered to be a reliable data sourcebecause it covers around 416,000 households. Howeverthe indirect technique used in this estimation producesthe estimate of four years before the survey time. Tocalculate the estimate points for 1999, the estimate figurebased on the pooled SUPAS 1995 and SUSENAS 1996data is projected after taking into account the provincialtrend of the respected region and the inter regencies/citiesvariation within each respected province.Educational attainmentThe component of educational attainment in thispublication is measured by using two indicators – literacyrate and mean years of schooling. The literacy rate is148 INDONESIA HUMAN DEVELOPMENT REPORT <strong>2001</strong>
defined as the proportion of population aged 15 years andover who are able to read and write in Latin script or inother script as a percentage of this age group. Thisindicator is given a weight of two-thirds. Another onethirdweight is given to the indicator of mean years ofschooling that is defined as the average years of formalschooling attended among the population aged 15 yearsand over. This indicator is calculated based on the variablesof the current or achieved grade and the attainment ofeducation level in the SUSENAS core questionnaire. Table2 presents the conversion factor of the year of schoolingfor each level of education being completed. For someonewho has not completed a certain level of education ordrop out from school, the year of schooling (YS) iscalculated using the following formula:YS = Conversion years + the current/achieved grade-1For example, someone who drops out from the 2nd yearof Senior High School:YS = 9 + 2 - 1 = 10 (years)Table 2The conversion years for the highest level ofeducation being completedLevel of education completedStandard of livingConversion factor1. Never attend school 02. Primary School 63. Junior High School 94. Senior High School 125. Diploma I 136. Diploma II 147. Academy/Diploma III 158. Diploma IV/Sarjana 169. Master (S2) 1810. Ph D (S3) 21This report is using the adjusted real per capitaexpenditure as the proxy for standard of living. In orderto ensure inter-regional and time series comparability, thefollowing procedure is applied:1. Calculating the annual per capita expenditure fromSUSENAS module data [=Y];2. Mark up the Y with a factor of 20% [=Y1], as variousstudies suggested that the SUSENAS figure underestimatesby about 20%;3. Calculating the real Y1 by deflating Y1 with the consumerprice index (CPI) [=Y2];4. Calculating the Purchasing Power Parity (PPP) foreach region as the relative price of a certain bundle ofcommodities, with the prices in South Jakarta as thestandard;5. Dividing Y2 with PPP to obtained a standardized Rupiahvalue [=Y3];6. Discounting the Y3 using the Atkinson formula to getthe purchasing power estimate [=Y4]. This step isapplied to accommodate the rule of decreasing marginalutility.Consumer Price IndexIn <strong>Indonesia</strong>, the CPI figure is available only for 54cities. The calculation of purchasing power at regency/city level is using the CPI of the respected regency/citywhere the figure is available. For other than the 54 citieswhere the CPI data is available, the provincial CPI - i.e.the average of CPIs figure available in each province - isused.Purchasing Power ParityThe calculation of PPP basically applies the samemethod used by the International Comparison Project instandardizing GDP for international comparison. Thecalculation is based on prices and quantities of selectedcommodities basket (27 items) available in SUSENASconsumption module. The prices in South Jakarta areused as the basic price. The formula for PPP calculationis:PPP =∑ E (i,j)j∑ P (9,j) Q (i,j)jWhere:E(i,j): expenditure for commodity j in the province iP(9,j): the price of commodity j in South JakartaQ(i,j): volume of commodity j (unit) consumed in the province iThe housing unit is calculated based on the housingquality index that consists of seven housing qualitycomponents in SUSENAS module. The score of eachcomponent is:1) Floor: ceramic, marble, or granite =1, others = 02) Per capita floor width > 10 m 2 = 1, others= 03) Wall: cemented=1, others= 04) Roof: wood/single, cemented =1, others = 05) Lighting facility: electric=1, others= 06) Drinking water facility: piping=1, others= 07) Sanitation: private ownership=1, others= 08) Initial score for every house=1HUMAN DEVELOPMENT INDICATORS AND INDICES149
Calculating the HDIThis illustration of the calculation of HDI uses datafor Aceh Province in 1999Life expectancy 67.6Adult literacy rate (%) 93.1Mean years of schooling 7.2Adjusted real per capita expenditure(Thousand Rupiah) 562.8Life expectancy index(67.6-25) / (85-25) = 0.71 = 71%Adult literacy index(93.1-0) / (100-0) = 0.93 = 93%Mean years of schooling index(7.2-0) / (15-0) = 0.48 = 48%Educational attainment index(2/3 x 93) + (1/3 x48) = 0.78 = 78%Income index(562.8-360) / (732.72-300) = 0.469 = 47%<strong>Human</strong> development indexHDI = (71+78+47) / 3 = 65.3Reduction ShortfallThe housing quality index is the sum of all scores witha range of 1 to 8. The quality of house consumed by ahousehold is equal to the housing quality index divided by8. For example, if a house has a housing quality index of6, then the quality of house consumed by the householdis 6/8 or 0,75 unit.Atkinson FormulaThe Atkinson formula used to discounted the Y3 can bedefined as:C(I) * = C(i)if C(i) < Z= Z + 2(C(i) - Z) (1/2) if Z < C(i) < 2Z= Z +2(Z) (1/2) + 3(C(i) - 2Z) (1/3) if 2Z< C(i)
achievement of each region in life expectancy, educationalattainment and income in accordance with the disparityin achievement between women and men. The parameter∈ is incorporated into the equation to take into accountthe inequality aversion that reflects the marginal elasticityof social valuation toward a certain achievement acrossgender. To express a moderate aversion to inequality, theparameter ∈ is set equal to 2.To calculate GDI, one needs to first calculate the equallydistributed equivalent achievement [Xede] using thefollowing formula:Xede = (Pf Xf (1-∈) + Pm Xm (1-∈ ) ) 1/(1-∈)Where:Xf : female achievementXm : male achievementPf : proportion of female populationPm : proportion of male population∈ : inequality aversion parameter (=2)The calculation of income distribution component isfairly complex. Based on wage data collected in theNational Labor Force Survey (SAKERNAS) 1996 and1999, the calculation follows the steps below:1) Calculating the ratio between wage for female andwage for male in non-agriculture sector [W f];2) Calculating the average wage using the followingformula:W = (Aecf x Wf) + (Aecm x 1)Where:Aecf : proportion of women in the labour force (who areeconomically active)Aecm : proportion of male in the labour force (who areeconomically active)Wf : ratio of female’s wage in agriculture sector3) Calculating the ratio between each gender group fromthe average wage above [=R];4) Calculating the income contributed by each gendergroup [=IncC], where:IncC = Aec(f/m) x R(f/m)5) Calculating the proportion of income contributed byeach gender group [% IncC] using the following formula:%IncC = IncC(f/m) / P(f/m)6) Calculating the proportion of X edefrom the%IncC [=X ede(Inc)]7) Calculating the index of income distribution[= I Inc-dis]I Inc-dis = [(Xede(Inc) x PPP) - PPPmin] / [PPPmax - PPPmin]The calculation of GDI follows the steps below:1) Each index of the GDI component is computed usingthe formula described above with the maximum andminimum thresholds as stated in Table 4;2) Calculating the Xede from each index;3) Calculating the GDI using the following formula:GDI= 1/3 [(Xede(1) +Xede(2) + I Inc-dis]Where:Xede(1)Xede(2)I Inc-dis: Xede for life expectancy: Xede for education: Index of income distributionMost data for computing GDI are from the same sourceas the data for computing HDI. Only wage data forcomputing GDI and Gender Empowerment Measure(GEM) is from SAKERNAS (National Labour ForceSurvey) 1996 and 1999.The Gender Empowerment Measure (GEM)The GEM consists of three components: i.e.parliamentary representation, decision-making and incomedistribution. In calculating GEM one should first calculatethe EDEP (the index of each component based on ‘EquallyDistributed Equivalent Percentage’). The calculation ofincome share for GEM is the same as the calculation ofincome share for GDI calculation described above. Then,the index of each component is the EDEP of eachcomponent divided by 50. 50 is considered to be an idealshare of each gender group for all GEM components.The decision making component consist of twoindicators: managerial and administration job, andprofessional and technical staff. For national figure, theindex of decision-making is the average of the indices ofthese two indicators. This combination is necessary toavoid any misperceptions of the respondents in choosingbetween these two occupational categories. Data forHUMAN DEVELOPMENT INDICATORS AND INDICES151
Calculating the GDIAs an example, the calculation of GDI for theprovince of Aceh 1996 is as follow:Component Female MaleProportion of population 0.499 0.501Life expectancy 69.6 65.6Literacy rate (%) 90.1 96.2Mean years of schooling (MYS) 6.8 7.7Percentage of the economicallyactive population(Proportion of Labor Force) 38.4 61.6Non-agricultural wage 271.929 383.423PPP (Rp 000) 562.8Calculating life expectancy and educational indicesLife expectancy index:• Female : (69.6 - 27.5) / (87.5 - 27.5) = 0.70• Male : (65.6 - 22.5) / (82.5 - 22.5) = 0.72If ∈ = 2. then:Xede (1) = [((0.499) (0.70) -1 ) + ((0.501) (0.72) -1 )] -1 = 0.71Literacy rate index:• Female : (90.1 - 0) / (100-0) = 0.901• Male : (96.2 - 0) / (100-0) = 0.962Mean years of schooling index:• Female : (6.8 - 0) / (15-0) = 0.453• Male : (7.7 - 0) / (15-0) = 0.513Educational attainment index:• Female : 2/3 (0.901) + 1/3 (0.453) = 0.75• Male : 2/3 (0.962) + 1/3 (0.513) = 0.81If ∈ = 2. then:Xede (2) = [(0.499) (0.75) -1 + (0.501) (0.81) -1 ] -1 = 0.78Calculating income distribution index Ratio to malenon-agricultural wage:• Female : 271.929/383.423 = 0.709• Male : 1Average wage: (0.384 x 0.709) + (0.616 x 1) = 0.888Ratio to average wage:Female : 0.709 / 0.888 = 0.798Male : 1 / 0.888 = 1.126Share of earned incomeFemale : 0.798 x 0.384 = 0.307Male : 1.126 x 0.616 = 0.693Proportional income sharesFemale : 0.307 / 0.499 = 0.614Male : 0.694 / 0.501 = 1.384If ∈ = 2. then:Xede (Inc) = [(0.499) (0.614) -1 + (0.501)(1.384) -1 ] -1 = 0.85The income distribution index (I Inc-dis) isI Inc-dis = [(0.85 x 562.8) - 360] / [737.72 - 300] = 0.276Gender <strong>Development</strong> IndexGDI = (0.71 + 0.78 + 0.276) / 3 = 0.59 = 59%Calculating the GEMUsing the case of Aceh province in 1999, thecalculation of GEM is as follows:Component Female MaleProportion of population 0.499 0.501Parliamentary Representation (%) 8.3 91.7Proportion of manager,administration staff, professionaland technical staff (%) 54.4 45.6Percentage of the economicallyactive population (Proportion ofLabor Force) 38.4 61.6Percentage of the economicallyactive population(Proportion of Labor Force) 38.4 61.6Non-agricultural wage 271.929 383.423PPP (Rp 000) 562.8Calculating the parliamentary representation indexand decision-making index with ∈ = 2Parliamentary representation index (Ipar)EDEP (par) = [0.499)(8.3) -1 + (0.501)(91.7) -1 ] -1 = 15.25Ipar = 15.25 / 50 = 0.3Decision-making index (IDM)EDEP (DM) = [0.499)(54.4) -1 + (0.500)(45.6) -1 ] -1 = 49.61IDM = 49.61/50 = 0.99Calculating income distribution indexFollowing the calculation of income distributionindex for GDI above, the IInc-dis = 0.27Gender empowerment measure:GEM = 1/3 (Ipar + IDM + IInc-dis)= (0.3 + 0.99 + 0.27) / 3 = 52.4decision-making component is from SUSENAS 1996 and1999. Data for parliamentary representation is from“Lembaga Pemilihan Umum” (General Election Institute)and the parliaments at provincial and regency/city level.The GEM is calculated as:GEM = 1/3 [Ipar + IDM + IInc-dis]Where:Ipar : Parliamentary representation indexIDM : Decision making indexIInc-dis : Income distribution indexThe <strong>Human</strong> Poverty Index (HPI)The HPI combines several dimensions of humanpoverty that are considered as the most basic indicatorsof human deprivation. It consists of three indicators:people expected not having a long live, deprivation oneducational attainment and inadequacy in access to basic152 INDONESIA HUMAN DEVELOPMENT REPORT <strong>2001</strong>
services. The first indicator is measured by the probabilityof the population not expected to survive to age 40 (P 1).The calculation of this indicator follows the method ofcalculating life expectancy for HDI measurement. Thesecond indicator is measured by adult illiteracy rate (P 2).This is calculated based on SUPAS 1995 and SUSENAS1996 data and covers population age 15 and above. Whilethe limitation on access to basic services (P 3) consists ofthe following variables:• Percentage of population without access to clean water(=P 31). P 31is defined as the percentage of householdusing water source other tap water, water pumpand wheel that is located 10 meters or more from sewagedisposal. This data is collected from SUPAS 1995and SUSENAS 1998.• Percentage of population without access to health services(=P 32). P 32is defined as the percentage of populationlives in the location 5 km or more from healthfacilities. The data source is the same as above.• Percentage of children under five years old with lownutritional status (=P 33). P 33is defined as the percentageof children less than five years old belong to thecategory of low and medium nutritional status.Calculating the HPIFor this publication, the calculation of HPI followsthe HDR 1997 published by <strong>UNDP</strong>:HPI = [1/3 (P1 3 + P2 3 + P3 3 )] 1/3Where P3 = 1/3 (P31+ P32 + P33)Procedures for estimating time required toreach particular targetsThe time required to reach particular targets in severalhuman development indicators, as presented in this report,is estimated by assuming that the past speed ofimprovement in those indicators as being constant in thefuture. The speed of improvement here indicates theabsolute changes, as referred to a simple average of annualincrease (or decline), expressed in years. By comparingdata in 1990 (I90), 1993 (I93), 1996 (I96) and 1999 (I99),thus, the annual speed of improvement (s) is given as:s = [(I93 - I90)/3 + (I96 - I93)/3 + (I99 - I96)/3]/3Then, the estimated time (T) to reach particular target orgoal in human development indicators (G) can be simplycalculated as follows:T = (G - I99)/sAs an illustration, the following equation shows thecalculation of HDI for Aceh province in 1999:Probability of people not expectedto survive to age 40 - P1 (%) 12.7Adult illiteracy rate -P2 (%) 6.9Population without access tosafe water - P31 (%) 61.5Population without access tohealth services -P32 (%) 37.6Undernourished children under age 5 - P33 35.6The composite of deprivation variablesP3 = 1/3 (61.5+37.6+35.6) = 44.9<strong>Human</strong> poverty indexHPI = [1/3 (12.7 3 + 6.9 3 + 44.9 3 )] 1/3 = 31.4HUMAN DEVELOPMENT INDICATORS AND INDICES153
Definitions of Statistical TermsAccess to health facilities: the percentage of householdswhose place of residence is less than five kilometres from ahealth facility (hospital, clinic, community health centre,doctor, nurse, trained midwife, paramedic, etc.).Access to sanitation: the percentage of households who haveeither their own private toilet or access to public toilet facilities.Access to safe water: the percentage of households whoconsume mineral water, tap water, or water from water pumps,protected wheels, or protected springs.Average duration of illness: the average number of days ofillness of those who are sick.Births attended by modern health personnel : the percentageof children aged 0-4 whose birth was attended by modernmedical personnel (doctor, nurse, trained midwife, paramedic,etc.).Consumer price index (CPI): an index that indicates a relativecomparison between price level in the month of survey andprice level in the previous month, weighted by values ofconsumption in both months. CPI is calculated using amodified Laspeyres formula.Economic growth: the relative change in the real value ofgross domestic product over a certain time period.Education index: one of the three components of the humandevelopment index. This is based on the enrolment ratio andthe adult literacy rate. The index value is between 0 and 100.For details on how the index is calculated, see the technicalnote.Enrolment. The gross enrolment ratio is the number ofstudents enrolled at a given level of education, regardless ofage, as a percentage of the official school-age population forthat level. The net enrolment ratio is the number of childrenof official school-age enrolled in school as a percentage ofthe number of children of the official school-age population.The official school ages in <strong>Indonesia</strong> are 7-12 for primaryschool, 13-15 for junior high school, 16-18 for senior highschool, and 19-24 for tertiary education.Expenditure on food: the proportion of total expenditure usedto buy food.Gender empowerment measure (GEM): a composite indexusing variables constructed to measure the decision-makingpower of women in political and economic activities. TheGEM is based on three indicators: the percentage of thoseelected to parliament who are women, the percentage ofprofessionals, technicians, senior officials and managers whoare women, and women’s share of earned income. The indexvalue is between 0 and 100.Gender-related development index (GDI): a composite indexusing variables constructed to measure human developmentachievement taking into account gender disparity. The GDIcomponents are the same as the HDI components but adjustedto capture the disparity in achievement between men andwomen. The index value is between 0 and 100.Gross domestic product: the total amount of gross valueadded(total output of goods and services) produced by alleconomic sectors in a country during a certain period of time.Gross domestic product at constant prices: a calculation ofgross domestic product using on prices in a specific baseyear.Gross domestic product at current prices: the gross domesticproduct presented in current prices for the relevant year.Gross domestic product per capita: the value of gross domesticproduct divided by total mid-year population.Households with earth/dirt-floor house : the percentage ofhouseholds whose houses have mainly earth or dirt floors.<strong>Human</strong> development index (HDI) : a composite index basedon three indicators: longevity, as measured by life expectancyat birth; educational attainment, as measured by a combinationof adult literacy and mean years of schooling; and standardof living, as measured by per capita expenditure (PPP Rupiah).The index value is between 0 and 100.<strong>Human</strong> poverty index (HPI): a composite index that measuresdeprivations in three dimensions: longevity, knowledge andstandard of living.Illiteracy rate (adult): the proportion of adults who cannotread or write in Latin script or other scripts.Infant mortality rate (IMR) : the number of infants who diebefore reaching one year of age per 1,000 live births.154 INDONESIA HUMAN DEVELOPMENT REPORT <strong>2001</strong>
Labour force: the working age population (15 and over) whoare employed or looking for employment.Labour force participation rate: the proportion of the workingagepopulation who are in the labour force.Life expectancy at birth : the average number of years thatnewly-born infants would live if the mortality patterns at thetime of birth prevailed throughout the children’s lives.Life expectancy index: one of the three components of thehuman development index. The value of this index is between0 and 100. A detailed explanation on how to calculate thisindex is presented in the technical note.Literacy rate (adult): the percentage of people aged 15 yearsor over who can read and write in Latin script or other scripts.Mean years of schooling: the estimated average (mean) yearsof completed schooling for the total population aged 15 orover who have any status of educational attainment. For adetailed explanation see the technical note.Morbidity rate: the proportion of the population who sufferedfrom health problems that disturbed their daily activities overthe previous month.Non-agricultural wages: the average remuneration receivedby workers (labourers or official employees) in the nonagriculturalsector.Open unemployment: the proportion of the labour force whoare seeking employment.Poor people: the population with a monthly per capitaexpenditure less than a certain threshold referred to as the‘poverty line’.Population not expected to survive to age 40: the estimatedproportion of population that will die before reaching the ageof 40.Population with health problems: the proportion of thepopulation that has had one or more health problems duringthe previous month.Poverty line: the <strong>Indonesia</strong>n rupiah value of the monthly percapita expenditure required to fulfil a minimum standard offood and non-food basic consumption.Professionals, technical workers, senior officials andmanagers: defined according to “Klasifikasi Baku Jabatan<strong>Indonesia</strong> (KBJI)”.Purchasing power parity (PPP): PPP rates allow a standardcomparison of real price levels between provinces anddistricts, otherwise normal exchange rates may over- or undervaluepurchasing power as measured by adjusted real percapita consumption. At the PPP rate in the <strong>Indonesia</strong>n context,one rupiah has the same purchasing power in each provinceas it has in Jakarta. The PPP is based on real per capitaexpenditure after adjusting for the consumer price index anddecreasing marginal utility using Atkinson’s formula.Purchasing power index: one of three components of thehuman development index based on purchasing power parity(PPP) adjusted by Atkinson’s formula. The index value isbetween 0 and 100. For details on how the index is calculated,see the technical note.Self-medication: household efforts at self treatment for healthproblems using modern or traditional medicines, massage, orother traditional treatments.School drop-out rate: the proportion of the population aged7-15 who are not enrolled in education at any level and havenot completed primary or junior high school.School participation rate: the proportion of the population ina certain age group (7-12, 13-15, 16-18, and 19-24) who areattending school.Total consumption: consumption of goods and servicesregardless of origin. This includes gifts and the household’sown production. In this publication, total consumption refersto monthly consumption.Underemployment: the proportion of the totallabour force working fewer than normal working hours.Undernourished children under five: also referred to aschildren underweight (suffering from moderate and severemalnutrition). Moderate malnutrition refers to the percentageof children under five who are below minus two standarddeviations from the median weight for the age of the referencepopulation. Severe malnutrition refers to the percentage ofchildren under five who are below minus three standarddeviations from the median weight for the age of the referencepopulation.Women’s share of the labour force: the number of workingwomen as a proportion of the total working age population(aged 15 and over).Women’s income share: the income contributed by women asa proportion of the total income of the population. For adetailed explanation on how to calculate this, see the technicalnote.Women’s representation in parliament: the proportion ofparliamentary seats that are held by women.Workers in the informal sector: the percentage of the labourforce who are individual entrepreneurs, are working with theassistance of family members, or are paid or unpaid familyworkers.HUMAN DEVELOPMENT INDICATORS AND INDICES155
156 INDONESIA HUMAN DEVELOPMENT REPORT <strong>2001</strong>


