continued - St James's Place
continued - St James's Place
continued - St James's Place
- No tags were found...

Create successful ePaper yourself
Turn your PDF publications into a flip-book with our unique Google optimized e-Paper software.
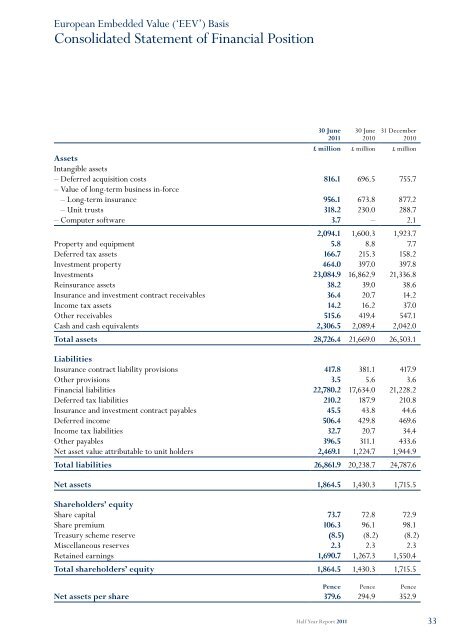
European Embedded Value (‘EEV’) BasisConsolidated <strong>St</strong>atement of Financial Position30 June201130 June201031 December2010£ million £ million £ millionAssetsIntangible assets– Deferred acquisition costs 816.1 696.5 755.7– Value of long-term business in-force– Long-term insurance 956.1 673.8 877.2– Unit trusts 318.2 230.0 288.7– Computer software 3.7 – 2.12,094.1 1,600.3 1,923.7Property and equipment 5.8 8.8 7.7Deferred tax assets 166.7 215.3 158.2Investment property 464.0 397.0 397.8Investments 23,084.9 16,862.9 21,336.8Reinsurance assets 38.2 39.0 38.6Insurance and investment contract receivables 36.4 20.7 14.2Income tax assets 14.2 16.2 37.0Other receivables 515.6 419.4 547.1Cash and cash equivalents 2,306.5 2,089.4 2,042.0Total assets 28,726.4 21,669.0 26,503.1LiabilitiesInsurance contract liability provisions 417.8 381.1 417.9Other provisions 3.5 5.6 3.6Financial liabilities 22,780.2 17,634.0 21,228.2Deferred tax liabilities 210.2 187.9 210.8Insurance and investment contract payables 45.5 43.8 44.6Deferred income 506.4 429.8 469.6Income tax liabilities 32.7 20.7 34.4Other payables 396.5 311.1 433.6Net asset value attributable to unit holders 2,469.1 1,224.7 1,944.9Total liabilities 26,861.9 20,238.7 24,787.6Net assets 1,864.5 1,430.3 1,715.5Shareholders’ equityShare capital 73.7 72.8 72.9Share premium 106.3 96.1 98.1Treasury scheme reserve (8.5) (8.2) (8.2)Miscellaneous reserves 2.3 2.3 2.3Retained earnings 1,690.7 1,267.3 1,550.4Total shareholders’ equity 1,864.5 1,430.3 1,715.5Pence Pence PenceNet assets per share 379.6 294.9 352.9Half Year Report 201133