Annual Report Summary 2011 - 2012 - City of Monash
Annual Report Summary 2011 - 2012 - City of Monash
Annual Report Summary 2011 - 2012 - City of Monash
- No tags were found...
You also want an ePaper? Increase the reach of your titles
YUMPU automatically turns print PDFs into web optimized ePapers that Google loves.
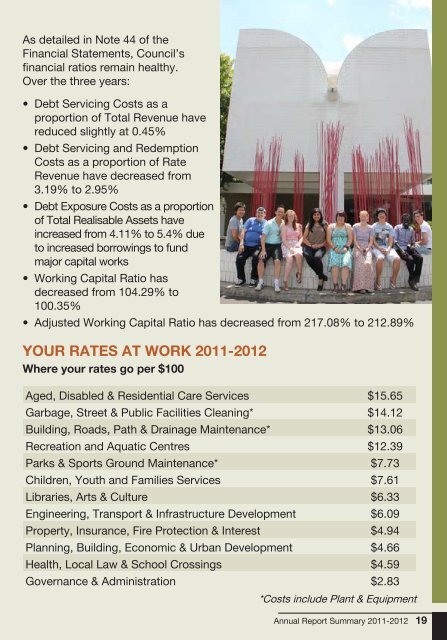
As detailed in Note 44 <strong>of</strong> theFinancial Statements, Council’sfinancial ratios remain healthy.Over the three years:• Debt Servicing Costs as aproportion <strong>of</strong> Total Revenue havereduced slightly at 0.45%• Debt Servicing and RedemptionCosts as a proportion <strong>of</strong> RateRevenue have decreased from3.19% to 2.95%• Debt Exposure Costs as a proportion<strong>of</strong> Total Realisable Assets haveincreased from 4.11% to 5.4% dueto increased borrowings to fundmajor capital works• Working Capital Ratio hasdecreased from 104.29% to100.35%• Adjusted Working Capital Ratio has decreased from 217.08% to 212.89%YOUR RATES AT WORK <strong>2011</strong>-<strong>2012</strong>Where your rates go per $100Aged, Disabled & Residential Care Services $15.65Garbage, Street & Public Facilities Cleaning* $14.12Building, Roads, Path & Drainage Maintenance* $13.06Recreation and Aquatic Centres $12.39Parks & Sports Ground Maintenance* $7.73Children, Youth and Families Services $7.61Libraries, Arts & Culture $6.33Engineering, Transport & Infrastructure Development $6.09Property, Insurance, Fire Protection & Interest $4.94Planning, Building, Economic & Urban Development $4.66Health, Local Law & School Crossings $4.59Governance & Administration $2.83*Costs include Plant & Equipment<strong>Annual</strong> <strong>Report</strong> <strong>Summary</strong> <strong>2011</strong>-<strong>2012</strong> 19


