view pdf - Seas At Risk
view pdf - Seas At Risk
view pdf - Seas At Risk
- No tags were found...

You also want an ePaper? Increase the reach of your titles
YUMPU automatically turns print PDFs into web optimized ePapers that Google loves.
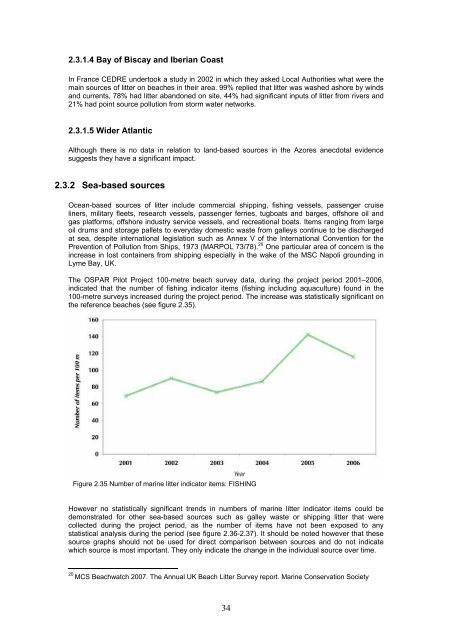
2.3.1.4 Bay of Biscay and Iberian CoastIn France CEDRE undertook a study in 2002 in which they asked Local Authorities what were themain sources of litter on beaches in their area. 99% replied that litter was washed ashore by windsand currents, 78% had litter abandoned on site, 44% had significant inputs of litter from rivers and21% had point source pollution from storm water networks.2.3.1.5 Wider <strong>At</strong>lanticAlthough there is no data in relation to land-based sources in the Azores anecdotal evidencesuggests they have a significant impact.2.3.2 Sea-based sourcesOcean-based sources of litter include commercial shipping, fishing vessels, passenger cruiseliners, military fleets, research vessels, passenger ferries, tugboats and barges, offshore oil andgas platforms, offshore industry service vessels, and recreational boats. Items ranging from largeoil drums and storage pallets to everyday domestic waste from galleys continue to be dischargedat sea, despite international legislation such as Annex V of the International Convention for thePrevention of Pollution from Ships, 1973 (MARPOL 73/78). 20 One particular area of concern is theincrease in lost containers from shipping especially in the wake of the MSC Napoli grounding inLyme Bay, UK.The OSPAR Pilot Project 100-metre beach survey data, during the project period 2001–2006,indicated that the number of fishing indicator items (fishing including aquaculture) found in the100-metre surveys increased during the project period. The increase was statistically significant onthe reference beaches (see figure 2.35).Figure 2.35 Number of marine litter indicator items: FISHINGHowever no statistically significant trends in numbers of marine litter indicator items could bedemonstrated for other sea-based sources such as galley waste or shipping litter that werecollected during the project period, as the number of items have not been exposed to anystatistical analysis during the period (see figure 2.36-2.37). It should be noted however that thesesource graphs should not be used for direct comparison between sources and do not indicatewhich source is most important. They only indicate the change in the individual source over time.20MCS Beachwatch 2007. The Annual UK Beach Litter Survey report. Marine Conservation Society34