Analysis - the City of Rockford
Analysis - the City of Rockford
Analysis - the City of Rockford
- No tags were found...

You also want an ePaper? Increase the reach of your titles
YUMPU automatically turns print PDFs into web optimized ePapers that Google loves.
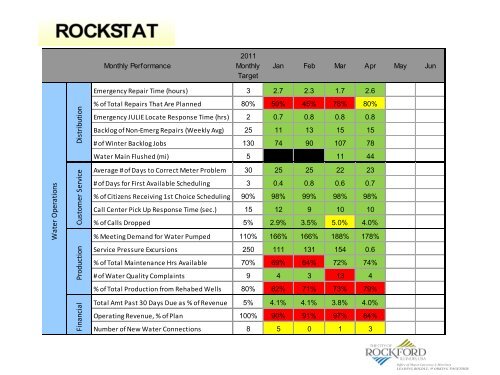
Water OperationsFinancial Production Customer Service DistributionMonthly Performance2011MonthlyTargetJan Feb Mar Apr May JunEmergency Repair Time (hours) 3 2.7 2.3 1.7 2.6% <strong>of</strong> Total Repairs That Are Planned 80% 59% 45% 78% 80%Emergency JULIE Locate Response Time (hrs) 2 0.7 0.8 0.8 0.8Backlog <strong>of</strong> Non-Emerg Repairs (Weekly Avg) 25 11 13 15 15# <strong>of</strong> Winter Backlog Jobs 130 74 90 107 78Water Main Flushed (mi) 5 11 44Average # <strong>of</strong> Days to Correct Meter Problem 30 25 25 22 23# <strong>of</strong> Days for First Available Scheduling 3 0.4 0.8 0.6 0.7% <strong>of</strong> Citizens Receiving 1st Choice Scheduling 90% 98% 99% 98% 98%Call Center Pick Up Response Time (sec.) 15 12 9 10 10% <strong>of</strong> Calls Dropped 5% 2.9% 3.5% 5.0% 4.0%% Meeting Demand for Water Pumped 110% 166% 166% 188% 178%Service Pressure Excursions 250 111 131 154 0.6% <strong>of</strong> Total Maintenance Hrs Available 70% 69% 64% 72% 74%# <strong>of</strong> Water Quality Complaints 9 4 3 13 4% <strong>of</strong> Total Production from Rehabed Wells 80% 62% 71% 73% 79%Total Amt Past 30 Days Due as % <strong>of</strong> Revenue 5% 4.1% 4.1% 3.8% 4.0%Operating Revenue, % <strong>of</strong> Plan 100% 90% 91% 97% 84%Number <strong>of</strong> New Water Connections 8 5 0 1 3Office <strong>of</strong> Mayor Lawrence J. MorrisseyLEADING BOLDLY, W ORKING TOGETHER