Socio Economic - Transnet
Socio Economic - Transnet
Socio Economic - Transnet
- No tags were found...

You also want an ePaper? Increase the reach of your titles
YUMPU automatically turns print PDFs into web optimized ePapers that Google loves.
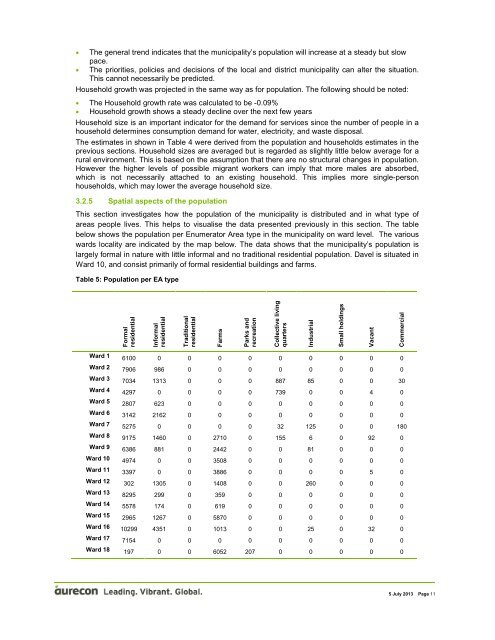
• The general trend indicates that the municipality’s population will increase at a steady but slowpace.• The priorities, policies and decisions of the local and district municipality can alter the situation.This cannot necessarily be predicted.Household growth was projected in the same way as for population. The following should be noted:• The Household growth rate was calculated to be -0.09%• Household growth shows a steady decline over the next few yearsHousehold size is an important indicator for the demand for services since the number of people in ahousehold determines consumption demand for water, electricity, and waste disposal.The estimates in shown in Table 4 were derived from the population and households estimates in theprevious sections. Household sizes are averaged but is regarded as slightly little below average for arural environment. This is based on the assumption that there are no structural changes in population.However the higher levels of possible migrant workers can imply that more males are absorbed,which is not necessarily attached to an existing household. This implies more single-personhouseholds, which may lower the average household size.3.2.5 Spatial aspects of the populationThis section investigates how the population of the municipality is distributed and in what type ofareas people lives. This helps to visualise the data presented previously in this section. The tablebelow shows the population per Enumerator Area type in the municipality on ward level. The variouswards locality are indicated by the map below. The data shows that the municipality’s population islargely formal in nature with little informal and no traditional residential population. Davel is situated inWard 10, and consist primarily of formal residential buildings and farms.Table 5: Population per EA typeFormalresidentialInformalresidentialTraditionalresidentialFarmsParks andrecreationCollective livingquartersIndustrialSmall holdingsVacantCommercialWard 1 6100 0 0 0 0 0 0 0 0 0Ward 2 7906 986 0 0 0 0 0 0 0 0Ward 3 7034 1313 0 0 0 887 85 0 0 30Ward 4 4297 0 0 0 0 739 0 0 4 0Ward 5 2807 623 0 0 0 0 0 0 0 0Ward 6 3142 2162 0 0 0 0 0 0 0 0Ward 7 5275 0 0 0 0 32 125 0 0 180Ward 8 9175 1460 0 2710 0 155 6 0 92 0Ward 9 6386 881 0 2442 0 0 81 0 0 0Ward 10 4974 0 0 3508 0 0 0 0 0 0Ward 11 3397 0 0 3886 0 0 0 0 5 0Ward 12 302 1305 0 1408 0 0 260 0 0 0Ward 13 8295 299 0 359 0 0 0 0 0 0Ward 14 5578 174 0 619 0 0 0 0 0 0Ward 15 2965 1267 0 5870 0 0 0 0 0 0Ward 16 10299 4351 0 1013 0 0 25 0 32 0Ward 17 7154 0 0 0 0 0 0 0 0 0Ward 18 197 0 0 6052 207 0 0 0 0 05 July 2013 Page 11