Socio Economic - Transnet
Socio Economic - Transnet
Socio Economic - Transnet
- No tags were found...

You also want an ePaper? Increase the reach of your titles
YUMPU automatically turns print PDFs into web optimized ePapers that Google loves.
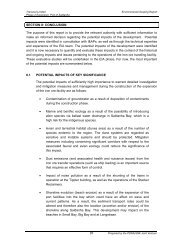
3.3 Labour and <strong>Economic</strong> AnalysisIn the analysis of the labour and employment situation in a municipal area, it is necessary to focusattention on the size and spatial distribution of the labour force. Secondly, the characteristics of thelabour market should be analysed. To this end, it is necessary to examine the supply of labour, whichis derived from figures on the economically active population in a municipal area. The demand forlabour, on the other hand, is an indication of employment opportunities, which are determined by theeconomic structure of an area along with the level and growth in economic activities. Unemployment,and in a sense transfrontier commuting, provides an indication of the difference between supply anddemand and implies that equilibrium in the labour market necessitates both expansion of economicactivity and the curtailment of population growth.Figure 4: Composition of the labour forceA third issue that should be addressed is involvement in the peripheral sector, as not all potentialworkers are active in the labour market. Finally, the quality of the labour force needs to be analysedas it provides information on the employability of the workers.The term labour force refers to those people who are available for employment in a certain area.Figure 4 illustrates the different components of the labour force and the relationship between them.3.3.1 Description of the Msukaligwa Local Municipality Labour forceTable 6: Msukaligwa Local Municipality Labour forceDescriptionNumberPopulation 126 687<strong>Economic</strong>ally active 64 560Formal and informal (Total) 36 971Formal 26 104Formal - Highly skilled 4 402Formal - Skilled 10 739Formal - Semi- and unskilled 10 963Informal 10 867Unemployed 3 033Unemployment rate (Percentage) 20.80 %Labour force participation rate (Percentage) 57.27 %Table 6 describes the labour force of the Msukaligwa LM. According to the 2011 data acquired fromthe Quantec database, Msukaligwa Local Municipality has 64,560 economically active persons.26,104 people in the municipality are employed in the formal sector while 10,867 people are active inthe informal sector of the economy and 3 033 are shown to be unemployed. The municipality has anunemployment rate of 20.80% and a labour force participation rate of 57.27%.5 July 2013 Page 14