Socio Economic - Transnet
Socio Economic - Transnet
Socio Economic - Transnet
- No tags were found...

You also want an ePaper? Increase the reach of your titles
YUMPU automatically turns print PDFs into web optimized ePapers that Google loves.
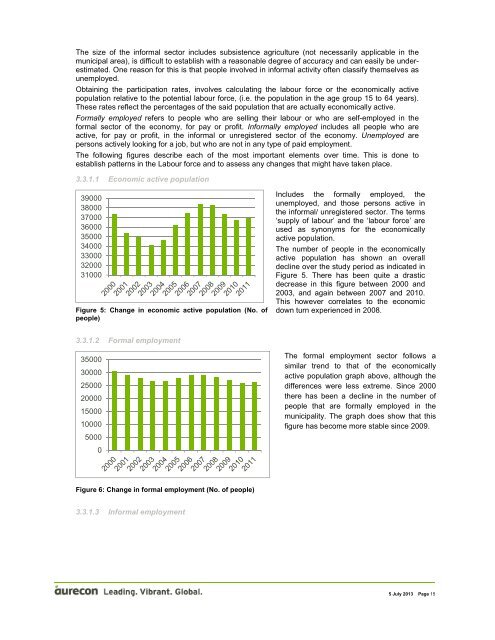
The size of the informal sector includes subsistence agriculture (not necessarily applicable in themunicipal area), is difficult to establish with a reasonable degree of accuracy and can easily be underestimated.One reason for this is that people involved in informal activity often classify themselves asunemployed.Obtaining the participation rates, involves calculating the labour force or the economically activepopulation relative to the potential labour force, (i.e. the population in the age group 15 to 64 years).These rates reflect the percentages of the said population that are actually economically active.Formally employed refers to people who are selling their labour or who are self-employed in theformal sector of the economy, for pay or profit. Informally employed includes all people who areactive, for pay or profit, in the informal or unregistered sector of the economy. Unemployed arepersons actively looking for a job, but who are not in any type of paid employment.The following figures describe each of the most important elements over time. This is done toestablish patterns in the Labour force and to assess any changes that might have taken place.3.3.1.1 <strong>Economic</strong> active population390003800037000360003500034000330003200031000Figure 5: Change in economic active population (No. ofpeople)Includes the formally employed, theunemployed, and those persons active inthe informal/ unregistered sector. The terms‘supply of labour’ and the ‘labour force’ areused as synonyms for the economicallyactive population.The number of people in the economicallyactive population has shown an overalldecline over the study period as indicated inFigure 5. There has been quite a drasticdecrease in this figure between 2000 and2003, and again between 2007 and 2010.This however correlates to the economicdown turn experienced in 2008.3.3.1.2 Formal employment35000300002500020000150001000050000The formal employment sector follows asimilar trend to that of the economicallyactive population graph above, although thedifferences were less extreme. Since 2000there has been a decline in the number ofpeople that are formally employed in themunicipality. The graph does show that thisfigure has become more stable since 2009.Figure 6: Change in formal employment (No. of people)3.3.1.3 Informal employment5 July 2013 Page 15