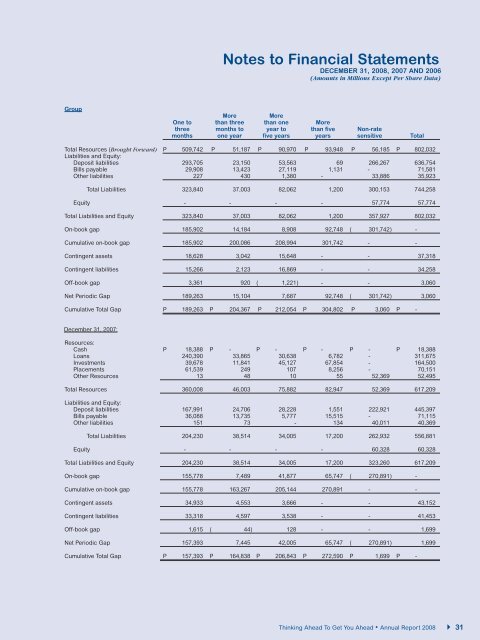
<strong>Notes</strong> <strong>to</strong> <strong>Financial</strong> <strong>Statements</strong>DECEMBER 31, 2008, 2007 AND 2006(Amounts in Millions Except Per Share Data)Group2008 2007ForeignForeignCurrency Peso Total Currency Peso TotalLiabilities:Deposit liabilities P 172,667 P 464,087 P 636,754 P 116,933 P 328,464 P 445,397Bills payable 16,879 34,557 51,436 27,579 24,904 52,483Subordinated notes - 20,146 20,146 18,631 - 18,631Other liabilities 10,934 24,988 35,922 31,668 8,702 40,370P 200,480 P 543,778 P 744,258 P 194,811 P 362,070 P 556,881Parent Bank2008 2007ForeignForeignCurrency Peso Total Currency Peso TotalResources:Cash and other cash itemsand Due from BSP P - P 81,703 P 81,703 P 9,357 P 57,400 P 66,757Due from other banks 14,573 308 14,881 15,648 454 16,102Trading and Investmentsecurities:At FVTPL 3,448 1,712 5,160 8,236 9,512 17,748AFS Securities 11,888 19,768 31,656 44,166 24,397 68,563HTM 80,325 24,951 105,276 45,901 16,670 62,571Loans and other receivables 68,281 399,309 467,590 41,158 256,473 297,631Other resources 1,448 13,383 14,831 1,841 13,717 15,558P 179,963 P 541,134 P 721,097 P 166,307 P 378,623 P 544,930Liabilities:Deposit liabilities P 163,338 P 449,629 P 612,967 P 105,360 P 328,935 P 434,295Bills payable 16,879 26,363 43,242 25,909 15,283 41,192Subordinated notes - 20,146 20,146 8,557 10,074 18,631Other liabilities 10,766 21,245 32,011 4,896 32,026 36,9224.2.2 Interest Rate RiskP 190,983 P 517,383 P 708,366 P 144,722 P 386,318 P 531,040The Group prepares gap analysis <strong>to</strong> measure the sensitivity of its resources, liabilities and off-statement of condition positions <strong>to</strong> interestrate fluctuations. The focus of analysis is the impact of changes in interest rates on accrual or reported earnings. This analysis would givemanagement a glimpse of maturity and re-pricing profile of its interest sensitive resources and liabilities. An interest rate gap report is preparedby classifying all assets and liabilities in<strong>to</strong> various time buckets according <strong>to</strong> contracted maturities or anticipated repricing dates, and otherapplicable behavioral assumptions. The difference in the amount of resources and liabilities maturing or being repriced in any time periodcategory would then give the Group an indication of the extent <strong>to</strong> which it is exposed <strong>to</strong> the risk of potential changes in net interest income.The analyses of the groupings of resources, liabilities and off-statement of condition items as of December 31, 2008 and 2007 based on theexpected interest realization or recognition are presented below:GroupMoreMoreOne <strong>to</strong> than three than one Morethree months <strong>to</strong> year <strong>to</strong> than five Non-ratemonths one year five years years sensitive TotalDecember 31, 2008:Resources:Cash P 21,770 P - P - P - P - P 21,770Loans 387,549 42,667 36,036 21,904 3,830 491,986Investments 20,701 8,472 54,934 72,044 - 156,151Placements 79,722 48 - - - 79,770Other Resources - - - - 52,355 52,355Total Resources (Carried Forward) P 509,742 P 51,187 P 90,970 P 93,948 P 56,185 P 802,03230Thinking Ahead To Get You Ahead • Annual Report 2008
<strong>Notes</strong> <strong>to</strong> <strong>Financial</strong> <strong>Statements</strong>DECEMBER 31, 2008, 2007 AND 2006(Amounts in Millions Except Per Share Data)GroupMoreMoreOne <strong>to</strong> than three than one Morethree months <strong>to</strong> year <strong>to</strong> than five Non-ratemonths one year five years years sensitive TotalTotal Resources (Brought Forward) P 509,742 P 51,187 P 90,970 P 93,948 P 56,185 P 802,032Liabilities and Equity:Deposit liabilities 293,705 23,150 53,563 69 266,267 636,754Bills payable 29,908 13,423 27,119 1,131 - 71,581Other liabilities 227 430 1,380 - 33,886 35,923Total Liabilities 323,840 37,003 82,062 1,200 300,153 744,258Equity - - - - 57,774 57,774Total Liabilities and Equity 323,840 37,003 82,062 1,200 357,927 802,032On-book gap 185,902 14,184 8,908 92,748 ( 301,742 ) -Cumulative on-book gap 185,902 200,086 208,994 301,742 - -Contingent assets 18,628 3,042 15,648 - - 37,318Contingent liabilities 15,266 2,123 16,869 - - 34,258Off-book gap 3,361 920 ( 1,221 ) - - 3,060Net Periodic Gap 189,263 15,104 7,687 92,748 ( 301,742 ) 3,060Cumulative Total Gap P 189,263 P 204,367 P 212,054 P 304,802 P 3,060 P -December 31, 2007:Resources:Cash P 18,388 P - P - P - P - P 18,388Loans 240,390 33,865 30,638 6,782 - 311,675Investments 39,678 11,841 45,127 67,854 - 164,500Placements 61,539 249 107 8,256 - 70,151Other Resources 13 48 10 55 52,369 52,495Total Resources 360,008 46,003 75,882 82,947 52,369 617,209Liabilities and Equity:Deposit liabilities 167,991 24,706 28,228 1,551 222,921 445,397Bills payable 36,088 13,735 5,777 15,515 - 71,115Other liabilities 151 73 - 134 40,011 40,369Total Liabilities 204,230 38,514 34,005 17,200 262,932 556,881Equity - - - - 60,328 60,328Total Liabilities and Equity 204,230 38,514 34,005 17,200 323,260 617,209On-book gap 155,778 7,489 41,877 65,747 ( 270,891 ) -Cumulative on-book gap 155,778 163,267 205,144 270,891 - -Contingent assets 34,933 4,553 3,666 - - 43,152Contingent liabilities 33,318 4,597 3,538 - - 41,453Off-book gap 1,615 ( 44 ) 128 - - 1,699Net Periodic Gap 157,393 7,445 42,005 65,747 ( 270,891 ) 1,699Cumulative Total Gap P 157,393 P 164,838 P 206,843 P 272,590 P 1,699 P -Thinking Ahead To Get You Ahead • Annual Report 2008 31