FY 2005 - University of Missouri System
FY 2005 - University of Missouri System
FY 2005 - University of Missouri System

You also want an ePaper? Increase the reach of your titles
YUMPU automatically turns print PDFs into web optimized ePapers that Google loves.
Table <strong>of</strong> ContentsGOVERNING BOARD AND ADMINISTRATIVE STAFF . . . . . . . . . . . . . . . . . . . . . . . . . . . . . . . . . . . . . . . . . . 1MANAGEMENT’S DISCUSSION AND ANALYSIS . . . . . . . . . . . . . . . . . . . . . . . . . . . . . . . . . . . . . . . . . . . . . . . . 2INDEPENDENT AUDITORS’ REPORT . . . . . . . . . . . . . . . . . . . . . . . . . . . . . . . . . . . . . . . . . . . . . . . . . . . . . . . . . . 14BASIC FINANCIAL STATEMENTS:Statements <strong>of</strong> Net Assets . . . . . . . . . . . . . . . . . . . . . . . . . . . . . . . . . . . . . . . . . . . . . . . . . . . . . . . . . . . . . 16Statements <strong>of</strong> Revenues, Expenses and Changes in Net Assets . . . . . . . . . . . . . . . . . . . . . . . . . . . . . . . 19Statements <strong>of</strong> Cash Flows . . . . . . . . . . . . . . . . . . . . . . . . . . . . . . . . . . . . . . . . . . . . . . . . . . . . . . . . . . . 20Statements <strong>of</strong> Net Assets Held for Pension Benefits . . . . . . . . . . . . . . . . . . . . . . . . . . . . . . . . . . . . . . . 22Statements <strong>of</strong> Changes in Net Assets Held for Pension Benefits . . . . . . . . . . . . . . . . . . . . . . . . . . . . . 22Notes to Financial Statements . . . . . . . . . . . . . . . . . . . . . . . . . . . . . . . . . . . . . . . . . . . . . . . . . . . . . . . . . 232 0 0 5 F i n a n c i a l R e p o r t : U n i v e r s i t y o f M i s s o u r ia c o m p o n e n t u n i t o f t h e S t a t e o f M i s s o u r i
This page is intentionally left blank.2 0 0 5 F i n a n c i a l R e p o r t : U n i v e r s i t y o f M i s s o u r ia c o m p o n e n t u n i t o f t h e S t a t e o f M i s s o u r i
G overning Board and Administrative StaffUNIVERSITY OF MISSOURIBOARD OF CURATORSThomas E. Atkins, PresidentAngela M. Bennett, Vice PresidentMarion H. CairnsJohn M. Carnahan IIIAnne C. ReamDoug RussellCheryl D. S. WalkerDon WalsworthDavid G. WasingerMaria C. Curtis, Student RepresentativeGENERAL OFFICERSElson S. Floyd, PresidentMarvin E. Wright, General CounselJohn C. Gardner, Vice President for Research and Economic DevelopmentSteven Graham, Associate Vice President for Academic AffairsR. Kenneth Hutchinson, Vice President for Human ResourcesStephen C. Knorr, Vice President for Government RelationsNatalie Krawitz, Vice President for Finance and AdministrationJames H. Ross, Chief Executive Officer <strong>of</strong> <strong>University</strong> <strong>of</strong> <strong>Missouri</strong> Health CareBrady Deaton, Chancellor, Columbia CampusStephen W. Lehmkuhle, Interim Chancellor, Kansas City CampusJohn F. Carney III, Chancellor, Rolla CampusThomas F. George, Chancellor, St. Louis CampusFINANCE STAFFNatalie Krawitz, Vice President for Finance and AdministrationJane E. Closterman, ControllerShirley S. DeJarnette, TreasurerCuba Plain, Director Budget Planning and Development2 0 0 5 F i n a n c i a l R e p o r t : U n i v e r s i t y o f M i s s o u r ia c o m p o n e n t u n i t o f t h e S t a t e o f M i s s o u r i
Management’s Discussion and Analysis (unaudited)F o r t h e y e a r s e n d e d J u n e 3 0 , 2 0 0 5 a n d 2 0 0 4The following Management’s Discussion and Analysis (“MD&A”) provides an overview <strong>of</strong> the financial position andactivities <strong>of</strong> the <strong>University</strong> <strong>of</strong> <strong>Missouri</strong> (the “<strong>University</strong>”) for the fiscal year ended June 30, <strong>2005</strong> and 2004, and shouldbe read in conjunction with the financial statements and notes. This overview is required by Governmental AccountingStandards Board (“GASB”) principles, GASB Statement No. 35, Basic Financial Statements – and Management’sDiscussion and Analysis – for Public Colleges and Universities.UNIVERSITY ACCOUNTING AND FINANCIAL REPORTINGThis report includes five financial statements: the Statements <strong>of</strong> Net Assets, the Statements <strong>of</strong> Revenues, Expensesand Changes in Net Assets and the Statements <strong>of</strong> Cash Flows for the <strong>University</strong> <strong>of</strong> <strong>Missouri</strong> <strong>System</strong> and AggregateDiscretely Presented Component Units; and the Statements <strong>of</strong> Net Assets Held for Pension Benefits and the Statements<strong>of</strong> Changes in Net Assets Held for Pension Benefits for the <strong>University</strong> <strong>of</strong> <strong>Missouri</strong> Retirement Trust. The financialstatements <strong>of</strong> the <strong>University</strong> are prepared in accordance with accounting principles generally accepted in the UnitedStates <strong>of</strong> America as prescribed by GASB. A summary <strong>of</strong> significant accounting policies followed by the <strong>University</strong>is included in Note 1 to the financial statements <strong>of</strong> this report. A more detailed unaudited financial report that includesinformation on each campus is available at the <strong>University</strong> <strong>of</strong> <strong>Missouri</strong>, 118 <strong>University</strong> Hall, Columbia, MO 65211.STATEMENTS OF NET ASSETSThe Statements <strong>of</strong> Net Assets present the financial position <strong>of</strong> the <strong>University</strong> at the end <strong>of</strong> the fiscal year and include allassets and liabilities <strong>of</strong> the <strong>University</strong>. Assets and liabilities are generally measured using current values, with certainexceptions, such as capital assets which are stated at cost less accumulated depreciation, and long-term debt which isstated at cost. A summary <strong>of</strong> the <strong>University</strong>’s assets, liabilities and net assets at June 30, <strong>2005</strong>, 2004 and 2003, is asfollows (in thousands <strong>of</strong> dollars):Fiscal Year<strong>2005</strong>Fiscal Year2004Fiscal Year2003Assets:Current Assets $ 816,846 $ 596,448 $ 660,794Long-Term Investments -Endowed and Quasi-Endowed Investments 744,372 709,227 633,939Other Investments 387,926 504,110 336,935Capital Assets, Net 1,795,513 1,700,324 1,542,432Other Noncurrent Assets 86,702 70,806 77,870Total Assets $ 3,831,359 $ 3,580,915 $ 3,251,970Liabilities:Current Liabilities $ 404,328 $ 370,280 $ 377,931Noncurrent Liabilities 622,997 631,587 517,975Total Liabilities 1,027,325 1,001,867 895,906Net Assets:Invested in Capital Assets, Net <strong>of</strong> Related Debt 1,226,962 1,147,472 1,074,585Restricted -Nonexpendable 555,658 484,370 421,521Expendable 335,469 305,656 317,398Unrestricted 685,945 641,550 542,560Total Net Assets 2,804,034 2,579,048 2,356,064Total Liabilities and Net Assets $ 3,831,359 $ 3,580,915 $ 3,251,9702 0 0 5 F i n a n c i a l R e p o r t : U n i v e r s i t y o f M i s s o u r ia c o m p o n e n t u n i t o f t h e S t a t e o f M i s s o u r i
Management’s Discussion and Analysis (unaudited)F o r t h e y e a r s e n d e d J u n e 3 0 , 2 0 0 5 a n d 2 0 0 4Total Liabilities increased $25.5 million over the prior year. Significant changes in Current Liabilities include a$20.4 million increase in Collateral for Securities on Loan from $61.2 million as <strong>of</strong> June 30, 2004, to $81.6 million as<strong>of</strong> June 30, <strong>2005</strong>, and a $10.4 million increase in Accrued Liabilities primarily related to accrued self-insurance.During fiscal year <strong>2005</strong>, Bonds and Notes Payable, net <strong>of</strong> premium/discount and deferred losses on defeasance,decreased $11.1 million. The following is a summary <strong>of</strong> the long-term debt by type <strong>of</strong> debt instrument (in thousands <strong>of</strong>dollars).Fiscal Year<strong>2005</strong>Fiscal Year2004Fiscal Year2003<strong>System</strong> Facilities Revenue Bonds $ 400,025 $ 408,295 $ 297,210Health Facilities Revenue Bonds 165,200 168,550 171,750Notes Payable 273Unamortized Premium/Discount and Losson Defeasance 312 (171) (3,968)565,537 576,674 465,265Capital Lease Obligations 10,171 10,532 10,864$ 575,708 $ 587,206 $ 476,129The Net Assets <strong>of</strong> the <strong>University</strong> increased in total by $225.0 million, excluding any changes in the <strong>University</strong> <strong>of</strong><strong>Missouri</strong> Retirement Trust. An explanation <strong>of</strong> these changes, based on the four net asset categories, is as follows:• Invested in Capital Assets, Net <strong>of</strong> Related Debt, represents capital holdings, net <strong>of</strong> accumulated depreciation andoutstanding debt financing related to the acquisition, construction or improvement <strong>of</strong> those assets. The increase <strong>of</strong>$79.5 million to $1.23 billion is due to net additions to capital assets.• Restricted Nonexpendable Net Assets are subject to externally imposed stipulations that they be maintainedpermanently by the <strong>University</strong>. This category <strong>of</strong> net assets represents the historical value (corpus) <strong>of</strong> gifts to the<strong>University</strong>’s permanent endowment. The increase <strong>of</strong> $71.3 million over fiscal year 2004 to $555.7 million at fiscalyear end <strong>2005</strong> is primarily a result <strong>of</strong> private funding for endowment purposes.• Restricted Expendable Net Assets are subject to externally imposed stipulations governing their use. This category<strong>of</strong> net assets includes net assets restricted for operations and endowment purposes <strong>of</strong> $239.6 million, facilities<strong>of</strong> $20.2 million and student loan programs <strong>of</strong> $75.7 million. Restricted Expendable Net Assets increased $29.8million over fiscal year 2004 to $335.5 million at fiscal year end <strong>2005</strong> primarily due to an increase in restricted giftincome.• Unrestricted Net Assets increased $44.4 million to $685.9 million at fiscal year end <strong>2005</strong>. This category <strong>of</strong> netassets is not subject to externally imposed stipulations, although may be designated for specific purposes by action<strong>of</strong> management or the Board <strong>of</strong> Curators. Unrestricted Net Assets are used primarily for academics and generaloperation <strong>of</strong> the <strong>University</strong> and consist <strong>of</strong> $479.4 million for this purpose, as well as $81.3 million for capital projectsand $3.4 million for student loan programs. In addition, Unrestricted Net Assets include funds functioning asendowment <strong>of</strong> $121.8 million.2 0 0 5 F i n a n c i a l R e p o r t : U n i v e r s i t y o f M i s s o u r ia c o m p o n e n t u n i t o f t h e S t a t e o f M i s s o u r i
Management’s Discussion and Analysis (unaudited)F o r t h e y e a r s e n d e d J u n e 3 0 , 2 0 0 5 a n d 2 0 0 4The distribution <strong>of</strong> the Net Asset balances, including additional details on unrestricted net assets by fund type, as <strong>of</strong>June 30, <strong>2005</strong>, are as follows:Fiscal Year 2004 Compared to Fiscal Year 2003Total Assets increased $328.9 million to $3.6 billion as <strong>of</strong> June 30, 2004 compared to June 30, 2003, which reflectedthe <strong>University</strong>’s continued efforts to strengthen its capital position. This increase was primarily attributable to theincrease in the <strong>University</strong>’s Long-Term Investments, and the expansion <strong>of</strong> Capital Assets across all <strong>of</strong> the campuses.Net capital additions <strong>of</strong> $247.7 million were <strong>of</strong>fset by $89.8 million in depreciation, resulting in a net change in CapitalAssets <strong>of</strong> $157.9 million.The <strong>University</strong> held Cash and Cash Equivalents at the end <strong>of</strong> fiscal year 2004 <strong>of</strong> $216.9 million, a decrease <strong>of</strong> $58.0million from the prior year. The <strong>University</strong>’s General Pool was more heavily weighted in short-term commercial paperon June 30, 2003 than on June 30, 2004. Accounts Receivable, net <strong>of</strong> $184.5 million, increased $35.9 million as <strong>of</strong> June30, 2004, over the prior year. The increase was primarily due to the receipt <strong>of</strong> bond funds <strong>of</strong> $34.3 million from theState <strong>of</strong> <strong>Missouri</strong> for construction <strong>of</strong> the new sports arena on the Columbia campus.Long-Term and Short-Term Investment holdings <strong>of</strong> $1.3 billion as <strong>of</strong> June 30, 2004, increased $228.9 million overthe prior year. Long-Term Investments in the <strong>University</strong>’s endowed funds, comprised primarily <strong>of</strong> a Balanced andFixed Income Pool, increased $75.3 million in fiscal year 2004 due to receipt <strong>of</strong> gifts, as well as strong bond marketperformance and improving stock market performance.Total Liabilities increased $106.0 million over the prior year. During fiscal year 2004, Bonds and Notes Payable,net <strong>of</strong> premium/discount and deferred losses on defeasance, increased $111.4 million as a result <strong>of</strong> a $155.2 millionbond issuance. The bonds financed $118.1 million for capital expansion across all campuses, $37.1 million to defease aportion <strong>of</strong> existing bonds and to finance certain costs <strong>of</strong> issuance.A significant change in current liabilities included a $26.2 million increase in Funds Held for Others. In January2004, the <strong>University</strong> became custodian <strong>of</strong> approximately $13 million that was previously held in trust by a third party.Another factor affecting the increase in Funds Held for Others was the increase in payroll withholding liabilitiesdue to timing <strong>of</strong> collection <strong>of</strong> employer and employee premiums and the subsequent remittance <strong>of</strong> these funds tothe applicable medical, dental and other employee-related programs. An <strong>of</strong>fsetting decrease in liabilities included adecrease <strong>of</strong> $55.8 million in Investment Settlements Payable from $74.3 million as <strong>of</strong> June 30, 2003, to $18.5 millionas <strong>of</strong> June 30, 2004. Purchases and sales <strong>of</strong> investments are accounted for on the trade date basis. The <strong>University</strong>records Investment Settlements Payable for purchases <strong>of</strong> investments occurring on or before June 30, which settleafter such date.2 0 0 5 F i n a n c i a l R e p o r t : U n i v e r s i t y o f M i s s o u r ia c o m p o n e n t u n i t o f t h e S t a t e o f M i s s o u r i
Management’s Discussion and Analysis (unaudited)F o r t h e y e a r s e n d e d J u n e 3 0 , 2 0 0 5 a n d 2 0 0 4The Net Assets <strong>of</strong> the <strong>University</strong> increased in total by $223.0 million, excluding any changes in the <strong>University</strong> <strong>of</strong><strong>Missouri</strong> Retirement Trust. An explanation <strong>of</strong> these changes, based on the four net asset categories, is as follows:• Invested in Capital Assets, Net <strong>of</strong> Related Debt, represents capital holdings, net <strong>of</strong> accumulated depreciation andoutstanding debt financing related to the acquisition, construction or improvement <strong>of</strong> those assets. The increase <strong>of</strong>$72.9 million to $1.15 billion is due to net additions to capital assets <strong>of</strong>fset by pay down <strong>of</strong> bonds outstanding.• Restricted Nonexpendable Net Assets are subject to externally imposed stipulations that they be maintainedpermanently by the <strong>University</strong>. This category <strong>of</strong> net assets represents the historical value (corpus) <strong>of</strong> gifts to the<strong>University</strong>’s permanent endowment. The increase <strong>of</strong> $62.8 million over fiscal year 2003 to $484.4 million at fiscalyear end 2004 is primarily a result <strong>of</strong> private funding for endowment purposes and strong investment returns in theBalanced Pool.• Restricted Expendable Net Assets are subject to externally imposed stipulations governing their use. This category<strong>of</strong> net assets includes net assets restricted for operations and endowment purposes <strong>of</strong> $200.6 million, facilities<strong>of</strong> $30.1 million and student loan programs <strong>of</strong> $75.0 million. Restricted Expendable Net Assets decreased $11.7million from fiscal year 2003 to $305.7 million at fiscal year end 2004 resulting from spend down <strong>of</strong> prior yeargifts restricted for capital expansion and the release <strong>of</strong> $13.4 million previously restricted for Health <strong>System</strong> debtcovenant requirements.• Unrestricted Net Assets increased $99.0 million to $641.6 million at fiscal year end 2004. This category <strong>of</strong> netassets is not subject to externally imposed stipulations, although may be designated for specific purposes by action<strong>of</strong> management or the Board <strong>of</strong> Curators. Unrestricted Net Assets are used primarily for academics and generaloperation <strong>of</strong> the <strong>University</strong> and consist <strong>of</strong> $391.0 million for this purpose, as well as $126.9 million for capitalprojects and $3.3 million for student loan programs. In addition, Unrestricted Net Assets include funds functioningas endowment <strong>of</strong> $120.4 million.2 0 0 5 F i n a n c i a l R e p o r t : U n i v e r s i t y o f M i s s o u r ia c o m p o n e n t u n i t o f t h e S t a t e o f M i s s o u r i
Management’s Discussion and Analysis (unaudited)F o r t h e y e a r s e n d e d J u n e 3 0 , 2 0 0 5 a n d 2 0 0 4STATEMENTS OF REVENUES, EXPENSES AND CHANGES IN NET ASSETSThe Statements <strong>of</strong> Revenues, Expenses and Changes in Net Assets present the <strong>University</strong>’s results <strong>of</strong> operations. TheStatements distinguish revenues and expenses between operating and nonoperating categories, and provide a view <strong>of</strong>the <strong>University</strong>’s operating margin (in thousands <strong>of</strong> dollars).Fiscal Year<strong>2005</strong>Fiscal Year2004Fiscal Year2003Operating Revenues:Net Tuition and Fees $ 355,516 $ 311,778 $ 273,419Grants and Contracts 293,885 259,092 259,268Patient Medical Services 566,394 492,229 425,700Other Auxiliary Enterprises 236,217 214,621 192,465Other Operating Revenues 80,797 65,401 65,106Total Operating Revenues 1,532,809 1,343,121 1,215,958Operating Expenses:Salaries, Wages and Staff Benefits 1,214,209 1,133,772 1,059,342Supplies, Services and Other Operating Expenses 596,395 516,766 473,874Other Operating Expenses 133,197 115,529 111,452Total Operating Expenses 1,943,801 1,766,067 1,644,668Operating Loss (410,992) (422,946) (428,710)Nonoperating Revenues (Expenses):State Appropriations 430,127 421,434 423,330Investment and Endowment Income 89,236 104,486 68,880Private Gifts 73,504 36,143 40,423Other Nonoperating Revenues (Expenses) (8,982) (10,627) (6,779)Net Nonoperating Revenues 583,885 551,436 525,854Income before Capital Contributions and Additions toPermanent Endowments 172,893 128,490 97,144State Capital Appropriations and State Bond Funds 4,686 54,239 13,584Capital Gifts and Grants 13,056 21,749 30,239Private Gifts for Endowment Purposes 34,351 18,506 20,254Increase in Net Assets 224,986 222,984 161,221Net Assets, Beginning <strong>of</strong> Year 2,579,048 2,356,064 2,194,843Net Assets, End <strong>of</strong> Year $ 2,804,034 $ 2,579,048 $ 2,356,0642 0 0 5 F i n a n c i a l R e p o r t : U n i v e r s i t y o f M i s s o u r ia c o m p o n e n t u n i t o f t h e S t a t e o f M i s s o u r i
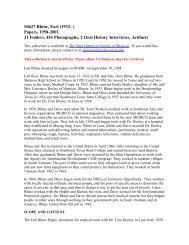
Management’s Discussion and Analysis (unaudited)F o r t h e y e a r s e n d e d J u n e 3 0 , 2 0 0 5 a n d 2 0 0 4Fiscal Year <strong>2005</strong> Compared to Fiscal Year 2004Total Operating Revenues increased $189.7 million over fiscal year 2004 to $1.5 billion in fiscal year <strong>2005</strong>. Thisfluctuation is due to increases in tuition, patient medical services and revenues related to certain auxiliary operations.Nonoperating Revenues include funding sources such as State Appropriations, State Bond Funds, FederalAppropriations and Gift and Investment Income. These sources are categorized under GASB standards as nonoperatingbecause they are not generated as a result <strong>of</strong> the <strong>University</strong>’s core missions <strong>of</strong> teaching, research and public service. Thefollowing is a graphic illustration <strong>of</strong> revenues by source, including both operating and nonoperating revenue streamsfor fiscal year <strong>2005</strong>.Tuition and Fees, net <strong>of</strong> Scholarship Allowances, which includes <strong>University</strong> resources used to reduce fees charged tostudents for related services, increased 14.0% or $43.7 million over fiscal year 2004. This was primarily due to Boardapprovedincreases in undergraduate and graduate tuition and related enrollment fees <strong>of</strong> 7.5%.As a research institution, the <strong>University</strong> receives a substantial amount <strong>of</strong> funding through Federal, State and PrivateGrants and Contracts. The <strong>University</strong> experienced growth in this revenue source <strong>of</strong> 13.4% from $259.1 millionin fiscal year 2004 to $293.9 million in fiscal year <strong>2005</strong>. Federal grant funding and State grant funding increasedsignificantly in fiscal year <strong>2005</strong> with increases <strong>of</strong> 13.4% and 23.2%, respectively. Modest increases <strong>of</strong> 6.9% occurredin private grants and contracts.Patient Medical Services, which includes fees for services provided by the <strong>University</strong> Hospitals and Clinics andrelated health care units (“UHC”) and the <strong>University</strong> Physicians Practice Plan, increased $74.2 million or 15.1% overfiscal year 2004. Of this increase, $4.0 million relates to the operations <strong>of</strong> the <strong>University</strong> Physicians and $70.2 millionrelates to UHC.Following two years <strong>of</strong> consecutive cuts, the <strong>University</strong> experienced an increase in fiscal year <strong>2005</strong> to its coreappropriations from the State <strong>of</strong> <strong>Missouri</strong>, resulting in net State Appropriations <strong>of</strong> $430.1 million. In fiscal year 2004,the <strong>University</strong>’s core appropriations were cut 5.5% with additional extraordinary withholdings <strong>of</strong> $9.7 million withheldfrom the State. Subsequently, the State <strong>of</strong> <strong>Missouri</strong> released the extraordinary withholdings throughout fiscal year2004, resulting in net State Appropriations <strong>of</strong> $421.4 million in fiscal year 2004.In fiscal year <strong>2005</strong>, State Capital Appropriations and State Bond Funds <strong>of</strong> $4.7 million, consisting primarily <strong>of</strong>funding for the Health Sciences Center on the Kansas City campus, decreased $49.5 million from $54.2 million in fiscalyear 2004. In fiscal year 2004, the State <strong>of</strong> <strong>Missouri</strong> released $34.3 million <strong>of</strong> bond funds for the new sports arena onthe Columbia campus. The remaining State Capital Appropriations in fiscal year 2004 consisted primarily <strong>of</strong> fundingfor the Life Sciences Center on the Columbia campus, which opened in August 2004, and the Health Sciences Centerin Kansas City.2 0 0 5 F i n a n c i a l R e p o r t : U n i v e r s i t y o f M i s s o u r ia c o m p o n e n t u n i t o f t h e S t a t e o f M i s s o u r i
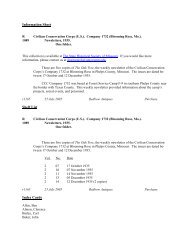
Management’s Discussion and Analysis (unaudited)F o r t h e y e a r s e n d e d J u n e 3 0 , 2 0 0 5 a n d 2 0 0 4Private and Capital Gifts and Grants <strong>of</strong> $120.9 million in fiscal year <strong>2005</strong> increased $44.5 million compared to $76.4million in fiscal year 2004, consisting <strong>of</strong> an increase in gift income <strong>of</strong> $43.2 million and an increase in capital grants<strong>of</strong> $1.3 million.Gift income is reflected in three categories: Private Gifts, Capital Gifts (restricted for capital expansion) and PrivateGifts for Endowments (restricted for the establishment <strong>of</strong> endowments). Total gifts to the <strong>University</strong> in fiscal year<strong>2005</strong> <strong>of</strong> $117.4 million increased $43.2 million compared to $74.2 million in the prior fiscal year. Noncapital privategifts <strong>of</strong> $107.8 million in fiscal year <strong>2005</strong> increased $53.2 million over the prior fiscal year due to increased focus by thecampuses on capital campaigns. Offsetting decreases <strong>of</strong> $10.0 million in capital gifts in fiscal year <strong>2005</strong> were largelydue to nonrecurring pledges in fiscal year 2004 for renovating various sports facilities.Capital Grants <strong>of</strong> $3.5 million in fiscal year <strong>2005</strong> and $2.2 million in fiscal year 2004 represent funding received fromFederal and State agencies to be used for the expansion <strong>of</strong> the <strong>University</strong>’s physical plant. The increase <strong>of</strong> $1.3 millionin fiscal year <strong>2005</strong> is primarily due to a new grant from the National Aeronautical Space Administration.Investment and Endowment Income includes interest and dividend income as well as realized and unrealized gainsand losses. Investment and Endowment Income decreased $15.3 million, from $104.5 million in fiscal year 2004 to$89.2 million in fiscal year <strong>2005</strong>. Contributing factors include a decline in the rate <strong>of</strong> return on the Balanced Pool from17.4% in fiscal year 2004 to 9.6% in fiscal year <strong>2005</strong> due to lower domestic and international stock market returns inthe current fiscal year compared to fiscal year 2004, and a decrease in realized and unrealized net gains <strong>of</strong> $22.7 millionfrom $61.0 million in fiscal year 2004 to $38.3 million in fiscal year <strong>2005</strong>.Total Operating Expenses reflect a 10.1% or $177.7 million increase over fiscal year 2004. The following is a graphicillustration <strong>of</strong> total expenses by object <strong>of</strong> expenditure for fiscal year <strong>2005</strong>:During fiscal year <strong>2005</strong>, Salaries and Wages increased approximately 7.4% over fiscal year 2004 primarily due tomerit increases for employees effective September 2004. Staff Benefits showed a corresponding increase <strong>of</strong> 6.0%year over year related to employer costs associated with the <strong>University</strong>’s medical, dental and life premiums, as well asretirement contributions.The <strong>University</strong>’s expenses related to Supplies, Services and Other Operating costs increased by 15.4% or $79.6 millionto $596.4 million in fiscal year <strong>2005</strong>, compared to $516.8 million in fiscal year 2004. Increased patient care operatingcosts at the UHC directly correlated with UHC’s increase in services and patient care revenue, account for $42.0million <strong>of</strong> this increase. Increases in costs <strong>of</strong> goods sold account for $6.7 million <strong>of</strong> the increase, which relates directlyto the increase in auxiliary revenue. In addition, the <strong>University</strong> has seen an increase in costs related to maintenance,repair and replacement <strong>of</strong> certain components in its infrastructure and physical plant. These maintenance, repair andreplacement costs, which do not meet the <strong>University</strong>’s capitalization limit <strong>of</strong> $5,000, accounted for approximately $7.4million in additional costs over fiscal year 2004.2 0 0 5 F i n a n c i a l R e p o r t : U n i v e r s i t y o f M i s s o u r ia c o m p o n e n t u n i t o f t h e S t a t e o f M i s s o u r i
Management’s Discussion and Analysis (unaudited)F o r t h e y e a r s e n d e d J u n e 3 0 , 2 0 0 5 a n d 2 0 0 4In addition to their natural classification, it is also informative to review operating expenses by function. The followinggraphic illustration presents total expenses by function for fiscal year <strong>2005</strong>.Fiscal Year 2004 Compared to Fiscal Year 2003Tuition and Fees, net <strong>of</strong> Scholarship Allowances, which include <strong>University</strong> resources used to reduce fees charged tostudents for related services, increased 14.0% or $38.4 million over fiscal year 2003. This was attributable to increasesin enrollment <strong>of</strong> 1.9% and increases in undergraduate and graduate educational fees <strong>of</strong> 3.2% plus $27 per credit hour.As a research institution, the <strong>University</strong> receives a substantial amount <strong>of</strong> funding through Federal, State and PrivateGrants and Contracts. Overall, grant funding remained approximately the same year over year at $259.1 million infiscal year 2004 compared to $259.3 million in fiscal year 2003. Small increases in private grants and contracts were<strong>of</strong>fset by small decreases in Federal and State grant funding.Patient Medical Services, which include services provided by the UHC and related health care units and the <strong>University</strong>Physicians Practice Plan, increased $66.5 million or 15.6% over fiscal year 2003. Of this increase, $5.1 million relatedto the operations <strong>of</strong> the <strong>University</strong> Physicians, with $61.4 million related to UHC.In fiscal year 2003, the <strong>University</strong> experienced a 10% cut <strong>of</strong> $50.5 million to its core appropriations for the State <strong>of</strong><strong>Missouri</strong> plus extraordinary withholdings <strong>of</strong> $28.3 million, resulting in net State Appropriations received <strong>of</strong> $423.3million. In fiscal year 2004, the <strong>University</strong> experienced a further cut <strong>of</strong> 5.5% to its core appropriations. Additionalwithholdings <strong>of</strong> $9.7 million were subsequently released throughout fiscal year 2004, resulting in net State Appropriations<strong>of</strong> $421.4 million, a slight decrease from fiscal year 2003. State Capital Appropriations and State Bond Fundsincreased $40.6 million to $54.2 million in fiscal year 2004 due to the release <strong>of</strong> $34.3 million <strong>of</strong> state bond funds forthe new sport arena on the Columbia campus. The remaining State Capital Appropriations related primarily to funding<strong>of</strong> the Life Sciences Center on the Columbia campus and the Health Sciences Center on the Kansas City campus.Gift income is reflected in three categories: Private Gifts, Capital Gifts (restricted for capital expansion) and PrivateGifts for Endowments (restricted for the establishment <strong>of</strong> endowments). Total gifts to the <strong>University</strong> in fiscal year2004 <strong>of</strong> $74.2 million were approximately equal to $74.3 million in the prior fiscal year. Noncapital private giftsdecreased $6.0 million or 9.9%. Capital Gifts increased $5.9 million largely related to a large pledge for a sports parkon the Columbia campus; <strong>of</strong>fset by a single gift <strong>of</strong> $6.7 million in land received in fiscal year 2003.Capital Grants <strong>of</strong> $2.2 million in fiscal year 2004 and $16.6 million in fiscal year 2003 represented funding receivedfrom Federal and State agencies to be used for the expansion <strong>of</strong> the <strong>University</strong>’s physical plant. The decrease <strong>of</strong> $14.4million in fiscal year 2004 was the direct result <strong>of</strong> the completion <strong>of</strong> the Life Sciences Building on the Columbiacampus, which was partially funded through federal grants.Investment and Endowment Income includes interest and dividend income as well as realized and unrealized gainsand losses. Investment and Endowment Income increased $35.6 million, from $68.9 million in fiscal year 2003 to102 0 0 5 F i n a n c i a l R e p o r t : U n i v e r s i t y o f M i s s o u r ia c o m p o n e n t u n i t o f t h e S t a t e o f M i s s o u r i
Management’s Discussion and Analysis (unaudited)F o r t h e y e a r s e n d e d J u n e 3 0 , 2 0 0 5 a n d 2 0 0 4$104.5 million in fiscal year 2004. The market continued to improve in fiscal year 2004, which resulted in increases inmarket values <strong>of</strong> investments and the recording <strong>of</strong> realized and unrealized net gains in the amount <strong>of</strong> $61.0 million, animprovement <strong>of</strong> $36.0 million over the realized and unrealized gains <strong>of</strong> $25.0 million recorded in fiscal year 2003.Total Operating Expenses reflected a 7.4% or $121.4 million increase over fiscal year 2003, as discussed below.During fiscal year 2004, Salaries and Wages increased approximately 3.0% over fiscal year 2003 primarily due tomerit increases for employees effective September 2003. Staff Benefits showed a significant increase <strong>of</strong> 28.3% yearover year due to increases in the employer costs associated with the <strong>University</strong>’s medical, dental and life premiums, aswell as retirement contributions.The <strong>University</strong>’s expenses related to Supplies, Services and Other Operating costs increased by 9.1% or $42.9 million,to $516.8 million in fiscal year 2004, compared to $473.9 million in fiscal year 2003. A considerable portion <strong>of</strong> thisincrease related to increased patient care operating costs at the UHC which was directly correlated with UHC’s increasein services and patient care revenue. In addition, the <strong>University</strong> has seen an increase in costs related to maintenance,repair and replacement <strong>of</strong> certain components in its infrastructure and physical plant. These maintenance, repair andreplacement costs, which do not meet the <strong>University</strong>’s capitalization limit <strong>of</strong> $5,000, accounted for approximately $15.4million in additional costs over fiscal year 2003. The increase in non-patient care operating costs was approximately7% year over year.STATEMENTS OF CASH FLOWSThe Statements <strong>of</strong> Cash Flows provide information about the <strong>University</strong>’s sources and uses <strong>of</strong> cash and cash equivalentsduring the fiscal year. The following summarizes sources and uses <strong>of</strong> cash and cash equivalents into the four categoriesdefined by GASB for the three years ended June 30, <strong>2005</strong> (in thousands <strong>of</strong> dollars):Fiscal Year<strong>2005</strong>Fiscal Year2004Fiscal Year2003Net Cash Used in Operating Activities $ (298,894) $ (334,212) $ (303,796)Net Cash Provided by Noncapital Financing Activities 538,505 486,553 480,681Net Cash Used in Capital and Related Financing Activities (215,103) (92,891) (179,437)Net Cash Provided by (Used in) Investing Activities 99,628 (117,442) (28,389)Net Increase (Decrease) in Cash and Cash Equivalents 124,136 (57,992) (30,941)Cash and Cash Equivalents, Beginning <strong>of</strong> Year 216,863 274,855 305,796Cash and Cash Equivalents, End <strong>of</strong> Year $ 340,999 $ 216,863 $ 274,855Fiscal Year <strong>2005</strong> Compared to Fiscal Year 2004Net Cash Used in Operating Activities reflects the continued need for funding from the State <strong>of</strong> <strong>Missouri</strong>, as fundingreceived from tuition and fees and related sales and services <strong>of</strong> auxiliary and educational activities are not sufficient tocover operational needs. Cash used in operating activities decreased $35.3 million from $334.2 million in fiscal year2004 to $298.9 million in fiscal year <strong>2005</strong>. This decrease in the use <strong>of</strong> cash was impacted by increases in operatingrevenues such as tuition and fees, patient care revenues and federal, state and private grant revenue.The <strong>University</strong>’s most significant source <strong>of</strong> cash, Net Cash Provided by Noncapital Financing Activities, includesfunds provided by State and Federal appropriations and noncapital private gifts. This funding source <strong>of</strong> $538.5 millionfor fiscal year <strong>2005</strong> and $486.6 million for fiscal year 2004 directly <strong>of</strong>fsets uses <strong>of</strong> funds.Net Cash Used in Capital and Related Financing Activities increased $122.2 million from $92.9 million in fiscalyear 2004 to $215.1 million in fiscal year <strong>2005</strong>. The <strong>University</strong> did not issue new bonds in fiscal year <strong>2005</strong> to <strong>of</strong>fsetfunds used for capital expansion across all campuses. Proceeds used in net capital additions decreased $45.7 million infiscal year <strong>2005</strong> to $202.0 million from $247.7 in fiscal year 2004.2 0 0 5 F i n a n c i a l R e p o r t : U n i v e r s i t y o f M i s s o u r ia c o m p o n e n t u n i t o f t h e S t a t e o f M i s s o u r i 11
Management’s Discussion and Analysis (unaudited)F o r t h e y e a r s e n d e d J u n e 3 0 , 2 0 0 5 a n d 2 0 0 4Net Cash Provided by (Used In) Investing Activities increased $217.1 million from $(117.5) million in fiscal year2004 to $99.6 million in fiscal year <strong>2005</strong>. The <strong>University</strong>’s investment pool was more heavily weighted in short-terminvestments as <strong>of</strong> June 30, <strong>2005</strong>, as a result <strong>of</strong> year-end cash flows. These funds were not used to purchase long-terminvestments at that time.Fiscal Year 2004 Compared to Fiscal Year 2003Net Cash Used in Operating Activities reflects the continued need for funding from the State <strong>of</strong> <strong>Missouri</strong>, as fundingreceived from tuition and fees and related sales and services <strong>of</strong> auxiliary and educational activities are not sufficientto cover operational needs. Cash used in operating activities increased $30.4 million from $303.8 million in fiscal year2003 to $334.2 million in fiscal year 2004. This increase in the use <strong>of</strong> cash was impacted by increases in employeerelatedpayments, principally benefit costs, and operational payments to suppliers. Offsetting operating sources <strong>of</strong> cashincluded increases in tuition and fees and patient care revenues.The <strong>University</strong>’s most significant source <strong>of</strong> cash, Net Cash Provided by Noncapital Financing Activities, includesfunds provided by State and Federal appropriations and noncapital private gifts. This funding source <strong>of</strong> $486.6 millionfor fiscal year 2004 and $480.7 million for fiscal year 2003 directly <strong>of</strong>fset uses <strong>of</strong> funds.Net Cash Used in Capital and Related Financing Activities decreased $86.5 million from $179.4 million in fiscalyear 2003 to $92.9 million in fiscal year 2004. The <strong>University</strong> received proceeds <strong>of</strong> $158.1 million from issuance <strong>of</strong><strong>System</strong> Facilities Revenue Bonds in fiscal year 2004. Proceeds from issuance <strong>of</strong> the bonds were used to advance refundand defease existing bonds in the amount <strong>of</strong> $36.4 million. No new bonds were issued in fiscal year 2003. Proceedsused in net capital additions increased $62.6 million in fiscal year 2004 to $247.7 million from $185.1 in fiscal year 2003primarily due to continued expansion <strong>of</strong> capital assets across all campuses.Net Cash Used in Investing Activities was $117.5 million in fiscal year 2004 versus $28.4 million in fiscal year 2003,an increase <strong>of</strong> $89.1 million. The <strong>University</strong>’s Long-Term Investments increased significantly in fiscal year 2004 as aresult <strong>of</strong> investment <strong>of</strong> proceeds from the issuance <strong>of</strong> bonds and positive total returns experienced in fiscal year 2004.ECONOMIC OUTLOOKThe <strong>University</strong> <strong>of</strong> <strong>Missouri</strong> continues to strengthen its financial position through positive operating results and toprovide quality service to students, patients and citizens across the state <strong>of</strong> <strong>Missouri</strong>. Improvements in the state’seconomic condition and the related increases in tax receipts resulted in a 3.1% increase in the <strong>University</strong>’s core operatingappropriation in fiscal year <strong>2005</strong> after three years <strong>of</strong> extraordinary withholdings and appropriation reductions. Forfiscal year 2006, efforts to bring structural balance to the state’s budget and end the state’s dependence on one-timefunds resulted in no increase in appropriations for higher education. However, because <strong>of</strong> the growth in state revenues,the <strong>University</strong> anticipates no mid-year reductions and is mildly optimistic about future increases in state funding.Fiscal year <strong>2005</strong> was the second year in a row where tuition and fees surpassed state appropriations as the largestsource <strong>of</strong> non-healthcare operating revenues. This is projected to continue in fiscal year 2006 and beyond. The 3.5%increase in tuition for fiscal year 2006 is the lowest in three years; but, continued enrollment growth on all fourcampuses has contributed to the <strong>University</strong>’s ability to balance the budget despite flat state support. Both headcount andfull-time equivalent enrollment reached historic highs in fall 2004 and again in fall <strong>2005</strong>. The <strong>University</strong> <strong>of</strong> <strong>Missouri</strong>,as the state’s research and land-grant institution <strong>of</strong> higher education, enrolls the state’s top students. With the goal <strong>of</strong>addressing the issue <strong>of</strong> access and affordability, <strong>University</strong> <strong>of</strong> <strong>Missouri</strong> President Elson Floyd has initiated a statewidediscussion <strong>of</strong> guaranteed tuition for undergraduates as a means <strong>of</strong> providing cost predictability to students and theirfamilies.Increases in mandatory expenses such as health care benefits, retirement contributions, utilities and insurance, inconjunction with flat state support and rising enrollments, have created a budgetary challenge for the <strong>University</strong>. Tomeet this challenge, the <strong>University</strong> has implemented a variety <strong>of</strong> initiatives to reduce and/or contain costs in such areasas strategic procurement and pharmacy benefits. As a result, over the five-year period from fiscal year 2001 throughfiscal year <strong>2005</strong>, unrestricted expenditures per full-time equivalent student have increased only 5.6%, or 1.4% annually.122 0 0 5 F i n a n c i a l R e p o r t : U n i v e r s i t y o f M i s s o u r ia c o m p o n e n t u n i t o f t h e S t a t e o f M i s s o u r i
Management’s Discussion and Analysis (unaudited)F o r t h e y e a r s e n d e d J u n e 3 0 , 2 0 0 5 a n d 2 0 0 4When adjusted for inflation, total expenditures over five years decreased 3.5%. We expect this trend to continue infiscal year 2006.The <strong>University</strong> <strong>of</strong> <strong>Missouri</strong> Health <strong>System</strong> continues to improve its financial position ending fiscal year <strong>2005</strong> witha 6.3% excess margin providing approximately $30 million for capital projects and other initiatives. This improvedperformance was reflected in the change in the credit outlook from negative to positive by Moody’s Investor Services inApril <strong>2005</strong>. In fiscal year 2006, the Health <strong>System</strong> must manage the financial impact <strong>of</strong> reductions in the state Medicaidprogram. The record hiring <strong>of</strong> specialty physicians and continuing increases in patient census, surgical volumes anddeliveries are projected to bolster performance.The <strong>University</strong> continues to strengthen and diversify its funding sources through effective endowment management,increased private giving and record high external research funding. The <strong>University</strong> <strong>of</strong> <strong>Missouri</strong>-Columbia campusrecently announced that it was extending its capital campaign goal to $1.0 billion after reaching the original goal <strong>of</strong>$600 million six months early. External research funding is at an all time high with a 20% increase in Federal fundingon the Columbia campus. With the addition <strong>of</strong> economic development as a fourth mission <strong>of</strong> the <strong>University</strong>, PresidentElson Floyd recently appointed a vice president for research and economic development to foster partnerships withthe state <strong>of</strong> <strong>Missouri</strong> and the private sector in support <strong>of</strong> economic initiatives that build on the <strong>University</strong>’s researchstrength.2 0 0 5 F i n a n c i a l R e p o r t : U n i v e r s i t y o f M i s s o u r ia c o m p o n e n t u n i t o f t h e S t a t e o f M i s s o u r i 13
I ndependent Auditors’ Report142 0 0 5 F i n a n c i a l R e p o r t : U n i v e r s i t y o f M i s s o u r ia c o m p o n e n t u n i t o f t h e S t a t e o f M i s s o u r i
I ndependent Auditors’ Report2 0 0 5 F i n a n c i a l R e p o r t : U n i v e r s i t y o f M i s s o u r ia c o m p o n e n t u n i t o f t h e S t a t e o f M i s s o u r i 15
S tatements <strong>of</strong> Net AssetsA S O F J u n e 3 0 , 2 0 0 5 A N D 2 0 0 4Discretely Presented<strong>University</strong>Component Units<strong>2005</strong> 2004 <strong>2005</strong> 2004Net AssetsInvested in Capital Assets, Net <strong>of</strong> Related Debt 1,226,962 1,147,472 27,199 17,260Restricted:Nonexpendable -Endowment 555,658 484,370Expendable -Scholarships, Research, Instruction and Other 239,585 200,641 1,640 4,875Loans 75,670 74,964Capital Projects 20,214 30,051Unrestricted 685,945 641,550 57,568 56,052Total Net Assets 2,804,034 2,579,048 86,407 78,187Total Liabilities and Net Assets $ 3,831,359 $ 3,580,915 $ 150,046 $ 139,730See notes to the financial statements.2 0 0 5 F i n a n c i a l R e p o r t : U n i v e r s i t y o f M i s s o u r ia c o m p o n e n t u n i t o f t h e S t a t e o f M i s s o u r i 17
This page is intentionally left blank.182 0 0 5 F i n a n c i a l R e p o r t : U n i v e r s i t y o f M i s s o u r ia c o m p o n e n t u n i t o f t h e S t a t e o f M i s s o u r i
Statements <strong>of</strong> Revenues, Expenses and Changes in Net AssetsF O R T H E Y E A R S E N D E D J u n e 3 0 , 2 0 0 5 A N D 2 0 0 4(in thousands <strong>of</strong> dollars)Discretely Presented<strong>University</strong>Component Units<strong>2005</strong> 2004 <strong>2005</strong> 2004Operating Revenues:Tuition and Fees (Net <strong>of</strong> Provision for DoubtfulAccounts <strong>of</strong> $4,609 in <strong>2005</strong> and $4,858 in 2004) $ 471,240 $ 428,162 $ - $ -Less: Scholarship Allowances 115,724 116,384Net Tuition and Fees 355,516 311,778 - -Federal Grants and Contracts 193,473 170,542State and Local Grants and Contracts 43,638 35,434Private Grants and Contracts 56,774 53,116Sales and Services <strong>of</strong> Educational Activities 17,920 16,640Auxiliary Enterprises -Patient Medical Services, Net 566,394 492,229 160,947 153,762Housing and Dining Services (Net <strong>of</strong> ScholarshipAllowance <strong>of</strong> $490 in <strong>2005</strong> and $389 in 2004) 57,730 53,462Bookstores 50,422 44,373Other Auxiliary Enterprises (Net <strong>of</strong> ScholarshipAllowance <strong>of</strong> $5,472 in <strong>2005</strong> and $4,394 in 2004) 128,065 116,786Notes Receivable Interest Income, Net <strong>of</strong> Fees 855 1,580Other Operating Revenues 62,022 47,181Total Operating Revenues 1,532,809 1,343,121 160,947 153,762Operating Expenses:Salaries and Wages 987,240 919,594 46,952 44,246Staff Benefits 226,969 214,178 12,018 10,692Supplies, Services and Other Operating Expenses 596,395 516,766 87,365 87,362Scholarships and Fellowships 30,783 25,755Depreciation 102,414 89,774 7,758 7,296Total Operating Expenses 1,943,801 1,766,067 154,093 149,596Operating Income (Loss) (410,992) (422,946) 6,854 4,166State Appropriations 430,127 421,434Income after State Appropriations, beforeNonoperating Revenues (Expenses) 19,135 (1,512) 6,854 4,166Nonoperating Revenues (Expenses):Federal Appropriations 15,776 14,602Investment and Endowment Income, Net <strong>of</strong> Fees 89,236 104,486 1,024 300Private Gifts 73,504 36,143 42 203Interest Expense (23,497) (23,785) (1,340) (1,236)Other Nonoperating Revenues (Expenses) (1,261) (1,444) 1,640Net Nonoperating Revenues (Expenses) 153,758 130,002 1,366 (733)Income before Capital Contributions and Additions toPermanent Endowments 172,893 128,490 8,220 3,433State Capital Appropriations and State Bond Funds 4,686 54,239Capital Gifts and Grants 13,056 21,749Private Gifts for Endowment Purposes 34,351 18,506Increase in Net Assets 224,986 222,984 8,220 3,433Net Assets, Beginning <strong>of</strong> Year 2,579,048 2,356,064 78,187 74,754Net Assets, End <strong>of</strong> Year $ 2,804,034 $ 2,579,048 $ 86,407 $ 78,187See notes to the financial statements.2 0 0 5 F i n a n c i a l R e p o r t : U n i v e r s i t y o f M i s s o u r ia c o m p o n e n t u n i t o f t h e S t a t e o f M i s s o u r i 19
S Ftatements <strong>of</strong> Cash FlowsO R T H E Y E A R S E N D E D J u n e 3 0 , 2 0 0 5 A N D 2 0 0 4(in thousands <strong>of</strong> dollars)<strong>2005</strong> 2004Cash Flows from Operating Activities:Tuition and Fees $ 336,011 $ 321,506Federal, State and Private Grants and Contracts 288,307 271,356Sales and Services <strong>of</strong> Educational Activities andOther Auxiliaries 174,492 130,647Patient Care Revenues 558,141 479,750Student Housing Fees 57,732 53,867Bookstore Collections 50,058 44,126Payments to Suppliers (584,618) (515,431)Payments to Employees (981,507) (922,159)Payments for Benefits (226,969) (214,178)Payments for Scholarships and Fellowships (30,783) (25,755)Student Loans Issued (16,718) (14,487)Student Loans Collected 13,778 13,813Student Loan Interest and Fees 1,160 1,153Other Receipts, Net 62,022 41,580Net Cash Used in Operating Activities (298,894) (334,212)Cash Flows from Noncapital Financing Activities:State Appropriations 430,141 421,460Federal Appropriations 15,776 14,602Private Gifts 58,016 7,243Endowment and Similar Funds Gifts 34,351 18,506Other Payments (1,261) (1,444)Deposits <strong>of</strong> Affiliates 1,482 26,186Net Cash Provided by Noncapital Financing Activities 538,505 486,553Cash Flows from Capital and Related Financing Activities:Capital State Appropriations 7,377 18,641Capital Gifts and Grants 13,056 45,067Proceeds from Sales <strong>of</strong> Capital Assets 9,525 3,138Purchase <strong>of</strong> Capital Assets (211,567) (250,880)Proceeds from Issuance <strong>of</strong> Capital Debt, Net 159,267Principal Payments on Capital Debt (11,620) (10,773)Proceeds from Capital Project Notes 1,600 3,360Payments on Capital Lease (361) (332)Escrow Deposit on Defeasance (37,346)Payments on Cost <strong>of</strong> Debt Issuance (821)Interest Payments on Capital Debt (23,113) (22,212)Net Cash Used in Capital and Related Financing Activities (215,103) (92,891)Cash Flows from Investing Activities:Interest and Dividends on Investments 51,598 56,424Purchase <strong>of</strong> Investments, Net <strong>of</strong> Sales and Maturities 48,190 (176,643)Other Investing Actitities (160) 2,777Net Cash Provided by (Used in) Investing Activities 99,628 (117,442)Net Increase (Decrease) in Cash and Cash Equivalents 124,136 (57,992)Cash and Cash Equivalents, Beginning <strong>of</strong> Year 216,863 274,855Cash and Cash Equivalents, End <strong>of</strong> Year $ 340,999 $ 216,863(continued)202 0 0 5 F i n a n c i a l R e p o r t : U n i v e r s i t y o f M i s s o u r ia c o m p o n e n t u n i t o f t h e S t a t e o f M i s s o u r i
S Ftatements <strong>of</strong> Cash FlowsO R T H E Y E A R S E N D E D J u n e 3 0 , 2 0 0 5 A N D 2 0 0 4(in thousands <strong>of</strong> dollars)<strong>2005</strong> 2004Reconciliation <strong>of</strong> Operating Loss Used in Operating Activities:Operating Loss $ (410,992) $ (422,946)Adjustments to Net Cash Used in Operating Activities -Depreciation Expense 102,414 89,774Changes in Assets and Liabilities:Accounts Receivable, Net (3,422) (363)Inventory, Prepaid Expenses and Other Assets 699 (1,230)Notes Receivable (2,635) (1,101)Accounts Payable 1,884 (12,374)Accrued Liabilities 14,927 7,980Deferred Revenue (1,769) 6,048Net Cash Used in Operating Activities $ (298,894) $ (334,212)Supplemental Disclosure <strong>of</strong> Noncash Activities:Gifts <strong>of</strong> Noncash Assets and Capital Assets $ - $ 5,600Net Increase in Fair Value <strong>of</strong> Investments $ (6,447) $ 23,400See notes to the financial statements.2 0 0 5 F i n a n c i a l R e p o r t : U n i v e r s i t y o f M i s s o u r ia c o m p o n e n t u n i t o f t h e S t a t e o f M i s s o u r i 21
SAssetstatements <strong>of</strong> Net Assets Held for Pension BenefitsA S O F J u n e 3 0 , 2 0 0 5 A N D 2 0 0 4(in thousands <strong>of</strong> dollars)<strong>2005</strong> 2004Cash and Cash Equivalents $ 50,039 $ 41,955Collateral for Securities Lending 173,580 149,917Due from the <strong>University</strong> <strong>of</strong> <strong>Missouri</strong> <strong>System</strong> 4 76Investment Settlements Receivable 22,594 16,647Investments:Government Obligations 301,689 292,881Corporate Bonds and Notes 109,375 108,304Corporate Stocks 1,783,813 1,333,402Other 33,282 351,264Total Assets 2,474,376 2,294,446LiabilitiesAccounts Payable and Accrued Liabilities 2,228 1,768Collateral for Securities Lending 173,580 149,917Investment Settlements Payables 53,255 61,236Total Liabilities 229,063 212,921Net Assets Held for Pension Benefits $ 2,245,313 $ 2,081,525S tatements <strong>of</strong> Changes in Net Assets Held for Pension BenefitsNet Revenues and Other Additions(in thousands <strong>of</strong> dollars)<strong>2005</strong> 2004Investment Income:Interest and Dividend Income, Net <strong>of</strong> Fees $ 41,423 $ 26,929Net Appreciation in Fair Value <strong>of</strong> Investments 177,105 298,720Net Investment Income 218,528 325,649<strong>University</strong> Contribution 49,075 48,521Total Net Revenues and Other Additions 267,603 374,170Expenses and Other DeductionsF o r t h e y e a r s e n d e d J u n e 3 0 , 2 0 0 5 A N D 2 0 0 4Administrative Expenses 1,457 1,363Payments to Retirees and Beneficiaries 102,358 100,185Total Expenses and Other Deductions 103,815 101,548Increase in Net Assets Held for Pension Benefits 163,788 272,622Net Assets Held for Pension Benefits, Beginning <strong>of</strong> Year 2,081,525 1,808,903Net Assets Held for Pension Benefits, End <strong>of</strong> Year $ 2,245,313 $ 2,081,525See notes to the financial statements.222 0 0 5 F i n a n c i a l R e p o r t : U n i v e r s i t y o f M i s s o u r ia c o m p o n e n t u n i t o f t h e S t a t e o f M i s s o u r i
N otes to Combined Financial StatementsF o r t h e y e a r s e n d e d J u n e 3 0 , 2 0 0 5 a n d 2 0 0 41. ORGANIZATION AND SUMMARY OF SIGNIFICANT ACCOUNTING POLICIES<strong>University</strong> <strong>of</strong> <strong>Missouri</strong>Organization – The <strong>University</strong> <strong>of</strong> <strong>Missouri</strong> (the “<strong>University</strong>”), a Federal land grant institution, conducts education,research and public service and related activities principally at its four campuses in Columbia, Kansas City, Rollaand St. Louis, which include the <strong>University</strong> <strong>of</strong> <strong>Missouri</strong> Hospitals and Clinics and related health care facilities. The<strong>University</strong> also administers a statewide cooperative extension service with centers located in each county in the State.The <strong>University</strong> is a component unit <strong>of</strong> the State <strong>of</strong> <strong>Missouri</strong> (the “State”) and is governed by an appointed nine-memberBoard <strong>of</strong> Curators.Reporting Entity –As defined by generally accepted accounting principles established by the Governmental AccountingStandards Board (“GASB”), the financial reporting entity consists <strong>of</strong> the primary government and its component units.Component units are legally separate organizations for which the primary government is financially accountable orthe nature and significance <strong>of</strong> their relationships with the primary government are such that exclusion would cause theprimary government’s financial statements to be misleading or incomplete.The following entities are considered component units <strong>of</strong> the <strong>University</strong> according to the criteria in GASB StatementNo. 14, The Financial Reporting Entity and are discretely presented in the <strong>University</strong>’s financial statements.• The <strong>University</strong> <strong>of</strong> <strong>Missouri</strong>-Columbia Medical Alliance (the “Medical Alliance”), a not-for-pr<strong>of</strong>it corporation,provides an integrated health care delivery system for mid-<strong>Missouri</strong> by establishing affiliations with variousmedical facilities. Capital Region Medical Center (“CRMC”) in Jefferson City, <strong>Missouri</strong>, operates as an affiliate <strong>of</strong>the Medical Alliance and provides inpatient, outpatient and emergency care services to the surrounding community.CRMC is a discretely presented component unit <strong>of</strong> the Medical Alliance and CRMC is a not-for-pr<strong>of</strong>it organizationthat follows generally accepted accounting principles under the Financial Accounting Standards Board (“FASB”).The purpose <strong>of</strong> the Medical Alliance is to develop a network <strong>of</strong> healthcare providers to support the missions <strong>of</strong> the<strong>University</strong> <strong>of</strong> <strong>Missouri</strong> Healthcare. The <strong>University</strong> appoints the Board <strong>of</strong> Directors <strong>of</strong> the Medical Alliance and canimpose its will on the organization.• <strong>Missouri</strong> Care L.C. is a not-for-pr<strong>of</strong>it health maintenance organization which provides services to patients in central<strong>Missouri</strong> under a certification from the <strong>Missouri</strong> Department <strong>of</strong> Social Services. <strong>Missouri</strong> Care L.C. has contractedwith the <strong>University</strong> <strong>of</strong> <strong>Missouri</strong> Healthcare <strong>System</strong> as a major provider <strong>of</strong> health care services to the organization’smembers. <strong>Missouri</strong> Care L.C. is organized exclusively for charitable purposes, in particular, to benefit its solemember, the Curators <strong>of</strong> the <strong>University</strong> <strong>of</strong> <strong>Missouri</strong>. The <strong>University</strong> appoints the Board <strong>of</strong> Directors <strong>of</strong> <strong>Missouri</strong>Care L.C. and can impose its will on the organization.Complete financial statements for <strong>Missouri</strong> Care L.C. are available at the <strong>University</strong> <strong>of</strong> <strong>Missouri</strong>, 118 <strong>University</strong> Hall,Columbia, MO 65211. Financial statements for Medical Alliance are not available.The <strong>University</strong> operates the <strong>University</strong> <strong>of</strong> <strong>Missouri</strong> Retirement, Disability and Death Benefit Plan (the “Plan”), whichis a single employer, defined benefit plan. The assets <strong>of</strong> the Plan are held in trust and are restricted for use only to payfor benefits and expenses <strong>of</strong> the Plan. The Plan is reported as a fiduciary fund <strong>of</strong> the <strong>University</strong>.Financial Statement Presentation – In accordance with GASB Statement No. 20, Accounting and Financial Reportingfor Proprietary Funds and Other Governmental Entities That Use Proprietary Fund Accounting, the <strong>University</strong>is required to follow all applicable GASB pronouncements. In addition, the <strong>University</strong> applies all applicable FASBStatements and Interpretations, Accounting Principles Board Opinions and Accounting Research Bulletins issued onor before November 30, 1989, except those that conflict with a GASB pronouncement. The <strong>University</strong> has elected notto apply FASB pronouncements issued after November 30, 1989.The <strong>University</strong> has adopted GASB Statement No. 35, Basic Financial Statement–and Management’s Discussion andAnalysis–for Public Colleges and Universities, as amended by GASB Statements No. 37 and No. 38. GASB StatementNo. 35 establishes standards for external financial reporting for public colleges and universities. The financial statement2 0 0 5 F i n a n c i a l R e p o r t : U n i v e r s i t y o f M i s s o u r ia c o m p o n e n t u n i t o f t h e S t a t e o f M i s s o u r i 23
N otes to Combined Financial StatementsF o r t h e y e a r s e n d e d J u n e 3 0 , 2 0 0 5 a n d 2 0 0 4financial statement purposes. Proceeds from the sale, exchange, or other disposal <strong>of</strong> any item belonging to a collection<strong>of</strong> historical treasures must be applied to the acquisition <strong>of</strong> additional items for the same collection.Deferred Revenue – Deferred revenues include amounts received for tuition and fees and certain auxiliary activitiesprior to the end <strong>of</strong> the fiscal year but related to the subsequent accounting period. Deferred revenues also includeamounts received from grant and contract sponsors that have not yet been earned.Net Assets – The <strong>University</strong>’s net assets are classified for financial reporting in the following net asset categories:• Invested in capital assets, net <strong>of</strong> related debt: This component <strong>of</strong> net assets includes capital assets, net <strong>of</strong>accumulated depreciation and outstanding principal debt balances related to the acquisition, construction orimprovement <strong>of</strong> those assets.• Restricted:Nonexpendable – Net assets subject to externally imposed stipulations that they be maintained permanently bythe <strong>University</strong>. Such assets include the <strong>University</strong>’s permanent endowment funds. The <strong>University</strong>’s policy permitsany realized and unrealized appreciation on the endowments to remain with the endowment after the 5% spendingdistribution discussed in Note 3.Expendable – Net assets whose use by the <strong>University</strong> is subject to externally imposed stipulations that can befulfilled by actions <strong>of</strong> the <strong>University</strong> pursuant to those stipulations or that expire by the passage <strong>of</strong> time.• Unrestricted: Net assets that are not subject to externally imposed stipulations. Unrestricted net assets may bedesignated for specific purposes by action <strong>of</strong> management or the Board <strong>of</strong> Curators. When an expense is incurredthat can be paid using either restricted or unrestricted resources, the <strong>University</strong>’s policy is to first apply the expensetowards restricted resources, and then towards unrestricted resources. Unrestricted net assets are used for expensesfor academics and general operation <strong>of</strong> the <strong>University</strong>.Scholarship Allowance – Tuition and fees and related housing, dining and other auxiliary enterprises revenues arepresented net <strong>of</strong> scholarships and fellowships applied to student accounts, while scholarships, fellowships and otherpayments made directly to students are presented as scholarship and fellowship expenses.Patient Medical Services, Net – Patient medical services revenues are reported net <strong>of</strong> contractual allowances andbad debt. Patient medical services are primarily provided through <strong>University</strong> <strong>of</strong> <strong>Missouri</strong> Hospitals and Clinics,Ellis Fischel Cancer Research Center, Columbia Regional Hospital, <strong>Missouri</strong> Rehabilitation Center and <strong>University</strong>Physicians (collectively, the “<strong>University</strong> <strong>of</strong> <strong>Missouri</strong> Healthcare”).The <strong>University</strong> <strong>of</strong> <strong>Missouri</strong> Healthcare has agreements with third-party payors that provide for payments at amountsdifferent from established rates. Payment arrangements include prospectively determined rates per discharge, reimbursedcosts, discount charges and per diem payments. Patient medical services revenue is reported at the estimated netrealizable amounts from patients, third-party payors, and others for services rendered, including estimated retroactiveadjustments under reimbursement agreements with third-party payors. Retroactive adjustments are accrued on anestimated basis in the period the related services are rendered and adjusted in future periods as estimates are refinedand final settlements are determined. Patient medical services revenue is also shown net <strong>of</strong> estimated uncollectibleaccounts.Amounts receivable under Medicare and Medicaid reimbursements agreements are subject to examination andcertain retroactive adjustments by the related programs. These adjustments increased net patient services revenues by$5,518,000 and $4,001,000 for the years ended June 30, <strong>2005</strong> and 2004, respectively.2 0 0 5 F i n a n c i a l R e p o r t : U n i v e r s i t y o f M i s s o u r ia c o m p o n e n t u n i t o f t h e S t a t e o f M i s s o u r i 25
N otes to Combined Financial StatementsF o r t h e y e a r s e n d e d J u n e 3 0 , 2 0 0 5 a n d 2 0 0 4A percentage breakdown <strong>of</strong> gross patient accounts receivable by major payer classification <strong>of</strong> the <strong>University</strong> <strong>of</strong> <strong>Missouri</strong>Healthcare for the years ended June 30, <strong>2005</strong> and 2004, is as follows:<strong>2005</strong> 2004Medicare 29% 22%Commercial Insurance 10% 9%Medicaid 24% 21%Self Pay and Other 11% 13%Managed Care Agreements 26% 35%100% 100%The gross to net patient medical services revenue detail is reflected below for fiscal years <strong>2005</strong> and 2004. The Statements<strong>of</strong> Revenues, Expenses and Changes in Net Assets reflect net patient medical services revenue as follows (in thousands<strong>of</strong> dollars):<strong>2005</strong> 2004Patient Medical Services Revenue, Gross $ 1,063,495 $ 900,419Less Deductions for Contractuals (464,970) (385,174)Less Bad Debt Deductions (32,131) (23,016)Patient Medical Services Revenue, Net $ 566,394 $ 492,229Interest Rate Swap Agreements – The <strong>University</strong> enters into interest rate swap agreements to modify interest rateson outstanding debt. Other than the net payments resulting from those agreements, no amounts related to the interestrate swaps are recorded in the financial statements.New Accounting Pronouncements – The GASB issued GASB Statement No. 42, Accounting and Financial Reportingfor Impairment <strong>of</strong> Capital Assets and for Insurance Recoveries, effective for fiscal years beginning after December15, 2004. This statement establishes accounting and financial reporting standards for impairment <strong>of</strong> capital assets, aswell as clarifying and establishing accounting requirements for insurance recoveries. Impairment <strong>of</strong> a capital assetmay be the result <strong>of</strong> physical damage, technology changes, obsolescence, and construction stoppage. If impairment isdetermined to exist, the capital asset may be revalued and disclosed in accordance with the provisions <strong>of</strong> the statement.The <strong>University</strong> has not yet determined the effect that adoption <strong>of</strong> GASB Statement No. 42 may have on the financialstatements.The GASB issued GASB Statement No. 43, Financial Reporting for Postemployment Benefit Plans other thanPension Plans, effective for fiscal years beginning after December 15, <strong>2005</strong> and GASB Statement No. 45, Accountingand Financial Reporting by Employers for Postemployment Benefits other than Pensions, effective for fiscal yearsbeginning after December 15, 2006. The <strong>University</strong>’s postemployment benefit plan is self-insured and managed by the<strong>University</strong>; therefore, both statements are applicable. The statements provide standards for measurement, recognitionand display <strong>of</strong> other postemployment benefit expenditures, assets, and liabilities, including applicable note disclosuresand supplementary information. The <strong>University</strong> has not yet determined the effect that adoption <strong>of</strong> GASB Statement No.43 and GASB Statement No. 45 may have on the financial statements.The GASB has also issued GASB Statement No. 46, Net Assets Restricted by Enabling Legislation, effective for fiscalyears beginning after June 15, <strong>2005</strong>. This statement provides guidance to governments for determining when netassets have been restricted to a particular use by the passage <strong>of</strong> enabling legislation and specifies how those net assetsshould be reported in financial statements when there are changes in the circumstances surrounding such legislation.Enabling legislation is a specific type <strong>of</strong> legislation that both authorizes the raising <strong>of</strong> new resources and imposes legallyenforceable limits on how they may be used. This statement also requires governments to disclose in the notes to thefinancial statements the amount <strong>of</strong> net assets restricted by enabling legislation. The <strong>University</strong> has not yet determinedthe effect that adoption <strong>of</strong> GASB Statement No. 46 may have on the financial statements.The GASB has also issued GASB Statement No. 47, Accounting for Termination Benefits, effective for fiscal yearsbeginning after June 15, <strong>2005</strong>. The statement provides accounting and reporting guidance for entities that <strong>of</strong>fer benefits262 0 0 5 F i n a n c i a l R e p o r t : U n i v e r s i t y o f M i s s o u r ia c o m p o n e n t u n i t o f t h e S t a t e o f M i s s o u r i
N otes to Combined Financial StatementsF o r t h e y e a r s e n d e d J u n e 3 0 , 2 0 0 5 a n d 2 0 0 42. CASH AND CASH EQUIVALENTSCash & Cash Equivalents – <strong>University</strong> – The <strong>University</strong>’s cash and cash equivalents include bank deposits, repurchaseagreements and investments maturing in three months or less.Custodial Credit Risk – Deposits – <strong>University</strong> – The custodial credit risk for deposits is the risk that in the event <strong>of</strong>bank failure, the <strong>University</strong>’s deposits may not be recovered. State law requires collateralization <strong>of</strong> all deposits withfederal depository insurance, bonds and other obligations <strong>of</strong> the U.S. Treasury, U.S. Agencies and instrumentalities <strong>of</strong>the state <strong>of</strong> <strong>Missouri</strong>; bonds <strong>of</strong> any city, county, school district or special road district <strong>of</strong> the state <strong>of</strong> <strong>Missouri</strong>; bonds <strong>of</strong>any state; or a surety bond having an aggregate value at least equal to the amount <strong>of</strong> the deposits. The following chartpresents cash and cash equivalent deposits balances as <strong>of</strong> June 30, <strong>2005</strong> (in thousands <strong>of</strong> dollars):<strong>2005</strong>Uninsured andUncollateralizedUnsecured andCollateralized withSecurities held byPledging Institution’sTrust Department Notin the <strong>University</strong>’sNameCollateralizedand Fully InsuredBank BalancesTotal CarryingValueCash and Cash EquivalentDeposits $ 532 $ - $ 148,974 $ 149,506Total $ 532 $ - $ 148,974 $ 149,506Custodial Credit Risk – Deposits – <strong>University</strong> <strong>of</strong> <strong>Missouri</strong> Retirement Trust – The <strong>University</strong> <strong>of</strong> <strong>Missouri</strong>Retirement Trust held deposits, consisting <strong>of</strong> cash and cash equivalents in the amount <strong>of</strong> $211,062,000 as <strong>of</strong> June 30,<strong>2005</strong>. These balances are fully secured and collateralized and are not exposed to custodial credit risk.3. INVESTMENTS<strong>University</strong> <strong>of</strong> <strong>Missouri</strong>Investments - The investment policies <strong>of</strong> the <strong>University</strong> are established by its governing board, the Board <strong>of</strong> Curators.The policies are established to ensure that the <strong>University</strong> funds are managed in accordance with Section 105.688 <strong>of</strong> theRevised Statutes <strong>of</strong> <strong>Missouri</strong>. Investments for the <strong>University</strong> are managed in two major categories:Pooled General Investments – The general investment pools, managed by the <strong>University</strong>, averaged a total return <strong>of</strong>3.53% and .87%, including unrealized gains and losses, for the years ended June 30, <strong>2005</strong> and 2004, respectively.Pooled Endowment Investments – Endowment and similar funds are pooled for investment purposes when appropriateand permissible. The investment objective is to achieve long-term total returns sufficient to preserve principal, afteradjusting for inflation, and to meet the endowment spending targets. The endowment pools, managed by outsidemanagers, are the balanced pool and the fixed income pool and earned a total return <strong>of</strong> 9.6% and 4.8%, respectively,including unrealized gains and losses, for the year ended June 30, <strong>2005</strong>, and 17.4% and 0.0%, respectively, for the yearended June 30, 2004.If the donor has not provided specific instructions or restrictions, state law permits the Board <strong>of</strong> Curators to appropriatefor expenditure an amount <strong>of</strong> net appreciation, realized and unrealized, <strong>of</strong> the investments <strong>of</strong> endowment funds asthe Board considers to be prudent. When administering the power to spend net appreciation, the Board is requiredto consider the <strong>University</strong>’s long- and short-term needs, present and anticipated financial requirements, expectedtotal return on its investments, price level trends, and general economic conditions. Any net appreciation expended isrequired to be spent for the purposes for which the endowment was established. The net appreciation on investments <strong>of</strong>donor-restricted endowments authorized for expenditure in fiscal year <strong>2005</strong> is approximately $26,949,000.The Board <strong>of</strong> Curators has adopted a total return philosophy in determining the spendable return for the endowmentsand similar funds. The spending formula distributes annually 5% <strong>of</strong> a trailing 12-quarter average <strong>of</strong> the endowment’stotal market value, with the understanding that this spending rate over the long term will not exceed total real return282 0 0 5 F i n a n c i a l R e p o r t : U n i v e r s i t y o f M i s s o u r ia c o m p o n e n t u n i t o f t h e S t a t e o f M i s s o u r i
N otes to Combined Financial StatementsF o r t h e y e a r s e n d e d J u n e 3 0 , 2 0 0 5 a n d 2 0 0 4(net <strong>of</strong> inflations) from investments. However, to achieve uniformity in amounts to spend from one year to the next,the actual amount available to spend in any given year will not be less than 96% or more than 106% <strong>of</strong> the prior year’sexpenditure.At June 30, <strong>2005</strong>, the <strong>University</strong> held investments, by investment type, as follows (in thousands <strong>of</strong> dollars):Carrying Valueas <strong>of</strong>June 30, <strong>2005</strong>Government Obligations $ 571,579Corporate Bonds and Notes 197,249Corporate Stocks 563,042Other 22,519Total Short-Term and Long-Term Investments 1,354,389Commercial Paper 179,590Repurchase Agreements 11,903Total Cash and Cash Equivalents 191,493Total Investments $ 1,545,882Custodial Credit Risk – The custodial credit risk for investments is the risk that in the event <strong>of</strong> failure <strong>of</strong> thecounterparty to a transaction, the <strong>University</strong> will not be able to recover the value <strong>of</strong> the investments. In accordance with<strong>University</strong> policy, the <strong>University</strong> minimizes its custodial credit risk on deposits by establishing limitations on the types<strong>of</strong> instruments held with qualifying institutions. Repurchase agreements must be collateralized by U.S. Governmentissues and/or U.S. Government Agency issues. Certificates <strong>of</strong> deposit must be collateralized and held at a bank withwhich the <strong>University</strong> has a depository agreement. The <strong>University</strong>’s investment <strong>of</strong> $179,590,000 in commercial paper isuninsured and uncollaterialized. The <strong>University</strong>’s investment <strong>of</strong> $11,903,000 in repurchase agreements is held by theinvestment’s counterparty, not in the name <strong>of</strong> the <strong>University</strong>. All <strong>of</strong> the remaining <strong>University</strong> investments are insuredand registered and are held by the <strong>University</strong> or an agent in its name.Interest Rate Risk – Interest rate risk is the risk that changes in interest rates will adversely affect the fair value <strong>of</strong> aninvestment. The <strong>University</strong>’s Pooled General Investments consist primarily <strong>of</strong> fixed income securities, with a specificlimitation that no more than 15% <strong>of</strong> the pool consists <strong>of</strong> variable rate securities. As a means <strong>of</strong> ensuring the safety <strong>of</strong>principal invested in the Pooled Endowment Investments, the <strong>University</strong>’s investment policy requires diversification<strong>of</strong> the investment portfolio.At June 30, <strong>2005</strong>, the maturities <strong>of</strong> the <strong>University</strong>’s investments are as follows (in thousands <strong>of</strong> dollars):As <strong>of</strong> June 30, <strong>2005</strong>Less than1 Year 1-5 Years 6-10 YearsMore than10 Years Carrying ValueU.S. Agency Obligations $ 141,148 $ 263,293 $ 33,964 $ 15,364 $ 453,769U.S. Treasury Obligations 6,248 27,162 8,221 9,834 51,465Foreign Government Obligations 637 30,807 22,997 11,904 66,345U.S. Corporate Bonds & Notes 55,945 101,741 12,340 6,121 176,147Foreign Corporate Bonds & Notes 1,952 6,979 7,050 5,121 21,102Total $ 205,930 $ 429,982 $ 84,572 $ 48,344 $ 768,828Credit Risk – The credit risk <strong>of</strong> investments is the risk that the issuer or other counterparty will not meet its obligations.This credit risk is typically measured by the credit quality ratings <strong>of</strong> investments in debt securities as described by anational recognized statistical rating organization such as Standard and Poor’s (S&P) and Moody’s. For portions <strong>of</strong> the<strong>University</strong>’s investments, specifically the Endowment Fund, the <strong>University</strong>’s policy states that investments in corporatebonds and other fixed income securities must have an S&P rating <strong>of</strong> A or better.2 0 0 5 F i n a n c i a l R e p o r t : U n i v e r s i t y o f M i s s o u r ia c o m p o n e n t u n i t o f t h e S t a t e o f M i s s o u r i 29
N otes to Combined Financial StatementsF o r t h e y e a r s e n d e d J u n e 3 0 , 2 0 0 5 a n d 2 0 0 4However, the <strong>University</strong> has elected to use Moody’s Investors Service investment ratings in the following Credit Riskreport. Several securities within the Pooled Endowment have Moody’s ratings <strong>of</strong> Baa or Ba and Standard and Poor’sratings in the A range (A-, A, & A+), which places those bonds within the parameters specified in the <strong>University</strong>’spolicy.The following represents the <strong>University</strong>’s investment exposure to credit risk, based on Moody’s investment ratings (inthousands <strong>of</strong> dollars):As <strong>of</strong> June 30, <strong>2005</strong>Aaa Aa A Baa Ba Unrated TotalU.S. Agency Obligations $ 377,698 $ 54,979 $ 35 $ - $ - $ 21,057 $ 453,769U.S. Treasury Obligations 51,465 51,465Foreign Government Obligations 50,083 1,331 11,582 3,349 66,345U.S. Corporate Bonds & Notes 22,870 67,706 82,691 245 2,635 176,147Foreign Corporate Bonds & Notes 11,315 2,877 3,189 680 3,041 21,102Total $ 461,966 $ 126,893 $ 97,497 $ 925 $ - $ 81,547 $ 768,828Foreign Currency Risk – Foreign currency risk is the risk that changes in exchange rates will adversely affect the fairvalue <strong>of</strong> a foreign investment. <strong>University</strong> policy allows 15-25% <strong>of</strong> the investment portfolio to be invested in internationalinvestments (12.1% and 12.2% denominated in foreign currency in fiscal years <strong>2005</strong> and 2004, respectively). To reducethe risk related to fluctuations in currency exchange rates, the <strong>University</strong> has entered into forward foreign currencycontracts throughout the year. As <strong>of</strong> June 30, <strong>2005</strong> and 2004, 4.7% or $63,383,000 and 4.6% or $61,571,000, respectively,<strong>of</strong> the <strong>University</strong>’s total investment portfolio is invested in forward foreign currency contracts. These contracts aremarked to market and the changes in their market value are recorded in investment and endowment income on theStatements <strong>of</strong> Revenues, Expenses and Changes in Net Assets. The following represents the <strong>University</strong>’s exposure t<strong>of</strong>oreign currency risk (in thousands <strong>of</strong> dollars):Foreign Currency RiskInternational Investment Securities at Fair Value(in thousands <strong>of</strong> dollars)Currency <strong>2005</strong>Australian Dollar $ 2,856British Pound Sterling 27,112Canadian Dollar 2,814Chilean Peso 21Danish Krone 911Euro 65,203Hong Kong Dollar 2,978Israeli Shekel 166Japanese Yen 42,062Mexican New Peso 301New Taiwan Dollar 42New Zealand Dollar 67Norwegian Krone 589Polish Zloty 135South African Comm Rand 425Singapore Dollar 898South Korean Won 98Swedish Krona 4,527Swiss Franc 12,124Total $ 163,329302 0 0 5 F i n a n c i a l R e p o r t : U n i v e r s i t y o f M i s s o u r ia c o m p o n e n t u n i t o f t h e S t a t e o f M i s s o u r i
N otes to Combined Financial StatementsF o r t h e y e a r s e n d e d J u n e 3 0 , 2 0 0 5 a n d 2 0 0 4Concentration <strong>of</strong> Credit Risk – The concentration <strong>of</strong> credit risk is the risk <strong>of</strong> loss that may occur due to the amount<strong>of</strong> investments in a single issuer (not including investments issued or guaranteed by the U.S. government, investmentsin mutual funds, or external investment pools).For <strong>University</strong> funds invested through the Pooled General Investments category the following restrictions apply:1) Corporate Bonds should not exceed 20% <strong>of</strong> the portfolio; 2) Variable Rate securities should not exceed 15% <strong>of</strong>the portfolio; and 3) Investments in obligations <strong>of</strong> the U.S. Government, U.S. Government Agency issues or U.S.Government guaranteed securities is unlimited.For <strong>University</strong> funds invested through the Pooled Endowment Investments category, target asset mixes are assessedand evaluated to ensure diversification. The investment policy allows for a portfolio consisting <strong>of</strong> no more than 47.5%U.S. equity, 25% international equity, 10% emerging markets equity, 10% alternative investments (maximum <strong>of</strong> 5.0%in hedge funds), 10% real estate and 27.5% global fixed income.Portions <strong>of</strong> the Pooled Endowment Investments are invested in a fixed income fund, called the Fixed Income Pool,which, due to donor restrictions, can only be invested in fixed income securities. Investments in this portfolio consist<strong>of</strong> U.S. Government, U.S. Government Agency issues, corporate fixed income, commercial paper and repurchaseagreements.As <strong>of</strong> June 30, <strong>2005</strong>, <strong>of</strong> the <strong>University</strong>’s total investments, 18.7% are issues <strong>of</strong> the Federal Home Loan Bank (FHLB),8.5% are issues <strong>of</strong> the Federal National Mortgage Association (FNMA), and 5.1% are issues <strong>of</strong> the Federal Home LoanMortgage Corporation (FHLMC).Securities Lending Transactions – The <strong>University</strong> participates in an external investment pool securities lendingprogram to augment income. The program is administered by the <strong>University</strong>’s custodial agent bank, which lendsequity, government and corporate securities for a predetermined period <strong>of</strong> time to an independent broker/dealer(borrower) in exchange for collateral. Collateral may be cash, U.S. Government securities, defined letters <strong>of</strong> creditor other collateral approved by the <strong>University</strong>. Loans <strong>of</strong> domestic securities are initially collateralized at 102% <strong>of</strong> thefair value <strong>of</strong> securities lent. Loans <strong>of</strong> international securities are initially collateralized at 105% <strong>of</strong> the fair value <strong>of</strong>securities lent. The <strong>University</strong> has minimized its exposure to credit risk from borrower default by having the custodialagent bank determine daily that required collateral meets a minimum <strong>of</strong> 100% <strong>of</strong> the fair value <strong>of</strong> securities on loanfor domestic securities lent and 105% for international securities lent. The fair value <strong>of</strong> collateral for securities on loantotaled $81,611,000 and $61,196,000 at June 30, <strong>2005</strong> and 2004, respectively.The <strong>University</strong> continues to receive interest and dividends during the loan period, as well as a fee from the borrower.In addition, the maturities <strong>of</strong> the investments made with the cash collateral generally match the maturities <strong>of</strong> thesecurities lent. At June 30, <strong>2005</strong>, the <strong>University</strong> has no credit risk exposure since the collateral held exceeds the value<strong>of</strong> the securities lent. The <strong>University</strong> is fully indemnified by its custodial bank against any losses incurred as a result<strong>of</strong> borrower default.In addition, at June 30, <strong>2005</strong> and 2004, letters <strong>of</strong> credit and security collateral, not meeting the criteria for inclusion inthe Statements <strong>of</strong> Net Assets, totaled $3,170,000 and $941,000, respectively. At June 30, <strong>2005</strong>, the aggregate fair value<strong>of</strong> the securities lent and related collateral received was $81,799,000 and $60,000,000, respectively.Discretely Presented Component Unit – Medical AllianceInvestments – The investment policies <strong>of</strong> Medical Alliance are established by its board <strong>of</strong> directors. The policies areestablished to ensure that Medical Alliance funds are managed in accordance with the “Prudent Man Rule.”2 0 0 5 F i n a n c i a l R e p o r t : U n i v e r s i t y o f M i s s o u r ia c o m p o n e n t u n i t o f t h e S t a t e o f M i s s o u r i 31
N otes to Combined Financial StatementsF o r t h e y e a r s e n d e d J u n e 3 0 , 2 0 0 5 a n d 2 0 0 4At June 30, <strong>2005</strong> and 2004, Medical Alliance held the following investments (in thousands <strong>of</strong> dollars):<strong>2005</strong> 2004Internally Designated for Capital Improvements:Repurchase Agreements $ - $ 5,000Mortgage-backed securities 10,668 8,083Money Market Accounts 13,766 6,100Interest Receivable 57 33U.S. Treasury Obligations 74 74Certificates <strong>of</strong> Deposit 11,271 5,525Subtotal 35,836 24,815Held by Trustee Under Indenture Agreement:Money Market Accounts 8,381 19,390Interest Receivable 8Less Portion Required for Current Obligations (1,210) (748)$ 43,015 $ 43,457<strong>University</strong> <strong>of</strong> <strong>Missouri</strong> Retirement TrustInvestments – Retirement Trust – The Board <strong>of</strong> Curators <strong>of</strong> the <strong>University</strong> <strong>of</strong> <strong>Missouri</strong> establishes the investmentpolicies for the Retirement Trust. Retirement investments emphasize diversification across asset classes, dominated byequity securities, in order to maximize total investment returns. While pursuing this objective, the Retirement Trustmaintains its fiduciary duties applicable to investments set forth in Section 105.688 <strong>of</strong> the Revised Statutes <strong>of</strong> <strong>Missouri</strong>.The Retirement Trust investments earned a total return <strong>of</strong> 11.1%, including unrealized gains and losses, for the yearended June 30, <strong>2005</strong>, and 18.5% for the year ended June 30, 2004.At June 30, <strong>2005</strong>, the Retirement Trust held investments, by investment type, as follows (in thousands <strong>of</strong> dollars):Carrying Valueas <strong>of</strong>June 30, <strong>2005</strong>Government Obligations $ 301,689Corporate Bonds and Notes 109,375Corporate Stocks 1,783,813Other 33,282Total Short-Term and Long-Term Investments 2,228,159Commercial Paper 12,557Total Cash and Cash Equivalents 12,557Total Investments $ 2,240,716Custodial Credit Risk – The custodial credit risk for investments is the risk that in the event <strong>of</strong> failure <strong>of</strong> thecounterparty to a transaction, the Retirement Trust will not be able to recover the value <strong>of</strong> the investments that are in thepossession <strong>of</strong> an outside party. The investment <strong>of</strong> $12,557,000 in commercial paper is uninsured and uncollateralized.The remainder <strong>of</strong> the Retirement Trust’s investments are insured or registered and are held by the Retirement Trust oran agent in its name.Interest Rate Risk – Interest rate risk is the risk that changes in interest rates will adversely affect the fair value <strong>of</strong> aninvestment. As a means <strong>of</strong> ensuring the safety <strong>of</strong> principal invested, the Retirement Trust’s investment policy requiresdiversification <strong>of</strong> the investment portfolio.322 0 0 5 F i n a n c i a l R e p o r t : U n i v e r s i t y o f M i s s o u r ia c o m p o n e n t u n i t o f t h e S t a t e o f M i s s o u r i
N otes to Combined Financial StatementsF o r t h e y e a r s e n d e d J u n e 3 0 , 2 0 0 5 a n d 2 0 0 4At June 30, <strong>2005</strong>, the maturities <strong>of</strong> the Retirement Trust’s investments are as follows (in thousands <strong>of</strong> dollars):As <strong>of</strong> June 30, <strong>2005</strong>Less than1 Year 1-5 Years 6-10 YearsMore than10 Years Carrying ValueU.S. Agency Obligations $ 1,527 $ 2,950 $ 5,871 $ 45,985 $ 56,333U.S. Treasury Obligations 8,414 4,883 5,665 11,787 30,749Foreign Government Obligations 1,678 102,338 71,641 38,950 214,607U.S. Corporate Bonds & Notes 3,047 13,436 11,320 14,547 42,350Foreign Corporate Bonds & Notes 6,674 24,284 21,662 14,405 67,025Total $ 21,340 $ 147,891 $ 116,159 $ 125,674 $ 411,064Credit Risk – The credit risk <strong>of</strong> investments is the risk that the issuer or other counterparty will not meet its obligations.This credit risk is measured by the credit quality ratings <strong>of</strong> investments in debt securities as described by a nationallyrecognized statistical rating organization such as Standard and Poor’s (S&P) and Moody’s. The <strong>University</strong>’s policy oninvestments for the Retirement Trust states that investments in corporate bonds and other fixed income securities musthave a rating <strong>of</strong> A or better.However, the <strong>University</strong> has elected to use Moody’s Investors Service investment ratings in the following Credit Riskreport. Several securities within the Retirement Trust have Moody’s ratings <strong>of</strong> Baa or Ba and Standard and Poor’sratings in the A range (A-, A, & A+), which places those bonds within the parameters specified by <strong>University</strong>’s policyon investments for the Retirement Trust.The following represents the Retirement Trust’s investment exposure to credit risk, based on Moody’s investmentratings (in thousands <strong>of</strong> dollars):As <strong>of</strong> June 30, <strong>2005</strong>Aaa Aa A Baa Ba Unrated TotalU.S. Agency Obligations $ 6,088 $ 974 $ - $ - $ - $ 49,271 $ 56,333U.S. Treasury Obligations 30,749 30,749Foreign Government Obligations 160,096 7,005 39,190 8,316 214,607U.S. Corporate Bonds & Notes 18,494 7,387 11,467 762 4,240 42,350Foreign Corporate Bonds & Notes 34,352 7,099 9,768 2,126 13,680 67,025Total $219,030 $ 22,465 $ 60,425 $ 2,888 $ - $106,256 $411,064Concentration <strong>of</strong> Credit Risk – The concentration <strong>of</strong> credit risk is the risk <strong>of</strong> loss that may occur due to the amount <strong>of</strong>investments in a single issuer (not including investments issued or guaranteed by the U.S. government, investments inmutual funds, or external investment pools). The Retirement Trust investment policy allows for a portfolio consisting <strong>of</strong>no more than 47.5% U.S. equity, 25% international equity, 10% emerging markets equity, 10% alternative investments(maximum <strong>of</strong> 5.0% in hedge funds), 10% real estate and 27.5% global fixed income. At June 30, <strong>2005</strong>, the RetirementTrust portfolio did not contain any investments from a single issuer which exceeded 5% <strong>of</strong> the total portfolio.Foreign Currency Risk – Foreign currency risk is the risk that changes in exchange rates will adversely affect thefair value <strong>of</strong> a foreign investment. The Retirement Trust invests a significant portion <strong>of</strong> its portfolio in internationalinvestments (23.8% and 23.1% denominated in foreign currency in fiscal years <strong>2005</strong> and 2004, respectively). Toreduce the risk related to fluctuations in currency exchange rates, the <strong>University</strong> has entered into forward foreigncurrency contracts throughout the year. As <strong>of</strong> June 30, <strong>2005</strong> and 2004, 9.7% or $216,017,000 and 9.5% or $199,007,000,respectively, <strong>of</strong> the Retirement Trust’s investment portfolio is invested in forward foreign currency contracts. Thesecontracts are marked to market and the changes in their market value are recorded in net appreciation (depreciation) infair value <strong>of</strong> investments in the Statements <strong>of</strong> Changes in Net Assets Held for Pension Benefits.2 0 0 5 F i n a n c i a l R e p o r t : U n i v e r s i t y o f M i s s o u r ia c o m p o n e n t u n i t o f t h e S t a t e o f M i s s o u r i 33
N otes to Combined Financial StatementsF o r t h e y e a r s e n d e d J u n e 3 0 , 2 0 0 5 a n d 2 0 0 4Foreign Currency RiskInternational Investment Securities at Fair Value(in thousands <strong>of</strong> dollars)Currency <strong>2005</strong>Australian Dollar $ 8,582British Pound Sterling 89,712Canadian Dollar 18,281Chilean Peso 72Danish Krone 2,476Euro 211,619Hong Kong Dollar 8,206Israeli Shekel 561Japanese Yen 140,182Mexican New Peso 1,014New Taiwan Dollar 94New Zealand Dollar 639Norwegian Krone 1,417Polish Zloty 453South African Comm Rand 930Singapore Dollar 3,582South Korean Won 289Swedish Krona 12,084Swiss Franc 30,515Total $ 530,708Securities Lending Transactions – The Retirement Trust participates in an external investment pool securities lendingprogram to augment income. The program is administered by the Retirement Trust’s custodial agent bank, whichlends equity, government and corporate securities for a predetermined period <strong>of</strong> time to an independent broker/dealer(borrower) in exchange for collateral. Collateral may be cash, U.S. Government securities, defined letters <strong>of</strong> credit orother collateral approved by the Retirement Trust. Loans <strong>of</strong> domestic securities are initially collateralized at 102% <strong>of</strong>the fair value <strong>of</strong> securities lent. Loans <strong>of</strong> international securities are initially collateralized at 105% <strong>of</strong> the fair value<strong>of</strong> securities lent. The Retirement Trust has minimized its exposure to credit risk from borrower default by having thecustodial agent bank determine daily that required collateral meets a minimum <strong>of</strong> 100% <strong>of</strong> the fair value <strong>of</strong> securitieson loan for domestic securities lent and 105% for international securities lent. The fair value <strong>of</strong> collateral held forsecurities on loan totaled $173,580,000 and $149,917,000 at June 30, <strong>2005</strong> and 2004, respectively.The Retirement Trust continues to receive interest and dividends during the loan period, as well as a fee from theborrower. In addition, the maturities <strong>of</strong> the investments made with the cash collateral generally match the maturities <strong>of</strong>the securities lent. At June 30, <strong>2005</strong>, the Retirement Trust has no credit risk exposure since the collateral held exceedsthe value <strong>of</strong> the securities lent. The Retirement Trust is fully indemnified by its custodial bank against any lossesincurred as a result <strong>of</strong> borrower default.In addition, at June 30, <strong>2005</strong> and 2004, letters <strong>of</strong> credit and security collateral, not meeting the criteria for inclusionin the Statements <strong>of</strong> Net Assets Held for Pension Benefits, totaled $11,014,000 and $1,776,000, respectively, for theRetirement Trust. At June 30, <strong>2005</strong> and 2004, the aggregate fair value <strong>of</strong> the securities lent and related collateralreceived was $177,170,000 and $145,735,000, respectively.342 0 0 5 F i n a n c i a l R e p o r t : U n i v e r s i t y o f M i s s o u r ia c o m p o n e n t u n i t o f t h e S t a t e o f M i s s o u r i
N otes to Combined Financial StatementsF o r t h e y e a r s e n d e d J u n e 3 0 , 2 0 0 5 a n d 2 0 0 44. FUNDS HELD IN TRUST BY OTHERSAt June 30, <strong>2005</strong> and 2004, Funds Held in Trust by Others (principally endowment funds) aggregated $83,896,000and $67,349,000, respectively, at fair value. Due to time restrictions or a legal event that has not occurred, these fundsare not available to the <strong>University</strong> and are not included in the accompanying Statements <strong>of</strong> Net Assets. Income earnedand distributed to the <strong>University</strong> for the years ended June 30, <strong>2005</strong> and 2004, aggregated $1,920,000 and $1,716,000,respectively.5. ACCOUNTS RECEIVABLEAccounts receivable at June 30, <strong>2005</strong> and 2004, are summarized as follows (in thousands <strong>of</strong> dollars):<strong>2005</strong> 2004Grants and Contracts $ 43,500 $ 34,037State Appropriations and State Bond Funds 835 37,821Student Fees and Other Academic Charges 72,891 49,257<strong>University</strong> Hospitals and Clinics Patient Services, Net<strong>of</strong> Contractual Allowances 80,364 65,825<strong>University</strong> Physicians Patient Services, Net<strong>of</strong> Contractual Allowances 15,357 15,819Subtotal 212,947 202,759Less Provisions for Loss on Accounts Receivable:Grants and Contracts Allowance 3,885 -<strong>University</strong> Hospitals and Clinics Patient Services Allowances 14,757 12,544<strong>University</strong> Physicians Patient Services Allowances 4,490 879Student Fees and Other Academic Charges 4,609 4,848Subtotal 27,741 18,271$ 185,206 $ 184,4886. NOTES RECEIVABLENotes receivable consist <strong>of</strong> resources available for financial loans to students. These resources are provided throughFederal loan programs and <strong>University</strong> loan programs generally funded by external sources. Notes receivable at June 30,<strong>2005</strong> and 2004, are summarized as follows (in thousands <strong>of</strong> dollars):<strong>2005</strong> 2004Federal Health Pr<strong>of</strong>ession Loans $ 12,752 $ 12,983Carl D. Perkins National Loans 29,712 28,228<strong>University</strong> Loan Programs 15,656 14,273Subtotal 58,120 55,484Less Provision for Loss on Notes Receivable 1,567 1,566$ 56,553 $ 53,9182 0 0 5 F i n a n c i a l R e p o r t : U n i v e r s i t y o f M i s s o u r ia c o m p o n e n t u n i t o f t h e S t a t e o f M i s s o u r i 35
N otes to Combined Financial StatementsF o r t h e y e a r s e n d e d J u n e 3 0 , 2 0 0 5 a n d 2 0 0 47. CAPITAL ASSETS<strong>University</strong> <strong>of</strong> <strong>Missouri</strong>Capital assets activity for the years ended June 30, <strong>2005</strong> and 2004, is summarized as follows (in thousands <strong>of</strong> dollars):<strong>2005</strong>BeginningBalanceAdditions/TransfersRetirements<strong>2005</strong>EndingBalanceCapital Assets, Nondepreciable:Land $ 53,023 $ 1,242 $ - $ 54,265Artwork and Historical Artifacts 16,379 167 5,412 11,134Construction in Progress 196,678 (67,353) - 129,325Total Capital Assets, Nondepreciable 266,080 (65,944) 5,412 194,724Capital Assets, Depreciable:Buildings and Improvements 1,697,801 183,707 11,450 1,870,058Infrastructure 175,486 12,746 515 187,717Equipment 412,899 69,154 36,599 445,454Library Materials 193,022 8,476 - 201,498Total Capital Assets, Depreciable 2,479,208 274,083 48,564 2,704,727Less Accumulated Depreciation:Buildings and Improvements 615,822 48,461 10,107 654,176Infrastructure 60,853 7,059 515 67,397Equipment 258,551 39,603 32,818 265,336Library Materials 109,738 7,291 - 117,029Total Accumulated Depreciation 1,044,964 102,414 43,440 1,103,938Total Capital Assets, Depreciable, Net 1,434,244 171,669 5,124 1,600,789Total Capital Assets, Net $ 1,700,324 $ 105,725 $ 10,536 $ 1,795,51320042004BeginningBalanceAdditions/TransfersRetirementsEndingBalanceCapital Assets, Nondepreciable:Land $ 53,989 $ 1,118 $ 2,084 $ 53,023Artwork and Historical Artifacts 16,298 81 - 16,379Construction in Progress 146,845 49,833 - 196,678Total Capital Assets, Nondepreciable 217,132 51,032 2,084 266,080Capital Assets, Depreciable:Buildings and Improvements 1,555,321 145,412 2,932 1,697,801Infrastructure 169,354 9,441 3,309 175,486Equipment 417,046 36,394 40,541 412,899Library Materials 182,345 10,677 - 193,022Total Capital Assets, Depreciable 2,324,066 201,924 46,782 2,479,208Less Accumulated Depreciation:Buildings and Improvements 578,367 40,189 2,734 615,822Infrastructure 56,994 6,518 2,659 60,853Equipment 260,715 36,019 38,183 258,551Library Materials 102,690 7,048 - 109,738Total Accumulated Depreciation 998,766 89,774 43,576 1,044,964Total Capital Assets, Depreciable, Net 1,325,300 112,150 3,206 1,434,244Total Capital Assets, Net $ 1,542,432 $ 163,182 $ 5,290 $ 1,700,324362 0 0 5 F i n a n c i a l R e p o r t : U n i v e r s i t y o f M i s s o u r ia c o m p o n e n t u n i t o f t h e S t a t e o f M i s s o u r i
N otes to Combined Financial StatementsF o r t h e y e a r s e n d e d J u n e 3 0 , 2 0 0 5 a n d 2 0 0 4The estimated cost to complete construction in progress at June 30, <strong>2005</strong>, is $460,667,000 <strong>of</strong> which $168,321,000is available from unrestricted net assets. The remaining costs are expected to be funded from $27,235,000 <strong>of</strong> Stateappropriations, $69,898,000 <strong>of</strong> gifts, $10,991,000 <strong>of</strong> grants, and $184,222,000 <strong>of</strong> bond proceeds.Capital assets include a building facility under a capital lease <strong>of</strong> $8,332,000 and related accumulated depreciation <strong>of</strong>$2,396,000 and $1,979,000 at June 30, <strong>2005</strong> and 2004, respectively.Discretely Presented Component Unit – Medical AllianceCapital Assets at June 30, <strong>2005</strong> and 2004 are summarized as follows (in thousands <strong>of</strong> dollars):8. ACCRUED LIABILITIESAccrued liabilities at June 30 <strong>2005</strong> and 2004, are summarized as follows (in thousands <strong>of</strong> dollars):9. OTHER LIABILITIESOther liabilities at June 30, <strong>2005</strong> and 2004, are summarized as follows (in thousands <strong>of</strong> dollars):10. BONDS AND NOTES PAYABLE<strong>University</strong> <strong>of</strong> <strong>Missouri</strong><strong>2005</strong> 2004Land and Improvements $ 6,623 $ 6,519Buildings 77,229 76,644Movable Equipment 47,101 43,814Construction in Progress 14,591 2,765145,544 129,742Less Accumulated Depreciation 78,977 72,673Total Capital Assets, Net $ 66,567 $ 57,069<strong>2005</strong> 2004Accrued Salaries, Wages and Related Benefits $ 36,836 $ 34,541Accrued Vacation 33,806 31,120Accrued Self Insurance Claims 29,417 24,043Interest Payable 3,915 3,866$ 103,974 $ 93,570<strong>2005</strong>Beginning<strong>of</strong> Year Additions Payments<strong>2005</strong>End <strong>of</strong>YearCurrentPortionAccrued Vacation $ 39,852 $ 34,559 $ (31,120) $ 43,291 $ 33,806Accrued Self-Insurance Claims 68,996 155,415 (146,221) 78,190 29,417$ 108,848 $ 189,974 $ (177,341) $ 121,481 $ 63,2232004Beginning<strong>of</strong> Year Additions Payments2004End <strong>of</strong>YearCurrentPortionAccrued Vacation $ 40,032 $ 31,081 $ (31,261) $ 39,852 $ 31,120Accrued Self-Insurance Claims 58,275 137,746 (127,025) 68,996 24,043$ 98,307 $ 168,827 $ (158,286) $ 108,848 $ 55,163As <strong>of</strong> June 30, <strong>2005</strong> and 2004, $565,537,000 and $576,674,000, respectively, <strong>of</strong> bonds and notes were outstanding, net<strong>of</strong> unamortized premium/discount and loss on defeasance <strong>of</strong> $312,000 and ($171,000), respectively. These outstandingbonds are comprised <strong>of</strong> $400,025,000 and $408,295,000 in <strong>System</strong> Facilities Revenue Bonds and $165,200,000 and2 0 0 5 F i n a n c i a l R e p o r t : U n i v e r s i t y o f M i s s o u r ia c o m p o n e n t u n i t o f t h e S t a t e o f M i s s o u r i 37
N otes to Combined Financial StatementsF o r t h e y e a r s e n d e d J u n e 3 0 , 2 0 0 5 a n d 2 0 0 4$168,550,000 in Health Facilities Revenue Bonds at June 30, <strong>2005</strong> and 2004, respectively. The bonds are payable,both as to principal and interest, from net income or designated revenues from the related financed activities. Thesebonds bear interest at fixed and variable rates ranging from 2.29% to 5.75% per annum and mature at various datesthrough November 2034. Interest on the variable rate <strong>System</strong> Facilities Revenue Bonds is paid at the Bond MarketAssociation daily bond rate.Bonds and Notes Payable activity by series <strong>of</strong> issuance for the years ended June 30, <strong>2005</strong> and 2004, was as follows (inthousands <strong>of</strong> dollars):<strong>2005</strong>BeginningBalance Issuance Payments Defeasance Amortization<strong>2005</strong>EndingBalance<strong>System</strong> Facilities Revenue Bonds:Series 1997 $ 4,210 $ - $ (975) $ - $ - $ 3,235Series 1998 54,165 (2,290) 51,875Series 2000 71,830 (2,635) 69,195Series 2001 82,925 (690) 82,235Series 2002 40,000 40,000Series 2003 155,165 (1,680) 153,485Less Unamortized Premium/Discount 4,171 (110) 4,061Less Loss on Defeasance (2,364) 433 (1,931)Health Facilities Revenue Bonds:Series 1996A 109,035 (1,380) 107,655Series 1998A 59,515 (1,970) 57,545Less Unamortized Premium/Discount (1,206) 54 (1,152)Less Loss on Defeasance (772) 106 (666)576,674 $ - $ (11,620) $ - $ 483 565,537Less Current Portion 11,620 13,485$ 565,054 $ 552,0522004BeginningBalance Issuance Payments Defeasance Amortization2004EndingBalance<strong>System</strong> Facilities Revenue Bonds:Series 1993 $ 37,810 $ - $ (1,030) $ (36,780) $ - $ -Series 1997 5,135 (925) 4,210Series 1998 56,365 (2,200) 54,165Series 2000 74,325 (2,495) 71,830Series 2001 83,575 (650) 82,925Series 2002 40,000 40,000Series 2003 155,165 155,165Less Unamortized Premium/Discount (199) 4,102 368 (100) 4,171Less Loss on Defeasance (1,631) (1,143) 410 (2,364)Health Facilities Revenue Bonds:Series 1996A 110,355 (1,320) 109,035Series 1998A 61,395 (1,880) 59,515Less Unamortized Premium/Discount (1,260) 54 (1,206)Less Loss on Defeasance (878) 106 (772)Note Payable 273 (273) -465,265 $ 159,267 $ (10,773) $ (37,555) $ 470 576,674Less Current Portion 10,773 11,620$ 454,492 $ 565,054382 0 0 5 F i n a n c i a l R e p o r t : U n i v e r s i t y o f M i s s o u r ia c o m p o n e n t u n i t o f t h e S t a t e o f M i s s o u r i
N otes to Combined Financial StatementsF o r t h e y e a r s e n d e d J u n e 3 0 , 2 0 0 5 a n d 2 0 0 4As <strong>of</strong> June 30, <strong>2005</strong>, the total <strong>of</strong> principal and interest (in thousands <strong>of</strong> dollars) due on bonds during the next five yearsand in subsequent five-year periods is as follows:Fiscal Year Principal InterestNet Paymentson SwapAgreement2006 $ 13,485 $ 24,676 $ 6032007 14,155 24,062 6082008 14,785 23,423 6082009 15,480 22,751 6082010 16,235 22,024 6162011-2015 79,255 99,280 3,0292016-2020 95,670 79,207 3,0382021-2025 117,905 54,381 3,0382026-2030 130,170 23,664 3,0382031-2035 68,085 3,429 1,681$ 565,225 $ 376,897 $ 16,867Future interest payment requirements for variable rate debt are determined using the rate in effect at June 30, <strong>2005</strong>, <strong>of</strong>2.29%. The above interest payments also include estimated payments on the interest rate swap agreement, as discussedbelow, at a fixed rate <strong>of</strong> 3.95%, net <strong>of</strong> the funds received from the counterparty to the transaction at a rate effective atJune 30, <strong>2005</strong>, <strong>of</strong> 2.43%.On November 13, 2003, the <strong>University</strong> issued $155,165,000 <strong>of</strong> <strong>System</strong> Facilities Revenue Bonds, consisting <strong>of</strong>$118,080,000 in Series 2003A bonds at the interest cost <strong>of</strong> 4.72% and $37,085,000 <strong>of</strong> Series 2003B bonds at the interestcost <strong>of</strong> 4.19%. Proceeds from the issuance <strong>of</strong> the Series 2003A bonds were used to finance construction <strong>of</strong> new housingfacilities on the Columbia, Kansas City and Rolla campuses, various other projects and the cost <strong>of</strong> issuance. Proceedsfrom the issuance <strong>of</strong> the Series 2003B bonds were used to advance refund and defease the <strong>University</strong> <strong>of</strong> <strong>Missouri</strong><strong>System</strong> Facilities Revenue Bonds, Series 1993 in the amount <strong>of</strong> $36,780,000 and to finance certain costs <strong>of</strong> issuance.A $1,143,000 loss in connection with the defeasance <strong>of</strong> the Series 1993 Bonds is included as a reduction <strong>of</strong> debtoutstanding and will be amortized over the remaining life <strong>of</strong> the original Series 1993 Bonds. The defeasance decreasedaggregate debt service payments by $5,288,000 resulting in an economic gain (difference between the present values<strong>of</strong> the old and new debt service payments) to the <strong>University</strong> <strong>of</strong> $3,525,000.On June 14, <strong>2005</strong>, the <strong>University</strong> entered into an interest rate swap agreement on $134,425,000, notional amount, tohedge the interest rate risk associated with future Tax-Exempt Bonds. The <strong>University</strong> makes payments based on a fixedrate <strong>of</strong> 3.353% and receives payments from the counterparty based on a floating rate <strong>of</strong> 70% <strong>of</strong> LIBOR. Net paymentswill commence on December 1, <strong>2005</strong> and will continue on a monthly basis until the swap terminates. The interest rateswap agreement will terminate no later than February 15, 2006. The 2006A and 2006B <strong>System</strong> Facilities RevenueBonds are anticipated to be issued on or before February 15, 2006.On the termination date, if interest rates have risen, the <strong>University</strong> would receive a payment from the counter party,thereby reducing the amount that needs to be borrowed and lowering debt service to the same level had the bondsbeen issued on the date the swap was agreed to. If interest rates have fallen, the <strong>University</strong> <strong>of</strong> <strong>Missouri</strong> would makea payment to the counter party by issuing a higher amount <strong>of</strong> debt. However, by issuing at a lower interest rate, debtservice would again approximate what would have been available on the date the agreement was signed.As <strong>of</strong> June 30, <strong>2005</strong>, the swap had a fair value <strong>of</strong> ($2,145,940), which represents the cost to the <strong>University</strong> to terminatethe swap. The fair value was developed using the zero coupon method and proprietary models, and was prepared by thecounterparty, Bank <strong>of</strong> America, a major U.S. financial institution. The zero coupon method calculates the future netsettlement payments required by the swap, assuming that the current forward rates implied by the yield curve correctly2 0 0 5 F i n a n c i a l R e p o r t : U n i v e r s i t y o f M i s s o u r ia c o m p o n e n t u n i t o f t h e S t a t e o f M i s s o u r i 39
N otes to Combined Financial StatementsF o r t h e y e a r s e n d e d J u n e 3 0 , 2 0 0 5 a n d 2 0 0 4anticipate future spot interest rates. These payments are then discounted using the spot rates implied by the currentyield curve for hypothetical zero-coupon bonds due on the date <strong>of</strong> each net settlement <strong>of</strong> the swap.In addition, the <strong>University</strong> maintains a thirty-year interest rate swap agreement on $40,000,000, notional amount, <strong>of</strong> itsvariable rate <strong>System</strong> Facilities Revenue Bonds. The purpose <strong>of</strong> the interest rate swap agreement is to convert variablerate debt to fixed rate debt. Based on the swap agreement, the <strong>University</strong> owes interest calculated at a fixed rate <strong>of</strong>3.95% to the counterparty to the swap. In return, the counterparty owes the <strong>University</strong> interest based on a variable rateset weekly. The $40,000,000 in bond principal is not exchanged; it is only the basis on which the interest payments arecalculated.The <strong>University</strong> continues to pay interest to the bondholders at the variable rate provided by the bonds. However, duringthe term <strong>of</strong> the swap agreement, the <strong>University</strong> effectively pays a fixed rate on the debt. The <strong>University</strong> will revert tovariable rates if the counterparty to the swap defaults or if the swap is terminated. A termination <strong>of</strong> the swap agreementmay also result in the <strong>University</strong> making or receiving a termination payment.As <strong>of</strong> June 30, <strong>2005</strong>, the swap had a fair value <strong>of</strong> ($3,690,830), which represents the cost to the <strong>University</strong> to terminatethe swap. The fair value was developed using the zero coupon method and proprietary models, and was prepared bythe counterparty, J.P. Morgan Chase Bank, a major U.S. financial institution. The zero coupon method calculates thefuture net settlement payments required by the swap, assuming that the current forward rates implied by the yield curvecorrectly anticipate future spot interest rates. These payments are then discounted using the spot rates implied by thecurrent yield curve for hypothetical zero-coupon bonds due on the date <strong>of</strong> each net settlement <strong>of</strong> the swap.As <strong>of</strong> June 30, <strong>2005</strong>, the <strong>University</strong> was not exposed to credit risk on the termination payment because the swap hada negative fair value and the <strong>University</strong> would have owed the payment. However, should interest rates change andthe fair value <strong>of</strong> the swap become positive, the <strong>University</strong> would be exposed to credit risk. The swap counterpartywas rated AA- by Standard & Poor’s and Aa2 by Moody’s Investors Service as <strong>of</strong> June 30, <strong>2005</strong>. In the event aratings downgrade occurs, the counterparty may be required to provide collateral if the <strong>University</strong>’s overall exposureexceeds predetermined levels. Permitted collateral investments include U.S. Treasuries, U.S. government agencies,cash and commercial paper rated A1/P1 by Standard & Poor’s and Moody’s, respectively. Collateral may be held by the<strong>University</strong> or by a third party custodian.The swap exposes the <strong>University</strong> to basis risk should the weekly BMA rate paid by the counterparty fall below the dailyinterest rate due on the bonds. This basis risk can be the result <strong>of</strong> a downgrade <strong>of</strong> the <strong>University</strong>’s rating, daily ratesbecoming higher than weekly rates, or the pricing <strong>of</strong> the <strong>University</strong>’s bonds by the remarketing agent at rates higherthan the BMA index.At June 30, <strong>2005</strong> and 2004, in-substance defeased bonds aggregating $52,205,000 and $53,620,000, respectively, areoutstanding.402 0 0 5 F i n a n c i a l R e p o r t : U n i v e r s i t y o f M i s s o u r ia c o m p o n e n t u n i t o f t h e S t a t e o f M i s s o u r i
N otes to Combined Financial StatementsF o r t h e y e a r s e n d e d J u n e 3 0 , 2 0 0 5 a n d 2 0 0 4Discretely Presented Component Unit – Medical AllianceBonds and Notes payable activity by series <strong>of</strong> issuance for the years ended June 30, <strong>2005</strong> and 2004, was as follows (inthousands <strong>of</strong> dollars):<strong>2005</strong>BeginningBalance Issuance Payments<strong>2005</strong>EndingBalanceHealth Facilities Revenue Bonds Series 1998, datedDecember 1, 1998 and maturing November 1, 2028,payable in graduated installments from November 1,1999 to November 1, 2028, bearing interest rangingfrom 3.35% to 5.30% $ 22,745 $ - $ (480) $ 22,265Health Facilities Revenue Bonds Series 2004, datedJune 1, 2004 and maturing November 1, 2029, payablein graduated installments from November 1, <strong>2005</strong> toNovember 1, 2029, bearing interest ranging from2.25% to 5.75% 17,500 17,50040,245 $ - $ (480) 39,765Less current maturities (480) (870)$ 39,765 $ 38,89520042004BeginningEndingBalance Issuance PaymentsBalanceHealth Facilities Revenue Bonds Series 1998, datedDecember 1, 1998 and maturing November 1, 2028,payable in graduated installments from November 1,1999 to November 1, 2028, bearing interest rangingfrom 3.35% to 5.30% $ 23,210 $ - $ (465) $ 22,745Health Facilities Revenue Bonds Series 2004, datedJune 1, 2004 and maturing November 1, 2029, payablein graduated installments from November 1, <strong>2005</strong> toNovember 1, 2029, bearing interest ranging from2.25% to 5.75% 17,500 17,50023,210 $ 17,500 $ (465) 40,245Less current maturities (465) (480)$ 22,745 $ 39,765In June 2004, Medical Alliance issued $17,500,000 <strong>of</strong> tax‐exempt Health Facilities Revenue Bonds Series 2004 thoughthe Health and Educational Facilities Authority <strong>of</strong> the State <strong>of</strong> <strong>Missouri</strong>. The bonds proceeds will be used primarily topay or reimburse the costs <strong>of</strong> acquiring, constructing and equipping certain health facilities <strong>of</strong> Medical Alliance and t<strong>of</strong>und the future debt service requirement fund for these Series 2004 bonds.Similar to the Series 1998 bonds, the Series 2004 bonds were issued pursuant to the Master Trust Indenture datedDecember 1, 1998, as supplemented on June 1, 2004. Under the terms <strong>of</strong> the Master Trust Indenture (the “MasterIndenture”), Medical Alliance is required to make payments <strong>of</strong> principal, premium, if any, and interest on the bonds.The Series 1998 and 2004 bonds are secured by the unrestricted receivables <strong>of</strong> Medical Alliance. In addition, theMaster Indenture contains certain restrictions on the operations and activities <strong>of</strong> Medical Alliance, including, amongother things, covenants restricting the incurrence <strong>of</strong> additional indebtedness and the creation <strong>of</strong> liens on property,except as permitted by the Master Indenture.The Master Indenture has mandatory sinking fund redemption requirements in which funds are required to be set asidebeginning in 2014 and 2025 for the Series 1998 bonds and Series 2004 bonds, respectively.Interest expense incurred on the bonds during the years ended June 30, <strong>2005</strong> and 2004 was $2,077,000 and $1,185,000,respectively, <strong>of</strong> which $737,000 was capitalized during the year ended June 30, <strong>2005</strong>.2 0 0 5 F i n a n c i a l R e p o r t : U n i v e r s i t y o f M i s s o u r ia c o m p o n e n t u n i t o f t h e S t a t e o f M i s s o u r i 41
N otes to Combined Financial StatementsF o r t h e y e a r s e n d e d J u n e 3 0 , 2 0 0 5 a n d 2 0 0 4As <strong>of</strong> June 30, <strong>2005</strong>, the total <strong>of</strong> principal and interest (in thousands <strong>of</strong> dollars) due on bonds during the next five yearsand in subsequent five-year periods is as follows:Year Ending June 30 Principal Interest2006 $ 870 $ 2,0242007 900 1,9922008 935 1,9572009 970 1,9172010 1,010 1,8742011-2015 5,795 8,6082016-2020 7,375 6,9712021-2025 9,520 4,7662026-2029 12,390 1,803$ 39,765 $ 31,91211. SHORT-TERM BORROWINGSDuring the year ended June 30, <strong>2005</strong>, the <strong>University</strong> sold $168,000,000 <strong>of</strong> capital project notes at an effective interestrate <strong>of</strong> 1.5%. The maximum amount <strong>of</strong> notes outstanding during the year was $168,000,000 and all were repaid in fullby June 30, <strong>2005</strong>. Proceeds from the issuance <strong>of</strong> the capital project notes were used to fund various constructionprojects. Capital project note activity for the year ended June 30, <strong>2005</strong> is as follows (in thousands <strong>of</strong> dollars):Fiscal YearBeginning<strong>of</strong> Year Issuance PaymentsEnd <strong>of</strong>YearCapital Project Notes, Series <strong>FY</strong> 2004-<strong>2005</strong> <strong>2005</strong> $ - $ 168,000 $ (168,000) $ -There were no capital project notes sold by the <strong>University</strong> during the year ended June 30, 2004.12. LEASE OBLIGATIONS AND COMMITMENTSThe <strong>University</strong> leases various facilities and equipment through operating and capital leases. Facilities under capitalizedleases are recorded at the present value <strong>of</strong> future minimum lease payments.Capital lease obligations activity for the years ended June 30, <strong>2005</strong> and 2004, is as follows (in thousands <strong>of</strong> dollars):FiscalYearBeginning<strong>of</strong> Year Additions PaymentsEnd <strong>of</strong>YearCurrentPortion<strong>2005</strong> $ 10,532 $ - $ (361) $ 10,171 $ 3922004 10,864 - (332) 10,532 361The future minimum payments on all significant leases with initial or remaining terms <strong>of</strong> one year or more at June 30,<strong>2005</strong>, are as follows (in thousands <strong>of</strong> dollars):Fiscal Year Capital Operating2006 $ 1,374 $ 3,4862007 1,374 7852008 1,374 4562009 1,374 4562010 1,374 4422011-2015 6,871 1,7592016-2020 5,840 143Total Future Minimum Payments 19,581 $ 7,527Less: Amount Representing Interest 9,410Present Value <strong>of</strong> Future Minimum Lease Payments $ 10,171Total rental expenditures for operating leases for the years ended June 30, <strong>2005</strong> and 2004, were $14,121,000 and$12,087,000, respectively.422 0 0 5 F i n a n c i a l R e p o r t : U n i v e r s i t y o f M i s s o u r ia c o m p o n e n t u n i t o f t h e S t a t e o f M i s s o u r i
N otes to Combined Financial StatementsF o r t h e y e a r s e n d e d J u n e 3 0 , 2 0 0 5 a n d 2 0 0 4In addition to the above lease obligations, the <strong>University</strong> has outstanding commitments for the acquisition, usage andongoing support <strong>of</strong> certain s<strong>of</strong>tware for its patient clinical systems. As <strong>of</strong> June 30, <strong>2005</strong>, these commitments totaled$21,180,000 and will be paid in the following amounts: $4,351,000 in 2006, $3,960,000 in year 2007 and $12,869,000in years 2008-2011.Description <strong>of</strong> Sublease Arrangement with Institute for Outpatient Surgery (“IOS”) – Concurrent with the sale <strong>of</strong>assets to IOS on July 1, 2002, the <strong>University</strong> entered into an agreement with IOS whereby IOS subleased certainbuilding space from the <strong>University</strong> for a period <strong>of</strong> approximately 17 years at current market rates. The <strong>University</strong>recorded the transaction as a direct financing lease and recorded a minimum lease payment to be received <strong>of</strong> $6,375,000,unearned rental income <strong>of</strong> $3,233,000 and a write-<strong>of</strong>f <strong>of</strong> $3,142,000 <strong>of</strong> building and improvements related to thesublease. The future minimum lease payments to be received under this sublease as <strong>of</strong> June 30, <strong>2005</strong>, are as follows (inthousands <strong>of</strong> dollars):During <strong>2005</strong> and 2004, the <strong>University</strong> received $303,000 and $287,000, respectively, <strong>of</strong> rental income from IOS.Discretely Presented Component Unit – Medical AllianceThe Medical Alliance leases certain computer and medical equipment through operating and capital leases. Equipmentunder capitalized leases is recorded at the present value <strong>of</strong> future minimum lease payments.Capital lease obligations activity for the years ended June 30, <strong>2005</strong> and 2004, is as follows (in thousands <strong>of</strong> dollars):The future minimum payments on all significant leases with initial or remaining terms <strong>of</strong> one year or more at June 30,<strong>2005</strong>, are as follows (in thousands <strong>of</strong> dollars):Total rental expenditures for operating leases for the years ended June 30, <strong>2005</strong> and 2004, were $542,000 and $614,000,respectively.13. RISK MANAGEMENTTotal Minimum Lease Payments to be Received:Current $ 418Noncurrent 5,539Total 5,957Less: Unearned Rental Income (3,087)Present Value <strong>of</strong> Future Minimum Lease Payments Receivable $ 2,870FiscalYearBeginning<strong>of</strong> Year Additions PaymentsEnd <strong>of</strong>YearCurrentPortion<strong>2005</strong> $ 291 $ 24 $ (108) $ 207 $ 1122004 388 (97) 291 102Fiscal Year Capital Operating2006 $ 120 $ 2122007 85 812008 9 192009 4 -Total Future Minimum Payments 218 $ 312Less: Amount Representing Interest 11Present Value <strong>of</strong> Future Minimum Lease Payments $ 207The <strong>University</strong> is exposed to various risks <strong>of</strong> loss related to torts; theft <strong>of</strong>, damage to, and destruction <strong>of</strong> assets; injuriesto employees; natural disasters; and various medically related benefit programs for employees. The <strong>University</strong> fundsthese losses through a combination <strong>of</strong> self-insured retentions and commercially purchased insurance. The amount<strong>of</strong> self-insurance funds and commercial insurance maintained are based upon analysis <strong>of</strong> historical information andactuarial estimates. Settled claims have not exceeded commercial coverage in any <strong>of</strong> the past three fiscal years.2 0 0 5 F i n a n c i a l R e p o r t : U n i v e r s i t y o f M i s s o u r ia c o m p o n e n t u n i t o f t h e S t a t e o f M i s s o u r i 43
N otes to Combined Financial StatementsF o r t h e y e a r s e n d e d J u n e 3 0 , 2 0 0 5 a n d 2 0 0 4The liability for self-insurance claims at June 30, <strong>2005</strong> and 2004 <strong>of</strong> $78,190,000 and $68,996,000, respectively,represents the present value <strong>of</strong> amounts estimated to have been incurred by those dates, using discount rates rangingfrom 2.70% to 4.20% for fiscal year <strong>2005</strong> and 3.25% to 3.70% for fiscal year 2004, based on expected future investmentyield assumptions. Additionally, at June 30, <strong>2005</strong>, there is a range <strong>of</strong> self-insurance claims outstanding, from $560,000to $1,065,000, which the <strong>University</strong> has determined there is a reasonable possibility that a loss contingency may beincurred but no accrual has been made within the financial statements because the loss is not both probable andestimable. Changes in this liability (in thousands <strong>of</strong> dollars) during fiscal years <strong>2005</strong> and 2004 were as follows:14. CONTINGENCIESFiscalYearBeginning<strong>of</strong> YearNew Claimsand Changesin EstimatesClaimPaymentsEnd <strong>of</strong>Year<strong>2005</strong> $ 68,996 $ 155,415 $ (146,221) $ 78,1902004 58,275 137,746 (127,025) 68,9962003 49,855 122,277 (113,857) 58,275In December 2002, the Circuit Court <strong>of</strong> St. Louis County, <strong>Missouri</strong> rendered a decision in a case filed in January, 1998,finding that the <strong>University</strong> had violated a statute enacted in 1872 which provided that youth over the age <strong>of</strong> 16 andresident <strong>of</strong> the State <strong>of</strong> <strong>Missouri</strong> could attend the <strong>University</strong> without payment <strong>of</strong> tuition for undergraduate education.The court decided only the liability phase <strong>of</strong> the case and did not consider what would be an appropriate remedy or ifin fact there should be any finding <strong>of</strong> damages. The <strong>University</strong> appealed that Court’s decision to the Eastern DistrictCourt <strong>of</strong> Appeals in St. Louis, which transferred the appeal to the Supreme Court <strong>of</strong> <strong>Missouri</strong>. The Supreme Courtdismissed the appeal as being premature and remanded the case to the Circuit Court <strong>of</strong> St. Louis County for a trial anddetermination <strong>of</strong> what remedy, if any, is appropriate. The statute was amended in 2001 to authorize the charging <strong>of</strong>tuition. The litigation, therefore, concerns students enrolled prior to the fall semester <strong>of</strong> 2001.The Circuit Court <strong>of</strong> St. Louis County appointed a Special Commissioner to conduct discovery and non-bindingmediation in this case. As a result, a settlement was agreed to by the parties, which provides for the <strong>University</strong> toestablish a scholarship fund <strong>of</strong> $10 million for the class members and spouses and children <strong>of</strong> class members. Inaddition, the <strong>University</strong> would pay slightly in excess <strong>of</strong> $1 million in attorney fees, expenses and costs. As <strong>of</strong> June 30,<strong>2005</strong>, the <strong>University</strong> accounted for the $10 million scholarship fund as restricted net assets. The status <strong>of</strong> the settlementapproved is discussed in Note 21.15. RETIREMENT, DISABILITY AND DEATH BENEFIT PLANBasis <strong>of</strong> Accounting – The <strong>University</strong> <strong>of</strong> <strong>Missouri</strong> Retirement, Disability, and Death Benefit Plan (the “Plan”) financialstatements included herein are prepared using the accrual basis <strong>of</strong> accounting. Employer contributions to the plan arerecognized when due and the employer has made a formal commitment to provide the contributions. Benefits andrefunds are recognized when due and payable in accordance with the terms <strong>of</strong> the plan.Plan Description – The Plan is a single employer, defined benefit plan for all qualified employees. As authorized byState statute, the <strong>University</strong>’s Board <strong>of</strong> Curators administers the Plan and establishes its terms. Separate financialstatements and supplemental schedules are not prepared for the Plan.Total <strong>University</strong> payrolls were $987,240,000 and $919,594,000 the years ended June 30, <strong>2005</strong> and 2004, respectively,<strong>of</strong> which $766,794,000 and $720,973,000 were covered by the Plan for the respective periods. At June 30, <strong>2005</strong> and2004, membership in the Plan consisted <strong>of</strong>:<strong>2005</strong> 2004Active members:Vested 9,382 8,689Nonvested 7,469 7,656Pensioners 6,443 6,429Former Employees with Deferred Pensions 2,473 2,281Total 25,767 25,055442 0 0 5 F i n a n c i a l R e p o r t : U n i v e r s i t y o f M i s s o u r ia c o m p o n e n t u n i t o f t h e S t a t e o f M i s s o u r i
N otes to Combined Financial StatementsF o r t h e y e a r s e n d e d J u n e 3 0 , 2 0 0 5 a n d 2 0 0 4Benefit Provisions – All full-time employees are eligible for benefits after five years <strong>of</strong> credited service. The annuallifetime annuity payable to a vested employee who retires at age 65 or later is calculated as 2.2% times the number <strong>of</strong>years <strong>of</strong> service times the compensation base. Compensation base is defined as the individual’s average compensationfor the five consecutive highest salary years. Academic members who render summer teaching and research servicereceive an additional credit for such service. Pension adjustments may be approved at certain times, which increase thebenefits paid existing pensioners.Full benefits are available to members who retire at age 65 or after. Vested employees may retire prior to age 65,provided they are at least age 55 with at least ten years <strong>of</strong> credited service, or age 60 with five years <strong>of</strong> credited service.Benefits are reduced for those who retire early, unless they retire at age 62 or later with at least 25 years <strong>of</strong> creditedservice. At retirement, up to 30% <strong>of</strong> the value <strong>of</strong> the retirement annuity can be taken in a lump sum; also the single lifeannuity can be exchanged for an actuarially equivalent annuity option (elected from an array <strong>of</strong> annuities with joint andsurvivor, period certain, and guaranteed annual increase features).Vested employees who terminate prior to eligibility for retirement may elect to have 100% <strong>of</strong> the actuarial equivalent<strong>of</strong> their benefit transferred to an Individual Retirement Annuity or into another employer’s qualified plan that acceptssuch rollovers. If the actuarial equivalent is less than $20,000, it may be taken in the form <strong>of</strong> a lump sum payment.The value <strong>of</strong> the accrued benefit to a vested employee at termination or at retirement is subject to a minimum value asprovided by the Plan’s cash balance feature. This feature computes an accrual equal to 5% <strong>of</strong> the employee’s eligiblecompensation invested at 7.5% per annum.The Plan includes a provision allowing vested employees, who become disabled, to continue to accrue service credituntil they retire, and a provision which prescribes a pre-retirement death benefit for vested employees.Contributions – The <strong>University</strong>’s contributions to the Plan are equal to the actuarially determined contributionrequirement, as a percent <strong>of</strong> payroll, which averaged 6.4% and 6.7% for the years ended June 30, <strong>2005</strong> and 2004,respectively. The Plan is funded 100% by <strong>University</strong> contributions and does not require employee contributions. Thecontribution rate is updated annually, at the beginning <strong>of</strong> the <strong>University</strong>’s fiscal year on July 1, to reflect the actuariallydetermined funding requirement from the most recent valuation, as <strong>of</strong> the preceding October 1, and the adoption <strong>of</strong> anyPlan amendments during the interim.SCHEDULE OF EMPLOYER CONTRIBUTIONSRequired Supplementary Information - Unaudited(in thousands <strong>of</strong> dollars)Annual Required ContributionFiscalAs % <strong>of</strong>PercentageNet PensionYearPayrollIn DollarsContributedObligation2000 5.8% $ 37,036 100% $02001 4.4% 29,272 100% 02002 3.6% 25,319 100% 02003 2.6% 17,962 100% 02004 6.7% 48,521 100% 0<strong>2005</strong> 6.4% 49,075 100% 0The annual required contribution for the year ended June 30, <strong>2005</strong>, was determined as part <strong>of</strong> the October 1, 2003,actuarial valuation, using the entry age normal actuarial cost method.The annual required contribution for the year ended June 30, 2004, was determined as part <strong>of</strong> the October 1, 2002,actuarial valuation, using the entry age normal actuarial cost method.2 0 0 5 F i n a n c i a l R e p o r t : U n i v e r s i t y o f M i s s o u r ia c o m p o n e n t u n i t o f t h e S t a t e o f M i s s o u r i 45
N otes to Combined Financial StatementsF o r t h e y e a r s e n d e d J u n e 3 0 , 2 0 0 5 a n d 2 0 0 4Significant assumptions used in the valuations for the years ended June 30, <strong>2005</strong> and 2004 were:<strong>2005</strong> 2004Assumed Annual Rate <strong>of</strong> Return on Investments 8.0% 8.0%Projected Annual Average Salary Increases for Academic andAdministrative Employees 5.2% 5.2%Projected Annual Average Salary Increases for Clerical andService Employees 4.5% 4.5%Future Retiree Ad Hoc Increases or Cost <strong>of</strong> Living Adjustments 0.0% 0.0%The actuarial value <strong>of</strong> assets is based on the cost <strong>of</strong> the Plan’s underlying assets. Although a net pension obligation didnot exist as <strong>of</strong> June 30, <strong>2005</strong>, any future liabilities incurred would be amortized over 20 years using the level dollarmethod on an open basis.The schedule <strong>of</strong> funding progress is as follows:16. OTHER POSTEMPLOYMENT BENEFITSSCHEDULE OF FUNDING PROGRESSRequired Supplementary Information - Unaudited(in thousands <strong>of</strong> dollars)DateActuarialValue <strong>of</strong>AssetsActuarialAccruedLiabilityFundingExcess/(UnfundedLiability)FundedRatioCoveredPayrollFunding Excess/(Unfunded Liability)as a % <strong>of</strong> CoveredPayroll10/1/99 $ 1,740,756 $ 1,531,205 $ 209,551 113.7% $ 623,318 33.5 %10/1/00 1,906,678 1,686,684 219,994 113.0% 646,198 34.0 %10/1/01 2,119,047* 1,813,018 306,029 116.9% 696,163 44.0 %10/1/02 1,949,794 1,937,617 12,177 100.6% 654,575 1.9 %10/1/03 2,067,727 2,030,613 37,114 101.8% 687,681 5.4 %10/1/04 2,075,032 2,144,738 (69,706) 96.8% 753,266 (9.3)%* The actuarial value <strong>of</strong> asset methodology changes effective October 1, 2001, from the book value method, adjusted, if necessary, to bewithin 20% <strong>of</strong> market, to the expected return asset valuation method, adjusted, if necessary, to be within 20% <strong>of</strong> market.In addition to the pension benefits described in Note 15, the <strong>University</strong> provides postretirement medical, dental and lifeinsurance benefits to employees who retire from the <strong>University</strong> after attaining age 55 and before reaching age 60 withten or more years <strong>of</strong> service, or, who retire after attaining age 60 with five or more years <strong>of</strong> service. As <strong>of</strong> June 30, <strong>2005</strong>and 2004, 5,475 retirees met those eligibility requirements.For employees retiring prior to September 1, 1990, the <strong>University</strong> contributes toward premiums at the same rate as foractive employees; 2/3 <strong>of</strong> the premium for medical benefits and 1/2 <strong>of</strong> the dental plan premium. For employees whoretired under the terms <strong>of</strong> the Retirement and Death Benefit Plan on September 1, 1990 or thereafter, the <strong>University</strong>contributes toward premiums on the basis <strong>of</strong> the employee’s length <strong>of</strong> service and age at retirement.The <strong>University</strong> makes available two group term life insurance options. Option A coverage is equal to the retiree’ssalary at the date <strong>of</strong> retirement and graded adjustments in coverage made at the attainment <strong>of</strong> specific age levels.This coverage is paid in full by the <strong>University</strong>. Option B coverage is equal to two times the retiree’s salary at thedate <strong>of</strong> retirement with graded adjustments in coverage made at the attainment <strong>of</strong> specific age levels. The <strong>University</strong>pays approximately 91% <strong>of</strong> the cost <strong>of</strong> Option B coverage. Coverage for group term life insurance ends on January 1following the retiree’s 70th birthday.Postemployment medical, dental and life insurance benefits are also provided to those long-term disability claimantswho were vested in the <strong>University</strong>’s retirement plan at the date their disability began, provided the onset date <strong>of</strong> theirdisability was on or after September 1, 1990. As <strong>of</strong> June 30, <strong>2005</strong> and 2004, 228 and 214 long-term disability claimantsmet those eligibility requirements.462 0 0 5 F i n a n c i a l R e p o r t : U n i v e r s i t y o f M i s s o u r ia c o m p o n e n t u n i t o f t h e S t a t e o f M i s s o u r i
N otes to Combined Financial StatementsF o r t h e y e a r s e n d e d J u n e 3 0 , 2 0 0 5 a n d 2 0 0 4The <strong>University</strong> makes available two long-term disability options to its employees. Option A coverage is equal to 60%<strong>of</strong> the employee’s salary on the date the disability began, with full integration with benefits from other sources. OptionB coverage is equal to 66 2/3% <strong>of</strong> the employee’s salary, integrated with other benefits so that benefits from all sourceswill not exceed 85% <strong>of</strong> the employee’s salary. Both options have a 149-day waiting period and provide benefits to age65. The <strong>University</strong> pays for the full cost <strong>of</strong> Option A coverage; employees enrolled in Option B pay for the additionalcost <strong>of</strong> Option B over Option A.The terms and conditions governing the postemployment benefits to which employees are entitled are in the soleauthority and discretion <strong>of</strong> the <strong>University</strong>’s Board <strong>of</strong> Curators.Postemployment benefit costs, other than long-term disability, are funded on a current basis and the amounts recordedas expense <strong>of</strong> $14,805,000 and $16,647,000 for the years ended June 30, <strong>2005</strong> and 2004, respectively, are on a pay-asyou-gobasis. Long-term disability costs are recognized during the period in which the employee becomes eligible toreceive disability benefits and amounted to $1,182,000 and $4,380,000 for the years ended June 30, <strong>2005</strong> and 2004,respectively.17. SEGMENT INFORMATIONA segment is an identifiable activity reported within a stand-alone entity for which one or more revenue bonds areoutstanding. A segment has a specific identifiable revenue stream pledged in support <strong>of</strong> revenue bonds and has relatedexpenses, gains and losses, assets and liabilities that are required by an external party to be accounted for separately.The <strong>University</strong> has two segments that meet the reporting requirements <strong>of</strong> GASB Statement No. 37.The outstanding debt <strong>of</strong> the <strong>University</strong> consists <strong>of</strong> <strong>System</strong> Facility Revenue Bonds and Health Facilities RevenueBonds. The <strong>System</strong> Facility Revenue Bonds are issued in accordance with a Resolution adopted by the Board <strong>of</strong>Curators in October 1993. The Resolution provides that the bonds are payable from the gross income and revenuesderived from the related facilities including student fees, housing, dining, bookstore and parking revenues and variousother <strong>University</strong> revenues.The Health Facilities Revenue Bonds are limited obligation bonds secured by revenues <strong>of</strong> the Health <strong>System</strong>. TheHealth <strong>System</strong> consists <strong>of</strong> the <strong>University</strong> <strong>of</strong> <strong>Missouri</strong> Hospitals and Clinics, which includes the <strong>University</strong> <strong>of</strong> <strong>Missouri</strong>Hospital, Ellis Fischel Cancer Center, Rusk Rehabilitation Center and the Children’s Hospital; the <strong>University</strong> PhysiciansMedical Practice Plan, which includes faculty <strong>of</strong> the <strong>University</strong> <strong>of</strong> <strong>Missouri</strong>-Columbia School <strong>of</strong> Medicine; and the<strong>Missouri</strong> Rehabilitation Center.2 0 0 5 F i n a n c i a l R e p o r t : U n i v e r s i t y o f M i s s o u r ia c o m p o n e n t u n i t o f t h e S t a t e o f M i s s o u r i 47
N otes to Combined Financial StatementsF o r t h e y e a r s e n d e d J u n e 3 0 , 2 0 0 5 a n d 2 0 0 4Summary financial information for the <strong>System</strong> Facility and the Health Facilities Revenue Bonds as <strong>of</strong> June 30, <strong>2005</strong>and 2004, is as follows (in thousands <strong>of</strong> dollars):<strong>System</strong> FacilityRevenue BondsHealth FacilitiesRevenue Bonds<strong>2005</strong> 2004 <strong>2005</strong> 2004Condensed Statements <strong>of</strong> Net AssetsAssets:Current Assets $ 69,160 $ 118,525 $ 157,521 $ 119,305Capital Assets, Net 470,679 423,599 232,862 218,700Noncurrent Assets 9,380 10,940 118,637 140,013Total Assets $ 549,219 $ 553,064 $ 509,020 $ 478,018Liabilities:Current Liabilities $ 32,322 $ 31,006 $ 52,572 $ 51,689Noncurrent Liabilities 392,186 401,832 227,554 231,070Total Liabilities 424,508 432,838 280,126 282,759Net Assets:Invested in Capital Assets, Net <strong>of</strong> Related Debt 67,429 47,332 60,328 42,700Restricted -Nonexpendable 555 543Expendable 1,857 8,447 2,919 2,918Unrestricted 55,425 64,447 165,092 149,098Total Net Assets 124,711 120,226 228,894 195,259Total Liabilities and Net Assets $ 549,219 $ 553,064 $ 509,020 $ 478,018Condensed Statements <strong>of</strong> Revenues, Expensesand Changes in Net AssetsOperating Revenues:Net Patient Revenue $ - $ - $ 542,150 $ 473,168Net Tuition and Fees 12,414 8,928Bookstore 50,422 44,373Housing and Related Food Service 57,668 53,419Parking 12,975 12,189Other Operating Revenue 1,368 1,121 14,789 14,892Total Operating Revenues 134,847 120,030 556,939 488,060Operating Expenses:Depreciation 13,707 11,045 26,121 24,552All Other Operating Expenses 105,181 99,100 508,233 444,018Total Operating Expenses 118,888 110,145 534,354 468,570Operating Income (Loss) 15,959 9,885 22,585 19,490Nonoperating Revenues (Expenses) (10,392) (10,776) 15,652 15,990Income (Loss) Before Transfers 5,567 (891) 38,237 35,480Transfer (To) From Other <strong>University</strong> Units (1,082) 14,310 (4,602) (9,101)Increase (Decrease) in Net Assets 4,485 13,419 33,635 26,379Net Assets, Beginning <strong>of</strong> Year 120,226 106,807 195,259 168,880Net Assets, End <strong>of</strong> Year $ 124,711 $ 120,226 $ 228,894 $ 195,259Condensed Statements <strong>of</strong> Cash FlowsNet Cash Flows Provided by Operating Activities $ 28,356 $ 21,280 $ 36,171 $ 19,408Net Cash Flows Provided by (Used In) InvestingActivities 4,432 (1,752) 18,869 (12,390)Net Cash Flows Provided by (Used In) Capital andRelated Financing Activities (83,003) 15,733 (55,800) (29,653)Net Cash Flows Provided by (Used In) NoncapitalFinancing Activities 17,375 14,257Net Increase (Decrease) in Cash and Cash Equivalents (50,215) 35,261 16,615 (8,378)Cash and Cash Equivalents, Beginning <strong>of</strong> Year 105,499 70,238 16,255 24,633Cash and Cash Equivalents, End <strong>of</strong> Year $ 55,284 $ 105,499 $ 32,870 $ 16,255482 0 0 5 F i n a n c i a l R e p o r t : U n i v e r s i t y o f M i s s o u r ia c o m p o n e n t u n i t o f t h e S t a t e o f M i s s o u r i
N otes to Combined Financial StatementsF o r t h e y e a r s e n d e d J u n e 3 0 , 2 0 0 5 a n d 2 0 0 418. OPERATING EXPENSES BY FUNCTIONThe operating expenses <strong>of</strong> the <strong>University</strong> are presented based on natural expenditure classifications. The <strong>University</strong>’soperating expenses by functional classification are as follows:For the Year Ended June 30, <strong>2005</strong>(in thousands <strong>of</strong> dollars)Functional ClassificationSalariesandWagesStaffBenefitsSupplies,Servicesand OtherOperatingExpensesScholarshipsandFellowships Depreciation TotalInstruction $307,880 $ 67,272 $ 49,924 $ - $ - $ 425,076Research 100,890 20,082 79,066 200,038Public Service 69,608 17,024 54,809 141,441Academic Support 66,679 16,197 27,344 110,220Student Services 36,744 8,215 20,738 65,697Institutional Support 79,771 19,932 (4,964) 94,739Operation and Maintenance <strong>of</strong> Plant 28,932 7,487 20,971 57,390Auxiliary Enterprises 296,736 70,760 348,507 716,003Scholarships and Fellowships 30,783 30,783Depreciation 102,414 102,414Total Operating Expenses $987,240 $226,969 $ 596,395 $ 30,783 $ 102,414 $ 1,943,801For the Year Ended June 30, 2004(in thousands <strong>of</strong> dollars)Functional ClassificationSalariesandWagesStaffBenefitsSupplies,Servicesand OtherOperatingExpensesScholarshipsandFellowships Depreciation TotalInstruction $288,166 $ 61,467 $ 52,247 $ - $ - $ 401,880Research 102,305 20,593 80,580 203,478Public Service 66,639 16,604 53,544 136,787Academic Support 58,458 16,722 21,029 96,209Student Services 32,982 7,043 24,120 64,145Institutional Support 72,583 18,116 (10,024) 80,675Operation and Maintenance <strong>of</strong> Plant 28,617 7,463 6,566 42,646Auxiliary Enterprises 269,844 66,170 288,704 624,718Scholarships and Fellowships 25,755 25,755Depreciation 89,774 89,774Total Operating Expenses $919,594 $214,178 $ 516,766 $ 25,755 $ 89,774 $ 1,766,0672 0 0 5 F i n a n c i a l R e p o r t : U n i v e r s i t y o f M i s s o u r ia c o m p o n e n t u n i t o f t h e S t a t e o f M i s s o u r i 49
N otes to Combined Financial StatementsF o r t h e y e a r s e n d e d J u n e 3 0 , 2 0 0 5 a n d 2 0 0 419. DISCRETELY PRESENTED COMPONENT UNITSThe Discretely Presented Component Units columns in the financial statements include the financial data <strong>of</strong> the MedicalAlliance and <strong>Missouri</strong> Care L.C.The Medical Alliance, a not-for-pr<strong>of</strong>it corporation, provides an integrated health care delivery system for mid-<strong>Missouri</strong>by establishing affiliations with various medical facilities. Capital Region Medical Center in Jefferson City, <strong>Missouri</strong>,operates as an affiliate <strong>of</strong> the Medical Alliance and provides inpatient, outpatient and emergency care services to thesurrounding community.<strong>Missouri</strong> Care L.C. is a not-for-pr<strong>of</strong>it health maintenance organization which provides services to patients in central<strong>Missouri</strong> under a certification from the <strong>Missouri</strong> Department <strong>of</strong> Social Services. <strong>Missouri</strong> Care L.C. has contractedwith the <strong>University</strong> <strong>of</strong> <strong>Missouri</strong> Healthcare <strong>System</strong> as a major provider <strong>of</strong> health care services to the organization’smembers.The amounts shown in the Discretely Presented Component Units columns <strong>of</strong> the Statements <strong>of</strong> Net Assets andStatements <strong>of</strong> Revenues, Expenses and Changes in Net Assets relate to the Medical Alliance, including Capital RegionMedical Center, and <strong>Missouri</strong> Care L.C. In the Statements <strong>of</strong> Net Assets, Medical Alliance is presented as <strong>of</strong> June 30,<strong>2005</strong> and 2004 and <strong>Missouri</strong> Care L.C. as <strong>of</strong> December 31, 2004, to coincide with its calendar year end, and as <strong>of</strong> June30, 2004 as reported in the <strong>University</strong>’s financial statements for fiscal year ended June 30, 2004. In the Statements <strong>of</strong>Revenues, Expenses and Changes in Net Assets, Medical Alliance is presented for the years ended June 30, <strong>2005</strong> and2004 and <strong>Missouri</strong> Care L.C. for the six months ended December 31, 2004 and for the twelve months ended June 30,2004 as reported in the <strong>University</strong>’s financial statements for fiscal year ended June 30, 2004. The Condensed Statements<strong>of</strong> Net Assets and Condensed Statements <strong>of</strong> Revenues, Expenses and Changes in Net Assets for these periods areshown below (in thousands <strong>of</strong> dollars):Condensed Statements <strong>of</strong>Net AssetsMedicalAlliance<strong>2005</strong> 2004<strong>Missouri</strong>Medical<strong>Missouri</strong>Care L.C.TotalAllianceCare L.C.TotalAssets:Current Assets $ 22,064 $ 14,423 $ 36,487 $ 25,405 $ 11,440 $ 36,845Capital Assets, Net 66,567 66,567 57,069 57,069Noncurrent Assets 45,965 1,027 46,992 44,785 1,031 45,816Total Assets $ 134,596 $ 15,450 $ 150,046 $ 127,259 $ 12,471 $ 139,730Liabilities:Current Liabilities $ 14,937 $ 9,712 $ 24,649 $ 13,775 $ 7,814 $ 21,589Noncurrent Liabilities 38,990 38,990 39,954 39,954Total Liabilities 53,927 9,712 63,639 53,729 7,814 61,543Net Assets:Invested in Capital Assets,Net <strong>of</strong> Related Debt 27,199 27,199 17,260 17,260Restricted -Expendable 1,640 1,640 3,844 1,031 4,875Unrestricted 51,830 5,738 57,568 52,426 3,626 56,052Total Net Assets 80,669 5,738 86,407 73,530 4,657 78,187Total Liabilities andNet Assets $ 134,596 $ 15,450 $ 150,046 $ 127,259 $ 12,471 $ 139,730502 0 0 5 F i n a n c i a l R e p o r t : U n i v e r s i t y o f M i s s o u r ia c o m p o n e n t u n i t o f t h e S t a t e o f M i s s o u r i
N otes to Combined Financial StatementsF o r t h e y e a r s e n d e d J u n e 3 0 , 2 0 0 5 a n d 2 0 0 4Condensed Statements <strong>of</strong> Revenues,Expenses and Changes in Net Assets<strong>2005</strong> 2004Medical<strong>Missouri</strong>Medical<strong>Missouri</strong>AllianceCare L.C.TotalAllianceCare L.C.TotalOperating Revenues:Net Patient Revenue $ 123,745 $ - $ 123,745 $ 112,448 $ - $ 112,448Other Operating Revenue 37,202 37,202 41,314 41,314Total Operating Revenues 123,745 37,202 160,947 112,448 41,314 153,762Operating Expenses:Salaries and Wages 46,952 46,952 44,246 44,246Staff Benefits 12,018 12,018 10,692 10,692Supplies, Services and OtherOperating Expenses 51,244 36,121 87,365 46,007 41,355 87,362Depreciation 7,758 7,758 7,251 45 7,296Total Operating Expenses 117,972 36,121 154,093 108,196 41,400 149,596Operating Income (Loss) 5,773 1,081 6,854 4,252 (86) 4,166Nonoperating Revenues(Expenses):Investment Income 1,024 1,024 300 300Private Gifts 42 42 203 203Interest Expense (1,340) (1,340) (1,236) (1,236)Other NonoperatingRevenues (Expenses) 1,640 1,640Net Nonoperating Revenues(Expenses) 1,366 1,366 (733) (733)Increase (Decrease) in Net Assets 7,139 1,081 8,220 3,519 (86) 3,433Net Assets, Beginning <strong>of</strong> Year 73,530 4,657 78,187 70,011 4,743 74,754Net Assets, End <strong>of</strong> Year $ 80,669 $ 5,738 $ 86,407 $ 73,530 $ 4,657 $ 78,18720. 2004 RESTATEMENTSubsequent to the issuance <strong>of</strong> the <strong>University</strong>’s 2004 financial statements, the <strong>University</strong>’s management determined thatmisstatements had occurred in recording certain pledges receivable and the related revenue, summer academic sessiondeferred tuition revenue and related prepaid expenses, timing <strong>of</strong> recording payables related to construction in progressand the depreciation <strong>of</strong> library book acquisitions.In accordance with the provisions <strong>of</strong> GASB Statement No. 33, “Accounting and Financial Reporting for NonexchangeTransactions”, pledges receivable are recorded and revenue is recognized when a pledge is received and all eligibilityrequirements, including time requirements, are met. In fiscal year 2004, pledges receivable were recorded and revenuewas recognized for certain pledges received during fiscal year 2004 for which all eligibility requirements had not beenmet. The revenue recognition for these pledges will occur in subsequent fiscal years when all eligibility requirementsare met.In accordance with generally accepted accounting principles, revenues should be recorded in the periods earned andapplicable expenses should be recorded in the periods incurred. The deferred revenues for summer session student feesand related expenditures have been restated to record the portion <strong>of</strong> summer session student fees earned and relatedexpenditures incurred prior to June 30 in the current fiscal year and the portion after June 30 in the following fiscalyear.2 0 0 5 F i n a n c i a l R e p o r t : U n i v e r s i t y o f M i s s o u r ia c o m p o n e n t u n i t o f t h e S t a t e o f M i s s o u r i 51
N otes to Combined Financial StatementsF o r t h e y e a r s e n d e d J u n e 3 0 , 2 0 0 5 a n d 2 0 0 4The <strong>University</strong> has previously capitalized library books as inexhaustible assets that have not been subject to depreciation.In the restated financial statements, library holdings are treated as exhaustible assets and are depreciated on a straightlinebasis over an estimated useful life <strong>of</strong> 20 years.The impact <strong>of</strong> these misstatements and the related restatements are summarized in the following table:2004as PreviouslyReportedAdjustments2004as RestatedAt June 30:Current Pledges Receivable, Net $ 22,749 $ (15,035) $ 7,714Prepaid Expenses and Other Current Assets 22,387 (9,313) 13,074Pledges Receivable, Net 47,905 (31,634) 16,271Capital Assets, Net 1,807,986 (107,662) 1,700,324Accounts Payable 86,272 2,076 88,348Deferred Revenue 51,451 (14,962) 36,489For the Year Ending June 30:Operating Loss before State Appropriations andNonoperating Revenue (414,402) (8,459) (422,861)Net Other Nonoperating Revenues before Transfers 265,121 (40,625) 224,496Net Assets, Beginning <strong>of</strong> Year:Invested in Capital Assets, Net <strong>of</strong> Related Debt 1,177,275 (102,690) 1,074,585Restricted – Expendable 323,442 (6,044) 317,398Unrestricted 535,500 7,060 542,560Increase in Net Assets 272,068 (49,084) 222,984Net Assets, End <strong>of</strong> Year:Invested in Capital Assets, Net <strong>of</strong> Related Debt 1,257,210 (109,738) 1,147,472Restricted – Expendable 352,325 (46,669) 305,656Unrestricted 635,901 5,649 641,550In addition, accrued liabilities for Capital Region Medical Center, an affiliate <strong>of</strong> the Medical Alliance included in the2004 combined financial statements, have been restated to increase claims incurred but not reported for the medicalpr<strong>of</strong>essional liability based on a third-party actuarial analysis. The effects <strong>of</strong> the restatement are summarized in thefollowing table:2004as PreviouslyReportedAdjustments2004as RestatedAt June 30:Accrued Liabilities $ 7,678 $ 1,457 $ 9,135For the Year Ending June 30:Net Assets, Beginning <strong>of</strong> Year -Unrestricted 17,896 (1,457) 16,439522 0 0 5 F i n a n c i a l R e p o r t : U n i v e r s i t y o f M i s s o u r ia c o m p o n e n t u n i t o f t h e S t a t e o f M i s s o u r i
N otes to Combined Financial StatementsF o r t h e y e a r s e n d e d J u n e 3 0 , 2 0 0 5 a n d 2 0 0 421. SUBSEQUENT EVENTSOn July 1, <strong>2005</strong>, the <strong>University</strong> sold $80,000,000 <strong>of</strong> capital project notes at an effective interest rate <strong>of</strong> 2.6%. The noteswill be repaid in full by June 30, 2006. Proceeds from the issuance <strong>of</strong> the capital project notes will be used to fundvarious construction projects <strong>of</strong> the <strong>University</strong>.In October <strong>2005</strong>, the Board <strong>of</strong> Curators approved the issue <strong>of</strong> new bonds. In January 2006, the <strong>University</strong> expects toissue <strong>System</strong> Facilities Revenue Bonds, Series 2006, in the amount <strong>of</strong> $350 million. Proceeds from the issuance <strong>of</strong> theSeries 2006 bonds will be used to finance construction <strong>of</strong> new housing facilities and renovations and improvements toexisting housing facilities on the Columbia and St. Louis campuses and various other projects, advance refunding <strong>of</strong>previously issued series <strong>of</strong> revenue bonds, payment <strong>of</strong> capitalized interest on a portion <strong>of</strong> the Series 2006 Bonds, andpayment <strong>of</strong> costs <strong>of</strong> issuance <strong>of</strong> the Series 2006 Bonds.On October 3, <strong>2005</strong>, the Circuit Court <strong>of</strong> St. Louis County, <strong>Missouri</strong> approved the settlement <strong>of</strong> a case filed in January1998 relating to charging tuition by the <strong>University</strong> for undergraduate education, as discussed in Note 14. The judgment,order and decree (the “order”) which approved this settlement was scheduled to become final 30 days after the date <strong>of</strong>the order and an additional 10 days thereafter for possible notice <strong>of</strong> appeal. Any appeal <strong>of</strong> the order was required to befiled within this 30-day time period or within 10 days after the date on which the order becomes final. On November7, <strong>2005</strong>, within the time period for filing a timely Notice <strong>of</strong> Appeal, one <strong>of</strong> the class members who objected to thesettlement and sought to intervene filed a Notice <strong>of</strong> Appeal. On December 22, <strong>2005</strong>, the appeal was dismissed withprejudice and the litigation has reached a conclusion. The <strong>University</strong> will proceed to establish the scholarship fundcalled for in the settlement agreement.*******2 0 0 5 F i n a n c i a l R e p o r t : U n i v e r s i t y o f M i s s o u r ia c o m p o n e n t u n i t o f t h e S t a t e o f M i s s o u r i 53
542 0 0 5 F i n a n c i a l R e p o r t : U n i v e r s i t y o f M i s s o u r ia c o m p o n e n t u n i t o f t h e S t a t e o f M i s s o u r i