Ford's full FHR report - Rapid Ratings
Ford's full FHR report - Rapid Ratings
Ford's full FHR report - Rapid Ratings

You also want an ePaper? Increase the reach of your titles
YUMPU automatically turns print PDFs into web optimized ePapers that Google loves.
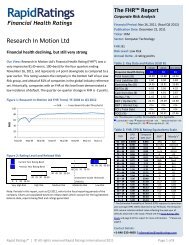
Sales Performance (16): Considering operating revenue relative to assets, equity, working capital and other measures, this<br />
score experienced a significant improvement over the prior year, and suggests that Ford Motor Co outperformed only 16% of<br />
its global industry reference set. Ford Motor Co is making an exceedingly poor gross return on capital invested.<br />
Figure 8: Ford Motor Co's Sales Performance Score over time and Sector Measures for the YE 2011 period<br />
Performance Score<br />
100<br />
80<br />
60<br />
40<br />
20<br />
0<br />
Mar-04 Mar-05 Mar-06 Mar-07 Mar-08 Mar-09 Mar-10 Mar-11<br />
<strong>FHR</strong> Report<br />
Ford Motor Co, February 24, 2012<br />
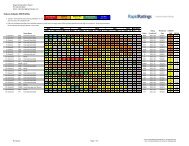
Working Capital Efficiency (23): This score measures management's success in working capital efficiency utilizing various<br />
measures of the current position in combination with other balance sheet and income statement elements. Modestly weaker<br />
than the prior year, the score indicates significant underperformance in this aspect of balance sheet management.<br />
Figure 9: Ford Motor Co's Working Capital Efficiency Performance Score over time and Sector Measures for the YE 2011<br />
period<br />
Performance Score<br />
100<br />
80<br />
60<br />
40<br />
20<br />
0<br />
Mar-04 Mar-05 Mar-06 Mar-07 Mar-08 Mar-09 Mar-10 Mar-11<br />
<strong>Rapid</strong> <strong>Ratings</strong> | © All rights reserved <strong>Rapid</strong> <strong>Ratings</strong> International 2012 Page 6 of 9<br />
100<br />
80<br />
60<br />
40<br />
20<br />
0<br />
100<br />
80<br />
60<br />
40<br />
20<br />
0<br />
F Sector Average<br />
Sector Leaders Sector Laggards<br />
F Sector Average<br />
Sector Leaders Sector Laggards