Ford's full FHR report - Rapid Ratings
Ford's full FHR report - Rapid Ratings
Ford's full FHR report - Rapid Ratings

You also want an ePaper? Increase the reach of your titles
YUMPU automatically turns print PDFs into web optimized ePapers that Google loves.
Section 6: Ford Motor Co Income Statement<br />
Table 5: Ford Motor Co Income Statement for the 12 months ending December 31, 2011<br />
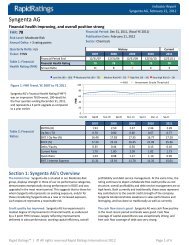
<strong>FHR</strong> Report<br />
Ford Motor Co, February 24, 2012<br />
(in USD B)<br />
Revenue<br />
2003 2004 2005 2006 2007 2008 2009 2010 2011<br />
1. Sales Revenue 164.34 172.32 176.90 160.06 172.46 146.28 118.31 128.95 136.26<br />
2. Other Income 0.00 0.00 0.00 0.00 0.00 0.00 0.00 0.00 0.00<br />
3. Total Operating Revenue (1+2)<br />
Cost of Goods Sold<br />
164.34 172.32 176.90 160.06 172.46 146.28 118.31 128.95 136.26<br />
4. Cost of Goods Sold 136.00 143.00 152.12 156.65 151.26 134.85 105.33 108.80 116.96<br />
5. Gross Profit (1-4)<br />
Operating Expenditure<br />
28.33 29.31 24.77 3.41 21.19 11.43 12.98 20.16 19.30<br />
6. Salaries and Wages 0.00 0.00 0.00 0.00 0.00 0.00 0.00 0.00 0.00<br />
7. Depreciation 8.78 6.62 5.85 5.29 6.29 9.11 3.94 2.02 1.84<br />
8. Amortization 5.52 6.42 8.16 11.22 7.45 3.22 4.25 4.58 3.61<br />
9. Other Operating Expenditure 10.28 12.19 10.39 2.87 4.23 3.37 8.65 3.62 19.70<br />
10. Total Operating Expenditure<br />
(6+7+8+9)<br />
24.58 25.22 24.40 19.39 17.96 15.70 16.84 10.23 25.15<br />
11. Total Cash Expenditure 147.74 157.06 162.88 157.86 156.45 140.21 115.56 114.82 125.93<br />
12. Other Income (as per item 2) 0.00 0.00 0.00 0.00 0.00 0.00 0.00 0.00 0.00<br />
13. Abnormal Items -2.06 – -0.71 -11.92 -3.87 -7.61 2.55 -1.15 14.02<br />
14. Other Operating Items (12 + 13) -2.06 0.00 -0.71 -11.92 -3.87 -7.61 2.55 -1.15 14.02<br />
15. Earnings Before Interest & Tax<br />
(5-10+14)<br />
Net Investment Income<br />
1.69 4.09 -0.33 -27.90 -0.64 -11.87 -1.31 8.78 8.17<br />
16. Investment Income 0.10 0.26 1.38 12.41 0.00 0.00 5.53 0.00 0.85<br />
17. Interest Received 0.87 0.99 1.25 1.41 1.71 0.95 0.32 0.35 0.47<br />
18. Interest Expense 1.32 1.22 1.22 0.99 2.25 1.94 1.51 1.81 0.82<br />
19. Other Investment Expense 0.00 0.00 0.00 0.00 2.56 1.54 0.00 0.17 0.00<br />
20. Net Investment Income Total<br />
(16+17-18-19)<br />
-0.35 0.02 1.41 12.83 -3.10 -2.53 4.33 -1.63 0.51<br />
21. Net Profit Before Tax<br />
(NPBT; 15+20)<br />
1.34 4.11 1.08 -15.07 -3.75 -14.40 3.03 7.15 8.68<br />
22. Company Tax Expense 0.12 0.64 -0.84 -2.65 -1.29 0.06 0.07 0.59 -11.54<br />
23. Net Profit After Tax (NPAT; 21-22) 1.22 3.47 1.92 -12.42 -2.45 -14.47 2.96 6.56 20.22<br />
24. Minority Interests 0.31 0.28 0.28 0.21 0.31 0.21 0.24 0.00 0.01<br />
25. Net Extraordinary Income -0.41 -0.15 -0.20 0.02 0.04 0.01 0.01 0.00 0.00<br />
26. Net Surplus (23-24+25) 0.49 3.04 1.44 -12.61 -2.72 -14.67 2.72 6.56 20.21<br />
<strong>Rapid</strong> <strong>Ratings</strong> | © All rights reserved <strong>Rapid</strong> <strong>Ratings</strong> International 2012 Page 8 of 9