

Oral Health inside - Communities and Local Government
Oral Health inside - Communities and Local Government
Oral Health inside - Communities and Local Government

Create successful ePaper yourself
Turn your PDF publications into a flip-book with our unique Google optimized e-Paper software.
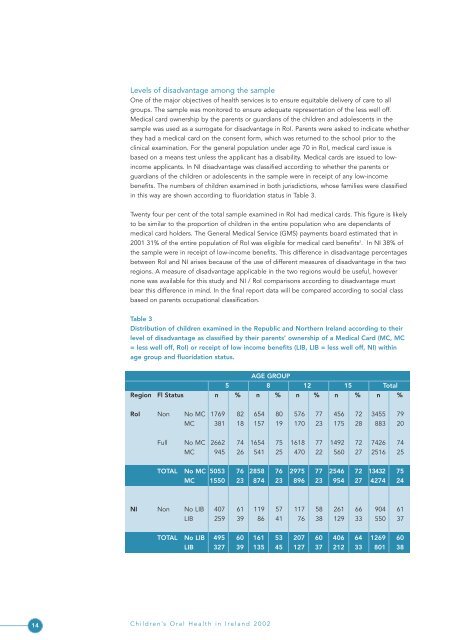
Levels of disadvantage among the sampleOne of the major objectives of health services is to ensure equitable delivery of care to allgroups. The sample was monitored to ensure adequate representation of the less well off.Medical card ownership by the parents or guardians of the children <strong>and</strong> adolescents in thesample was used as a surrogate for disadvantage in RoI. Parents were asked to indicate whetherthey had a medical card on the consent form, which was returned to the school prior to theclinical examination. For the general population under age 70 in RoI, medical card issue isbased on a means test unless the applicant has a disability. Medical cards are issued to lowincomeapplicants. In NI disadvantage was classified according to whether the parents orguardians of the children or adolescents in the sample were in receipt of any low-incomebenefits. The numbers of children examined in both jurisdictions, whose families were classifiedin this way are shown according to fluoridation status in Table 3.Twenty four per cent of the total sample examined in RoI had medical cards. This figure is likelyto be similar to the proportion of children in the entire population who are dependants ofmedical card holders. The General Medical Service (GMS) payments board estimated that in2001 31% of the entire population of RoI was eligible for medical card benefits 2 . In NI 38% ofthe sample were in receipt of low-income benefits. This difference in disadvantage percentagesbetween RoI <strong>and</strong> NI arises because of the use of different measures of disadvantage in the tworegions. A measure of disadvantage applicable in the two regions would be useful, howevernone was available for this study <strong>and</strong> NI / RoI comparisons according to disadvantage mustbear this difference in mind. In the final report data will be compared according to social classbased on parents occupational classification.Table 3Distribution of children examined in the Republic <strong>and</strong> Northern Irel<strong>and</strong> according to theirlevel of disadvantage as classified by their parents’ ownership of a Medical Card (MC, MC= less well off, RoI) or receipt of low income benefits (LIB, LIB = less well off, NI) withinage group <strong>and</strong> fluoridation status.AGE GROUP5 8 12 15 TotalRegion Fl Status n % n % n % n % n %RoI Non No MC 1769 82 654 80 576 77 456 72 3455 79MC 381 18 157 19 170 23 175 28 883 20Full No MC 2662 74 1654 75 1618 77 1492 72 7426 74MC 945 26 541 25 470 22 560 27 2516 25TOTAL No MC 5053 76 2858 76 2975 77 2546 72 13432 75MC 1550 23 874 23 896 23 954 27 4274 24NI Non No LIB 407 61 119 57 117 58 261 66 904 61LIB 259 39 86 41 76 38 129 33 550 37TOTAL No LIB 495 60 161 53 207 60 406 64 1269 60LIB 327 39 135 45 127 37 212 33 801 3814 Children’s <strong>Oral</strong> <strong>Health</strong> in Irel<strong>and</strong> 2002


