

Oral Health inside - Communities and Local Government
Oral Health inside - Communities and Local Government
Oral Health inside - Communities and Local Government

You also want an ePaper? Increase the reach of your titles
YUMPU automatically turns print PDFs into web optimized ePapers that Google loves.
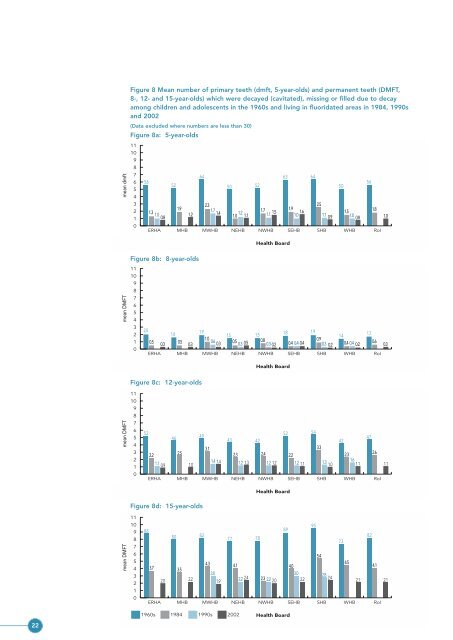
mean dmftFigure 8 Mean number of primary teeth (dmft, 5-year-olds) <strong>and</strong> permanent teeth (DMFT,8-, 12- <strong>and</strong> 15-year-olds) which were decayed (cavitated), missing or filled due to decayamong children <strong>and</strong> adolescents in the 1960s <strong>and</strong> living in fluoridated areas in 1984, 1990s<strong>and</strong> 2002(Data excluded where numbers are less than 30)Figure 8a: 5-year-olds111098765432105.61.31.00.8ERHA5.21.9MHB6.42.31.71.2 1.4MWHB5.0 5.2NEHBNWHB6.3 6.42.51.7 1.91.51.81.2 1.01.1 1.5 1.61.11.0 1.1 0.9 1.00.8 1.0SEHBSHB5.0WHB5.6RoI1960s19841990s2002<strong>Health</strong> Boardmean DMFTFigure 8b: 8-year-olds111098765432.021.61.91.5 1.51.8 1.91.41.71.010.5 0.50.60.5 0.80.90.40.4 0.60.3 0.3 0.3 0.3 0.5 0.3 0.2 0.4 0.4 0.3 0.2 0.40.2 0.30ERHA MHB MWHB NEHB NWHB SEHB SHB WHB RoI1960s19841990s2002<strong>Health</strong> BoardFigure 8c: 12-year-oldsmean DMFT111098765432105.22.2 2.5ERHA4.61.1 0.9 1.0MHB5.2 5.44.94.74.3 4.24.23.13.32.3 2.4 2.22.32.61.4 1.4 1.2 1.2 1.2 1.31.61.3 1.2 1.1 1.01.1 1.1MWHBNEHBNWHBSEHBSHBWHBRoI1960s19841990s2002<strong>Health</strong> BoardFigure 8d: 15-year-oldsmean DMFT111098765432108.83.7 3.5ERHA8.0 8.22.0 2.2MHB4.3 4.13.0MWHB1.97.7 7.83.0 2.82.2 2.42.32.2 2.0 2.2 2.42.1 2.1NEHBNWHB8.94.0SEHB9.55.4SHB7.34.5WHB8.24.1RoI1960s19841990s2002<strong>Health</strong> Board22


