Algebra II Curriculum Map - Claremore Public Schools
Algebra II Curriculum Map - Claremore Public Schools
Algebra II Curriculum Map - Claremore Public Schools
Create successful ePaper yourself
Turn your PDF publications into a flip-book with our unique Google optimized e-Paper software.
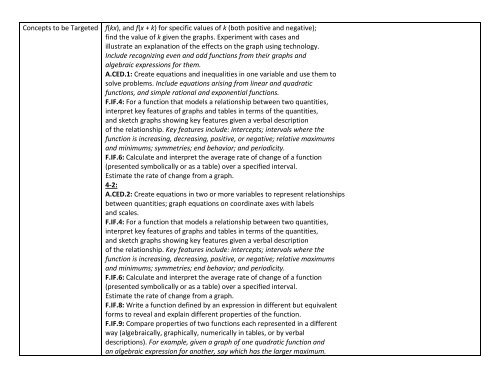
Concepts to be Targetedf(kx), and f(x + k) for specific values of k (both positive and negative);find the value of k given the graphs. Experiment with cases andillustrate an explanation of the effects on the graph using technology.Include recognizing even and odd functions from their graphs andalgebraic expressions for them.A.CED.1: Create equations and inequalities in one variable and use them tosolve problems. Include equations arising from linear and quadraticfunctions, and simple rational and exponential functions.F.IF.4: For a function that models a relationship between two quantities,interpret key features of graphs and tables in terms of the quantities,and sketch graphs showing key features given a verbal descriptionof the relationship. Key features include: intercepts; intervals where thefunction is increasing, decreasing, positive, or negative; relative maximumsand minimums; symmetries; end behavior; and periodicity.F.IF.6: Calculate and interpret the average rate of change of a function(presented symbolically or as a table) over a specified interval.Estimate the rate of change from a graph.4-2:A.CED.2: Create equations in two or more variables to represent relationshipsbetween quantities; graph equations on coordinate axes with labelsand scales.F.IF.4: For a function that models a relationship between two quantities,interpret key features of graphs and tables in terms of the quantities,and sketch graphs showing key features given a verbal descriptionof the relationship. Key features include: intercepts; intervals where thefunction is increasing, decreasing, positive, or negative; relative maximumsand minimums; symmetries; end behavior; and periodicity.F.IF.6: Calculate and interpret the average rate of change of a function(presented symbolically or as a table) over a specified interval.Estimate the rate of change from a graph.F.IF.8: Write a function defined by an expression in different but equivalentforms to reveal and explain different properties of the function.F.IF.9: Compare properties of two functions each represented in a differentway (algebraically, graphically, numerically in tables, or by verbaldescriptions). For example, given a graph of one quadratic function andan algebraic expression for another, say which has the larger maximum.


