RHEL Kernel Performance Optimization, Characterization ... - Red Hat
RHEL Kernel Performance Optimization, Characterization ... - Red Hat
RHEL Kernel Performance Optimization, Characterization ... - Red Hat
- No tags were found...

You also want an ePaper? Increase the reach of your titles
YUMPU automatically turns print PDFs into web optimized ePapers that Google loves.
<strong>RHEL</strong> <strong>Kernel</strong> <strong>Performance</strong> <strong>Optimization</strong>,<strong>Characterization</strong> and TuningLarry WoodmanJohn Shakshober
AgendaSection 1 – System overviewSection 2 Analyzing System <strong>Performance</strong>Section 3 Tuning <strong>Red</strong>hat Enterprise LinuxSection 4 – Perfomance Analysis and Tuning ExamplesReferences
Section 1 System Overview Processors NUMA Memory Management File System & Disk IO
Processors Supported/Tested<strong>RHEL</strong>4 Limitations●x86 – 16●●x86_64 – 8, 512(LargeSMP)ia64 – 8, 64(SGI)<strong>RHEL</strong>5 Limitations●x86 – 32●x86_64 – 256●ia64 1024
Processor typesUniProcessorSymmetric Multi ProcessorMultiCoreSymmetric MultiThread
NUMA Support<strong>RHEL</strong>3 NUMA Support●●Basic multinode supportLocal memory allocation<strong>RHEL</strong>4 NUMA Support●●●NUMA aware memory allocation policyNUMA aware memory reclamationMulticore support<strong>RHEL</strong>5 NUMA Support●●●●NUMA aware schedulingCPUsetsNUMAaware slab allocatorNUMAaware hugepages
AMD64 System Numa Memory LayoutS1S2Process on S1C0C0 C1 C0 C1SSSSSSSSSSSSMemoryMemory123412341234Interleaved (NonNUMA)C0 C1 C0 C1Process on S1C0MemoryS3MemoryS4S1 S2 S3 S4NonInterleaved (NUMA)
Memory ManagementPhysical Memory(RAM) ManagementVirtual Address Space Maps<strong>Kernel</strong> Wired MemoryReclaimable User MemoryPage Reclaim Dynamics
Physical Memory Supported/Tested<strong>RHEL</strong>3 Limitations●●●x86 – 64GBx86_64 – 64GBia64 – 128GB<strong>RHEL</strong>4 Limitations●●●x86 – 64GBx86_64 – 128GBia64 – 1TB<strong>RHEL</strong>5 Limitations●●●x86 – 64GBx86_64 – 256GBia64 2TB
Memory Zone UtilizationDMA Normal Highmem(x86)24bit I/O<strong>Kernel</strong> Static<strong>Kernel</strong> Dynamicslabcachebounce buffersdriver allocationsUser OverflowUserAnonymousPagecachePagetables
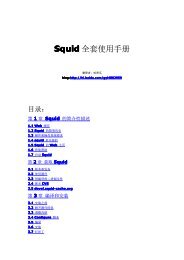
IncomesExpendituresDonkey owned 0.7 0.8 0.9 0.6 1.3 1.0 1.5 1.5Goat owned 0.0 0.0 0.3 0.7 0.0 0.0 1.7 4.1Sheep owned 0.2 0.4 1.6 2.3 3.4 4.0 2.5 4.7Edir * 105.6 144.6 99.0 92.9 36.0 28.5 66.0 31.7Ekub * 260.0 418.6 600.0 1111.0 1093.8 1063.1 0.0 0.0School expenses * 100.8 138.2 100.0 148.5 948.8 652.9 2130.0 2370.9* Numbers reflect currency in Ethiopian Birr (ETB). Exchange rates at the time of fieldworkaveraged 12.5 ETB per 1 USDBetter off households consume 130% of minimum household caloric requirements and grow90% of their calories (Table 4). While mean landholdings are only marginally larger thanmedium-ranked households, these households typically own higher quality land and can investcapital in wheat production, which yields higher profit margins than maize or potatoes. Betteroff household also typically have steel roofs that enhance storage capacity. Households canpurchase supplementary maize when prices are lowest and store it for consumption or resaleduring the lean seasons. Fuelwood sales among better off households contribute the least toincomes of any wealth group in absolute and relative terms (Figure 7). Expenditures oneducation are significant for better-off households, with most households sending students tohigh school and sometimes college.Figure 7: Household Incomes and Expenditures by Wealth GroupVery Poor Poor Medium Better offTotal Birr: 3591 Total Birr: 6110 Total Birr: 6558 Total Birr: 7416Total Birr: 3225 Total Birr: 4965 Total Birr: 8084 Total Birr: 842813
mem_map<strong>Kernel</strong> maintains a “page” struct for each 4KB(16KB on IA64and 64KB for PPC64/<strong>RHEL</strong>5) page of RAMmem_map is the global array of page structsPage struct size:●●●●<strong>RHEL</strong>3 32bit = 60bytes<strong>RHEL</strong>3 64bit = 112bytes<strong>RHEL</strong>4/<strong>RHEL</strong>5 32bit = 32bytes<strong>RHEL</strong>4/<strong>RHEL</strong>5 64bit = 56bytes16GB x86 running <strong>RHEL</strong>3: ~250MB mem_map array!!!<strong>RHEL</strong>4 & 5mem_map is only about 50% of the <strong>RHEL</strong>3mem_map.
Perzone page lists Active List most recently referenced●Anonymousstack, heap, bss●Pagecachefilesystem data/metadata Inactive List least recently referenced●Dirtymodified●Laundrywriteback in progress●Cleanready to free Free●Coalesced buddy allocator
Per zone Free list/buddy allocator lists<strong>Kernel</strong> maintains perzone free listBuddy allocator coalesces free pages into larger physically contiguous piecesDMA1*4kB 4*8kB 6*16kB 4*32kB 3*64kB 1*128kB 1*256kB 1*512kB 0*1024kB 1*2048kB 2*4096kB = 11588kB)Normal217*4kB 207*8kB 1*16kB 1*32kB 0*64kB 1*128kB 1*256kB 1*512kB 0*1024kB 0*2048kB 0*4096kB = 3468kB)HighMem847*4kB 409*8kB 17*16kB 1*32kB 1*64kB 1*128kB 1*256kB 1*512kB 0*1024kB 0*2048kB 0*4096kB = 7924kB)Memory allocation failures●●Freelist exhaustion.Freelist fragmentation.
Per NUMANode ResourcesMemory zones(DMA & Normal zones)CPUsIO/DMA capacityPage reclamation daemon(kswapd#)
NUMA Nodes and Zones64bitEnd of RAMNode 1Normal ZoneNormal ZoneNode 016MB(or 4GB)0DMA Zone
Virtual Address Space Maps 32bit●3G/1G address space●4G/4G address space(<strong>RHEL</strong>3/4) 64bit●X86_64●IA64
Linux 32bit Address Spaces(SMP)Virtual3G/1G <strong>Kernel</strong>(SMP)0GB 3GB 4GBRAMDMA NormalHighMem
Linux 32bit Address Space(Hugemem)Virtual4G/4G <strong>Kernel</strong>(Hugemem)User(s)<strong>Kernel</strong>RAM0 GB 3968MBDMA Normal 3968MB HighMem
Linux 64bit Address Spacex86_64VIRTUser<strong>Kernel</strong>0 128TB(2^47)RAMIA64VIRT0 1 2 3 4 5 6 7RAM
Memory Pressure32 bitDMA Normal Highmem<strong>Kernel</strong> AllocationsUser Allocations64 bitDMANormal<strong>Kernel</strong> and User Allocations
<strong>Kernel</strong> Memory PressureStatic – Boottime(DMA and Normal zones)●●<strong>Kernel</strong> text, data, BSSBootmem allocator, tables and hashes(mem_map)Dynamic●Slabcache(Normal zone)●<strong>Kernel</strong> data structs●Inode cache, dentry cache and buffer header dynamics●Pagetables(Highmem/Normal zone)●32bit versus 64bitHughTLBfs(Highmem/Normal zone)
User Memory PressureAnonymous/pagecache splitPagecache AllocationsPage Faultspagecacheanonymous
PageCache/Anonymous memory splitPagecache memory is global and grows when filesystem data is accesseduntil memory is exhausted.Pagecache is freed:●●●Underlying files are deleted.Unmount of the filesystem.Kswapd reclaims pagecache pages when memory is exhausted.Anonymous memory is private and grows on user demmand●●Allocation followed by pagefault.Swapin.Anonymous memory is freed:●●Process unmaps anonymous region or exits.Kswapd reclaims anonymous pages(swapout) when memory isexhausted
PageCache/Anonymous memory split(Cont)Balance between pagecache and anonymous memory.●●Dynamic.Controlled via:●/proc/sys/vm/pagecache.●/proc/sys/vm/swappiness on <strong>RHEL</strong>4/<strong>RHEL</strong>5.
32bit Memory Reclamation<strong>Kernel</strong> AllocationsUser AllocationsDMA Normal Highmem<strong>Kernel</strong> Reclamation(kswapd)slapcache reapinginode cache pruningbufferhead freeingdentry cache pruningUser Reclamation(kswapd,bdflush/pdflush)page agingpagecache shrinkingswapping
64bit Memory ReclamationRAM<strong>Kernel</strong> and User Allocations<strong>Kernel</strong> and User Reclamation
Anonymous/pagecache reclaimingPagecache AllocationsPage Faultspagecacheanonymouskswapd(bdflush/pdflush, kupdated) kswapdpage reclaim page reclaim (swapout)deletion of a fileunmapunmount filesystem exit
Per Node/Zone Paging DynamicsUser AllocationsReactivateACTIVEINACTIVE(Dirty > Clean)FREEPage agingswapoutbdflush(<strong>RHEL</strong>3)pdflush(<strong>RHEL</strong>4/5)ReclaimingUser deletions
Memory reclaim WatermarksFree ListAll of RAMDo nothingPages High – kswapd sleeps above Highkswapd reclaims memoryPages Low – kswapd wakesup at Lowkswapd reclaims memoryPages Min – all memory allocators reclaim at Minuser processes/kswapd reclaim memory0
Buffered file system writeMemorycopypagecache100% of pagecache RAM dirtybufferPagecachepage(dirty)pdflushd and write()'ngprocesses write dirty buffersUser<strong>Kernel</strong>40% dirty) – processes startsynchronous writespdflushd writes dirty buffers inbackground10% dirty – wakeup pdflushddo_nothing0% dirty
Buffered file system readMemory copyBuffer(dirty)PagecachepageUser<strong>Kernel</strong>
Section 2 Analyzing System <strong>Performance</strong> <strong>Performance</strong> Monitoring Tools●What to run under certain loads Analyzing System <strong>Performance</strong>●What to look for
<strong>Performance</strong> Monitoring ToolsStandard Unix OS tools●●Monitoring cpu, memory, process, diskoprofile<strong>Kernel</strong> Tools●●/proc, info (cpu, mem, slab), dmesg, AltSysrqProfiling nmi_watchdog=1, profile=2Tracing●●strace, ltracedprobe, kprobe3 rd party profiling/ capacity monitoring●●Perfmon, Caliper, vtuneSARcheck, KDE, BEA Patrol, HP Openview
<strong>Red</strong> <strong>Hat</strong> Top ToolsCPU ToolsMemory ToolsProcess Tools1 – top2 – vmstat3 – ps aux4 – mpstat P all5 – sar u1 – top2 – vmstat s3 – ps aur4 – ipcs5 – sar r B W1 – top2 – ps o pmem3 – gprof4 – strace,ltrace5 – sar6 – iostat6 – freeDisk Tools7 – oprofile8 – gnomesystemmonitor9 – KDEmonitor10 – /proc7 – oprofile8 – gnomesystemmonitor9 – KDEmonitor10 – /proc1 – iostat x2 – vmstat D3 – sar DEV #4 – nfsstat5 – NEED MORE!
top press h – help,1show cpus, mmemory, tthreads, > column sorttop 09:01:04 up 8 days, 15:22, 2 users, load average: 1.71, 0.39, 0.12Tasks: 114 total, 1 running, 113 sleeping, 0 stopped, 0 zombieCpu0 : 5.3% us, 2.3% sy, 0.0% ni, 0.0% id, 92.0% wa, 0.0% hi, 0.3% siCpu1 : 0.3% us, 0.3% sy, 0.0% ni, 89.7% id, 9.7% wa, 0.0% hi, 0.0% siMem: 2053860k total, 2036840k used, 17020k free, 99556k buffersSwap: 2031608k total, 160k used, 2031448k free, 417720k cachedPID USER PR NI VIRT RES SHR S %CPU %MEM TIME+ COMMAND27830 oracle 16 0 1315m 1.2g 1.2g D 1.3 60.9 0:00.09 oracle27802 oracle 16 0 1315m 1.2g 1.2g D 1.0 61.0 0:00.10 oracle27811 oracle 16 0 1315m 1.2g 1.2g D 1.0 60.8 0:00.08 oracle27827 oracle 16 0 1315m 1.2g 1.2g D 1.0 61.0 0:00.11 oracle27805 oracle 17 0 1315m 1.2g 1.2g D 0.7 61.0 0:00.10 oracle27828 oracle 15 0 27584 6648 4620 S 0.3 0.3 0:00.17 tpcc.exe1 root 16 0 4744 580 480 S 0.0 0.0 0:00.50 init2 root RT 0 0 0 0 S 0.0 0.0 0:00.11 migration/03 root 34 19 0 0 0 S 0.0 0.0 0:00.00 ksoftirqd/0
vmstat(paging vs swapping)vmstat 10procs memory swap io system cpur b swpd free buff cache si so bi bo in cs us sy wa id2 0 0 5483524 200524 234576 0 0 54 63 152 513 0 3 0 960 2 0 1697840 200524 3931440 0 0 578 50482 1085 3994 1 22 14 633 0 0 7844 200524 5784109 0 0 59330 58946 3243 14430 7 32 18 42mstat 10procs memory swap io system cpur b swpd free buff cache si so bi bo in cs us sy wa id2 0 0 5483524 200524 234576 0 0 54 63 152 513 0 3 0 960 2 0 1662340 200524 234576 0 0 578 50482 1085 3994 1 22 14 633 0 235678 7384 200524 234576 18754 23745 193 58946 3243 14430 7 32 18 42
Vmstat IOzone(8GB file with 6GB RAM)#! deplete memory until pdflush turns onprocs memory swap io system cpur b swpd free buff cache si so bi bo in cs us sy wa id2 0 0 4483524 200524 234576 0 0 54 63 152 513 0 3 0 960 2 0 1697840 200524 2931440 0 0 578 50482 1085 3994 1 22 14 633 0 0 1537884 200524 3841092 0 0 193 58946 3243 14430 7 32 18 420 2 0 528120 200524 6228172 0 0 478 88810 1771 3392 1 32 22 460 1 0 46140 200524 6713736 0 0 179 110719 1447 1825 1 30 35 352 2 0 50972 200524 6705744 0 0 232 119698 1316 1971 0 25 31 44....#! now transition from write to readsprocs memory swap io system cpur b swpd free buff cache si so bi bo in cs us sy wa id1 4 0 51040 200524 6705544 0 0 2 133519 1265 839 0 26 56 181 1 0 35064 200524 6712724 0 0 40 118911 1367 2021 0 35 42 230 1 0 68264 234372 6647020 0 0 76744 54 2048 4032 0 7 20 730 1 0 34468 234372 6678016 0 0 77391 34 1620 2834 0 9 18 720 1 0 47320 234372 6690356 0 0 81050 77 1783 2916 0 7 20 731 0 0 38756 234372 6698344 0 0 76136 44 2027 3705 1 9 19 720 1 0 31472 234372 6706532 0 0 76725 33 1601 2807 0 8 19 73
iostat x of same IOzone EXT3 file systemIostat metricsrates perf secr|w rqm/s – request merged/sr|w sec/s – 512 byte sectors/sr|w KB/s – Kilobyte/sr|w /s – operations/ssizes and response timeaverqsz – average request szavequsz – average queue szawait – average wait time mssvcm – ave service time msLinux 2.4.2127.0.2.ELsmp (node1) 05/09/2005avgcpu: %user %nice %sys %iowait %idle0.40 0.00 2.63 0.91 96.06Device: rrqm/s wrqm/s r/s w/s rsec/s wsec/s rkB/s wkB/s avgrqsz avgqusz await svctm %utilsdi 16164.60 0.00 523.40 0.00 133504.00 0.00 66752.00 0.00 255.07 1.00 1.91 1.88 98.40sdi 17110.10 0.00 553.90 0.00 141312.00 0.00 70656.00 0.00 255.12 0.99 1.80 1.78 98.40sdi 16153.50 0.00 522.50 0.00 133408.00 0.00 66704.00 0.00 255.33 0.98 1.88 1.86 97.00sdi 17561.90 0.00 568.10 0.00 145040.00 0.00 72520.00 0.00 255.31 1.01 1.78 1.76 100.00
SAR[root@localhost redhat]# sar u 3 3Linux 2.4.2120.EL (localhost.localdomain) 05/16/200510:32:28 PM CPU %user %nice %system %idle10:32:31 PM all 0.00 0.00 0.00 100.0010:32:34 PM all 1.33 0.00 0.33 98.3310:32:37 PM all 1.34 0.00 0.00 98.66Average: all 0.89 0.00 0.11 99.00[root] sar n DEVLinux 2.4.2120.EL (localhost.localdomain) 03/16/200501:10:01 PM IFACE rxpck/s txpck/s rxbyt/s txbyt/s rxcmp/s txcmp/s rxmcst/s01:20:00 PM lo 3.49 3.49 306.16 306.16 0.000.00 0.0001:20:00 PM eth0 3.89 3.53 2395.34 484.70 0.000.00 0.0001:20:00 PM eth1 0.00 0.00 0.00 0.00 0.000.00 0.00
free/numastat – memory allocation[root@localhost redhat]# free ltotal used free shared bufferscachedMem: 511368 342336 169032 0 29712167408Low: 511368 342336 169032 0 00High: 0 0 0 0 00/+ buffers/cache: 145216 366152Swap: 1043240 0 1043240numastat (on 2cpu x86_64 based system)node1node0numa_hit 9803332 10905630numa_miss 2049018 1609361numa_foreign 1609361 2049018interleave_hit 58689 54749local_node 9770927 10880901other_node 2081423 1634090
ps[root@localhost root]# ps aux[root@localhost root]# ps aux | moreUSER PID %CPU %MEM VSZ RSS TTY STAT START TIME COMMANDroot 1 0.1 0.1 1528 516 ? S 23:18 0:04 initroot 2 0.0 0.0 0 0 ? SW 23:18 0:00 [keventd]root 3 0.0 0.0 0 0 ? SW 23:18 0:00 [kapmd]root 4 0.0 0.0 0 0 ? SWN 23:18 0:00 [ksoftirqd/0]root 7 0.0 0.0 0 0 ? SW 23:18 0:00 [bdflush]root 5 0.0 0.0 0 0 ? SW 23:18 0:00 [kswapd]root 6 0.0 0.0 0 0 ? SW 23:18 0:00 [kscand]
pstreeinit ─┬─/usr/bin/sealer├─acpid├─atd├─auditd─┬─python│ └─{auditd}├─automount───6*[{automount}]├─avahidaemon───avahidaemon├─bonoboactivati ───{bonoboactivati}├─btapplet├─clockapplet├─crond├─cupsd───cupspolld├─3*[dbusdaemon ───{dbusdaemon}]├─2*[dbuslaunch]├─dhclient
mpstat[root@localhost redhat]# mpstat 3 3Linux 2.4.2120.EL (localhost.localdomain) 05/16/200510:40:34 PM CPU %user %nice %system %idle intr/s10:40:37 PM all 3.00 0.00 0.00 97.00 193.6710:40:40 PM all 1.33 0.00 0.00 98.67 208.0010:40:43 PM all 1.67 0.00 0.00 98.33 196.00Average: all 2.00 0.00 0.00 98.00 199.22
The /proc filesystem /proc●meminfo●slabinfo●cpuinfo●pid/maps●vmstat(<strong>RHEL</strong>4 & <strong>RHEL</strong>5)●zoneinfo(<strong>RHEL</strong>5)●sysrqtrigger
proc/meminfo(rhel3, 4, 5)<strong>RHEL</strong>3> cat /proc/meminfo<strong>RHEL</strong>4> cat /proc/meminfoMemTotal: 509876 kBMemTotal: 32749568 kBMemFree: 17988 kBMemFree: 31313344 kBMemShared: 0 kBBuffers: 29992 kBCached: 1250584 kBBuffers: 4728 kBSwapCached: 0 kBCached: 157444 kBActive: 235284 kBSwapCached: 46576 kBInactive: 1124168 kBActive: 222784 kBHighTotal: 0 kBActiveAnon: 118844 kBHighFree: 0 kBActiveCache: 103940 kBLowTotal: 32749568 kBInact_dirty: 41088 kBLowFree: 31313344 kBInact_laundry: 7640 kBSwapTotal: 4095992 kBInact_clean: 6904 kBSwapFree: 4095992 kBInact_target: 55680 kBDirty: 0 kBHighTotal: 0 kBWriteback: 0 kBHighFree: 0 kBMapped: 1124080 kBLowTotal: 509876 kBSlab: 38460 kBLowFree:SwapTotal:17988 kB1044184 kBCommitLimit: 20470776 kBCommitted_AS: 1158556 kBSwapFree: 945908 kBPageTables: 5096 kBCommitLimit: 1299120 kBVmallocTotal: 536870911 kBVmallocUsed: 2984 kBCommitted_AS: 404920 kBVmallocChunk: 536867627 kBHugePages_Total: 0HugePages_Total: 0HugePages_Free: 0HugePages_Free: 0Hugepagesize: 2048 kBHugepagesize: 2048 kB<strong>RHEL</strong>5> cat /proc/meminfoMemTotal: 1025220 kBMemFree: 11048 kBBuffers: 141944 kBCached: 342664 kBSwapCached: 4 kBActive: 715304 kBInactive: 164780 kBHighTotal: 0 kBHighFree: 0 kBLowTotal: 1025220 kBLowFree: 11048 kBSwapTotal: 2031608 kBSwapFree: 2031472 kBDirty: 84 kBWriteback: 0 kBAnonPages: 395572 kBMapped: 82860 kBSlab: 92296 kBPageTables: 23884 kBNFS_Unstable: 0 kBBounce: 0 kBCommitLimit: 2544216 kBCommitted_AS: 804656 kBVmallocTotal: 34359738367 kBVmallocUsed: 263472 kBVmallocChunk: 34359474711 kBHugePages_Total: 0HugePages_Free: 0HugePages_Rsvd: 0Hugepagesize: 2048 kB
proc/slabinfoslabinfo version: 2.1# name : tunables : slabdata nfsd4_delegations 0 0 656 6 1 : tunables 54 27 8 : slabdata 0 0 0nfsd4_stateids 0 0 128 30 1 : tunables 120 60 8 : slabdata 0 0 0nfsd4_files 0 0 72 53 1 : tunables 120 60 8 : slabdata 0 0 0nfsd4_stateowners 0 0 424 9 1 : tunables 54 27 8 : slabdata 0 0 0nfs_direct_cache 0 0 128 30 1 : tunables 120 60 8 : slabdata 0 0 0nfs_write_data 36 36 832 9 2 : tunables 54 27 8 : slabdata 4 4 0nfs_read_data 32 35 768 5 1 : tunables 54 27 8 : slabdata 7 7 0nfs_inode_cache 1383 1389 1040 3 1 : tunables 24 12 8 : slabdata 463 463 0nfs_page 0 0 128 30 1 : tunables 120 60 8 : slabdata 0 0 0fscache_cookie_jar 3 53 72 53 1 : tunables 120 60 8 : slabdata 1 1 0ip_conntrack_expect 0 0 136 28 1 : tunables 120 60 8 : slabdata 0 0 0ip_conntrack 75 130 304 13 1 : tunables 54 27 8 : slabdata 10 10 0bridge_fdb_cache 0 0 64 59 1 : tunables 120 60 8 : slabdata 0 0 0rpc_buffers 8 8 2048 2 1 : tunables 24 12 8 : slabdata 4 4 0rpc_tasks 30 30 384 10 1 : tunables 54 27 8 : slabdata 3 3 0
proc/cpuinfo[lwoodman]$ cat /proc/cpuinfoprocessor : 0vendor_id : GenuineIntelcpu family : 6model : 15model name : Intel(R) Xeon(R) CPU 3060 @ 2.40GHzstepping : 6cpu MHz : 2394.070cache size : 4096 KBphysical id : 0siblings : 2core id : 0cpu cores : 2fpu: yesfpu_exception : yescpuid level : 10wp: yesflags: fpu vme de pse tsc msr pae mce cx8 apic sep mtrr pge mca cmov pat pse36 clflush dtsacpi mmx fxsr sse sse2 ss ht tm syscall nx lm constant_tsc pni monitor ds_cpl vmx est tm2 cx16 xtprlahf_lmbogomips : 4791.41clflush size : 64cache_alignment : 64address sizes : 36 bits physical, 48 bits virtualpower management:
32bit /proc//maps[root@dhcp8336 proc]# cat 5808/maps0022e0000023b000 rxp 00000000 03:03 4137068 /lib/tls/libpthread0.60.so0023b0000023c000 rwp 0000c000 03:03 4137068 /lib/tls/libpthread0.60.so0023c0000023e000 rwp 00000000 00:00 00037f00000391000 rxp 00000000 03:03 523285 /lib/libnsl2.3.2.so0039100000392000 rwp 00011000 03:03 523285 /lib/libnsl2.3.2.so0039200000394000 rwp 00000000 00:00 000c4500000c5a000 rxp 00000000 03:03 523268 /lib/ld2.3.2.so00c5a00000c5b000 rwp 00015000 03:03 523268 /lib/ld2.3.2.so00e5c00000f8e000 rxp 00000000 03:03 4137064 /lib/tls/libc2.3.2.so00f8e00000f91000 rwp 00131000 03:03 4137064 /lib/tls/libc2.3.2.so00f9100000f94000 rwp 00000000 00:00 0080480000804f000 rxp 00000000 03:03 1046791 /sbin/ypbind0804f00008050000 rwp 00007000 03:03 1046791 /sbin/ypbind09794000097b5000 rwp 00000000 00:00 0b5fdd000b5fde000 p 00000000 00:00 0b5fde000b69de000 rwp 00001000 00:00 0b69de000b69df000 p 00000000 00:00 0b69df000b73df000 rwp 00001000 00:00 0b73df000b75df000 rp 00000000 03:03 3270410 /usr/lib/locale/localearchiveb75df000b75e1000 rwp 00000000 00:00 0bfff6000c0000000 rwp ffff8000 00:00 0
64bit /proc//maps# cat /proc/2345/maps004000000100b000 rxp 00000000 fd:00 1933328 /usr/sybase/ASE12_5/bin/dataserver.esd30110b00001433000 rwp 00c0b000 fd:00 1933328 /usr/sybase/ASE12_5/bin/dataserver.esd301433000014eb000 rwxp 01433000 00:00 04000000040001000 p 40000000 00:00 04000100040a01000 rwxp 40001000 00:00 02a95f730002a96073000 p 0012b000 fd:00 819273/lib64/tls/libc2.3.4.so2a960730002a96075000 rp 0012b000 fd:00 819273/lib64/tls/libc2.3.4.so2a960750002a96078000 rwp 0012d000 fd:00 819273/lib64/tls/libc2.3.4.so2a960780002a9607e000 rwp 2a96078000 00:00 02a9607e0002a98c3e000 rws 00000000 00:06 360450/SYSV0100401e (deleted)2a98c3e0002a98c47000 rwp 2a98c3e000 00:00 02a98c470002a98c51000 rxp 00000000 fd:00 819227/lib64/libnss_files2.3.4.so2a98c510002a98d51000 p 0000a000 fd:00 819227/lib64/libnss_files2.3.4.so2a98d510002a98d53000 rwp 0000a000 fd:00 819227/lib64/libnss_files2.3.4.so2a98d530002a98d57000 rxp 00000000 fd:00 819225/lib64/libnss_dns2.3.4.so2a98d570002a98e56000 p 00004000 fd:00 819225/lib64/libnss_dns2.3.4.so2a98e560002a98e58000 rwp 00003000 fd:00 819225/lib64/libnss_dns2.3.4.so2a98e580002a98e69000 rxp 00000000 fd:00 819237/lib64/libresolv2.3.4.so2a98e690002a98f69000 p 00011000 fd:00 819237/lib64/libresolv2.3.4.so2a98f690002a98f6b000 rwp 00011000 fd:00 819237/lib64/libresolv2.3.4.so2a98f6b0002a98f6d000 rwp 2a98f6b000 00:00 035c7e0000035c7e08000 rxp 00000000 fd:00 819469/lib64/libpam.so.0.7735c7e0800035c7f08000 p 00008000 fd:00 819469/lib64/libpam.so.0.7735c7f0800035c7f09000 rwp 00008000 fd:00 819469/lib64/libpam.so.0.7735c800000035c8011000 rxp 00000000 fd:00 819468/lib64/libaudit.so.0.0.035c801100035c8110000 p 00011000 fd:00 819468/lib64/libaudit.so.0.0.035c811000035c8118000 rwp 00010000 fd:00 819468/lib64/libaudit.so.0.0.035c900000035c900b000 rxp 00000000 fd:00 819457/lib64/libgcc_s3.4.420050721.so.135c900b00035c910a000 p 0000b000 fd:00 819457/lib64/libgcc_s3.4.420050721.so.135c910a00035c910b000 rwp 0000a000 fd:00 819457/lib64/libgcc_s3.4.420050721.so.17fbfff10007fc0000000 rwxp 7fbfff1000 00:00 0ffffffffff600000ffffffffffe00000 p 00000000 00:00 0
proc/vmstat(<strong>RHEL</strong>4/<strong>RHEL</strong>5)cat /proc/vmstatnr_anon_pages 98893nr_mapped 20715nr_file_pages 120855nr_slab 23060nr_page_table_pages 5971nr_dirty 21nr_writeback 0nr_unstable 0nr_bounce 0numa_hit 996729666numa_miss 0numa_foreign 0numa_interleave 87657numa_local 996729666numa_other 0pgpgin 2577307pgpgout 106131928pswpin 0pswpout 34pgalloc_dma 198908pgalloc_dma32 997707549pgalloc_normal 0pgalloc_high 0pgfree 997909734pgactivate 1313196pgdeactivate 470908pgfault 2971972147pgmajfault 8047.CONTINUED...pgrefill_dma 18338pgrefill_dma32 1353451pgrefill_normal 0pgrefill_high 0pgsteal_dma 0pgsteal_dma32 0pgsteal_normal 0pgsteal_high 0pgscan_kswapd_dma 7235pgscan_kswapd_dma32 417984pgscan_kswapd_normal 0pgscan_kswapd_high 0pgscan_direct_dma 12pgscan_direct_dma32 1984pgscan_direct_normal 0pgscan_direct_high 0pginodesteal 166slabs_scanned 1072512kswapd_steal 410973kswapd_inodesteal 61305pageoutrun 7752allocstall 29pgrotated 73
Alt Sysrq M – <strong>RHEL</strong>3SysRq : Show MemoryMeminfo:Zone:DMA freepages: 2929 min: 0 low: 0 high: 0Zone:Normal freepages: 1941 min: 510 low: 2235 high: 3225Zone:HighMem freepages: 0 min: 0 low: 0 high: 0Free pages: 4870 ( 0 HighMem)( Active: 72404/13523, inactive_laundry: 2429, inactive_clean: 1730, free: 4870 )aa:0 ac:0 id:0 il:0 ic:0 fr:2929aa:46140 ac:26264 id:13523 il:2429 ic:1730 fr:1941aa:0 ac:0 id:0 il:0 ic:0 fr:01*4kB 4*8kB 2*16kB 2*32kB 1*64kB 2*128kB 2*256kB 1*512kB 0*1024kB 1*2048kB 2*4096kB = 11716kB)1255*4kB 89*8kB 5*16kB 1*32kB 0*64kB 1*128kB 1*256kB 1*512kB 1*1024kB 0*2048kB 0*4096kB = 7764kB)Swap cache: add 958119, delete 918749, find 4611302/5276354, race 0+127234 pages of slabcache244 pages of kernel stacks1303 lowmem pagetables, 0 highmem pagetables0 bounce buffer pages, 0 are on the emergency listFree swap: 598960kB130933 pages of RAM0 pages of HIGHMEM3497 reserved pages34028 pages shared39370 pages swap cached
Alt Sysrq M – <strong>RHEL</strong>3/NUMASysRq : Show MemoryMeminfo:Zone:DMA freepages: 0 min: 0 low: 0 high: 0Zone:Normal freepages:369423 min: 1022 low: 6909 high: 9980Zone:HighMem freepages: 0 min: 0 low: 0 high: 0Zone:DMA freepages: 2557 min: 0 low: 0 high: 0Zone:Normal freepages:494164 min: 1278 low: 9149 high: 13212Zone:HighMem freepages: 0 min: 0 low: 0 high: 0Free pages: 866144 ( 0 HighMem)( Active: 9690/714, inactive_laundry: 764, inactive_clean: 35, free: 866144 )aa:0 ac:0 id:0 il:0 ic:0 fr:0aa:746 ac:2811 id:188 il:220 ic:0 fr:369423aa:0 ac:0 id:0 il:0 ic:0 fr:0aa:0 ac:0 id:0 il:0 ic:0 fr:2557aa:1719 ac:4414 id:526 il:544 ic:35 fr:494164aa:0 ac:0 id:0 il:0 ic:0 fr:02497*4kB 1575*8kB 902*16kB 515*32kB 305*64kB 166*128kB 96*256kB 56*512kB 39* 1024kB 30*2048kB 300*4096kB = 1477692kB)Swap cache: add 288168, delete 285993, find 726/2075, race 0+04059 pages of slabcache146 pages of kernel stacks388 lowmem pagetables, 638 highmem pagetablesFree swap: 1947848kB917496 pages of RAM869386 free pages30921 reserved pages21927 pages shared2175 pages swap cachedBuffer memory: 9752kBCache memory: 34192kBCLEAN: 696 buffers, 2772 kbyte, 51 used (last=696), 0 locked, 0 dirty 0 de layDIRTY: 4 buffers, 16 kbyte, 4 used (last=4), 0 locked, 3 dirty 0 delay
Alt Sysrq M – <strong>RHEL</strong>4 & 5SysRq : Show MemoryMeminfo:Free pages:20128kB (0kB HighMem)Active:72109 inactive:27657 dirty:1 writeback:0 unstable:0 free:5032 slab:19306 mapped:41755 pagetables:945DMA free:12640kB min:20kB low:40kB high:60kB active:0kB inactive:0kB present:16384kB pages_scanned:847all_unreclaimable? yesprotections[]: 0 0 0Normal free:7488kB min:688kB low:1376kB high:2064kB active:288436kB inactive:110628kB present:507348kBpages_scanned:0 all_unreclaimable? noprotections[]: 0 0 0HighMem free:0kB min:128kB low:256kB high:384kB active:0kB inactive:0kB present:0kB pages_scanned:0all_unreclaimable? noprotections[]: 0 0 0DMA: 4*4kB 4*8kB 3*16kB 4*32kB 4*64kB 1*128kB 1*256kB 1*512kB 1*1024kB 1*2048kB 2*4096kB = 12640kBNormal: 1052*4kB 240*8kB 39*16kB 3*32kB 0*64kB 1*128kB 0*256kB 1*512kB 0*1024kB 0*2048kB 0*4096kB = 7488kBHighMem: emptySwap cache: add 52, delete 52, find 3/5, race 0+0Free swap:1044056kB130933 pages of RAM0 pages of HIGHMEM2499 reserved pages71122 pages shared0 pages swap cached
Alt Sysrq M – <strong>RHEL</strong>4 & 5/NUMAFree pages: 16724kB (0kB HighMem)Active:236461 inactive:254776 dirty:11 writeback:0 unstable:0 free:4181 slab:13679 mapped:34073pagetables:853Node 1 DMA free:0kB min:0kB low:0kB high:0kB active:0kB inactive:0kB present:0kB pages_scanned:0all_unreclaimable? noprotections[]: 0 0 0Node 1 Normal free:2784kB min:1016kB low:2032kB high:3048kB active:477596kB inactive:508444kBpresent:1048548kB pages_scanned:0 all_unreclaimable? noprotections[]: 0 0 0Node 1 HighMem free:0kB min:128kB low:256kB high:384kB active:0kB inactive:0kB present:0kB pages_scanned:0all_unreclaimable? noprotections[]: 0 0 0Node 0 DMA free:11956kB min:12kB low:24kB high:36kB active:0kB inactive:0kB present:16384kBpages_scanned:1050 all_unreclaimable? yesprotections[]: 0 0 0Node 0 Normal free:1984kB min:1000kB low:2000kB high:3000kB active:468248kB inactive:510660kBpresent:1032188kB pages_scanned:0 all_unreclaimable? noprotections[]: 0 0 0Node 0 HighMem free:0kB min:128kB low:256kB high:384kB active:0kB inactive:0kB present:0kB pages_scanned:0all_unreclaimable? noprotections[]: 0 0 0Node 1 DMA: emptyNode 1 Normal: 0*4kB 0*8kB 30*16kB 10*32kB 1*64kB 1*128kB 1*256kB 1*512kB 1*1024kB 0*2048kB 0*4096kB = 2784kBNode 1 HighMem: emptyNode 0 DMA: 5*4kB 4*8kB 4*16kB 2*32kB 2*64kB 3*128kB 2*256kB 1*512kB 0*1024kB 1*2048kB 2*4096kB = 11956kBNode 0 Normal: 0*4kB 0*8kB 0*16kB 0*32kB 1*64kB 1*128kB 1*256kB 1*512kB 1*1024kB 0*2048kB 0*4096kB = 1984kBNode 0 HighMem: emptySwap cache: add 44, delete 44, find 0/0, race 0+0Free swap: 2031432kB524280 pages of RAM10951 reserved pages363446 pages shared0 pages swap cached
Alt Sysrq Tbash R current 0 1609 1606(NOTLB)Call Trace:[] snprintf [kernel] 0x27 (0xdb3c5e90)[] call_console_drivers [kernel] 0x63 (0xdb3c5eb4)[] printk [kernel] 0x153 (0xdb3c5eec)[] printk [kernel] 0x153 (0xdb3c5f00)[] show_trace [kernel] 0xd9 (0xdb3c5f0c)[] show_trace [kernel] 0xd9 (0xdb3c5f14)[] show_state [kernel] 0x62 (0xdb3c5f24)[] __handle_sysrq_nolock [kernel] 0x7a (0xdb3c5f38)[] handle_sysrq [kernel] 0x5d (0xdb3c5f58)[] write_sysrq_trigger [kernel] 0x53 (0xdb3c5f7c)[] sys_write [kernel] 0x97 (0xdb3c5f94)* logged in /var/log/messages
Alt Sysrq W and PSysRq : Show CPUsCPU0:ffffffff8047ef48 0000000000000000 ffffffff80437f10 ffffffff8019378b0000000000000000 0000000000000000 0000000000000000 ffffffff801937baffffffff8019378b ffffffff80022b27 ffffffff800551bf 0000000000090000Call Trace:[] show_trace+0x34/0x47[] _show_stack+0xd9/0xe8[] showacpu+0x2f/0x3b[] smp_call_function_interrupt+0x57/0x75[] call_function_interrupt+0x66/0x6c[] unix_poll+0x0/0x96[] mwait_idle+0x36/0x4a[] cpu_idle+0x95/0xb8[] start_kernel+0x225/0x22a[] _sinittext+0x25b/0x262
oprofile – builtin to <strong>RHEL</strong>4 & 5 (smp)opcontrol – on/off dataopreport – analyze profile●start start collection●r reverse order sort●stop stop collection●t [percentage] theshold●dump output to diskto view●event=:name:count●f /path/filenameExample:# opcontrol –start# /bin/time test1 &# sleep 60# opcontrol –stop●d detailsopannotate●●s /path/sourcea /path/assembly# opcontrol dump
oprofile – opcontrol and opreport cpu_cycles# CPU: Core 2, speed 2666.72 MHz (estimated)Counted CPU_CLK_UNHALTED events (Clock cycles when not halted) with a unit mask of 0x00 (Unhalted core cycles) count 100000CPU_CLK_UNHALT...|samples| %|397435971 84.6702 vmlinux19703064 4.1976 zeus.web16914317 3.6034 e100012208514 2.6009 ld2.5.so11711746 2.4951 libc2.5.so5164664 1.1003 sim.cgi2333427 0.4971 oprofiled1295161 0.2759 oprofile1099731 0.2343 zeus.cgi968623 0.2064 ext3270163 0.0576 jbd
Profiling Tools: SystemTapparseprobe script<strong>Red</strong> <strong>Hat</strong>, Intel, IBM & Hitachi collaborationLinux answer to Solaris DtraceelaborateDynamic instrumentationprobeset libraryTool to take a deep look into a running system:translate to C, compile *●Assists in identifying causes of performance●problemsSimplifies building instrumentationload module, start probeprobe kernelobjectCurrent snapshots available from:http://sources.redhat.com/systemtap●Source for presentations/papers<strong>Kernel</strong> space tracing today, user space tracingunder developmentextract output, unload* Solaris Dtrace is interpretiveprobe output Technology preview status until 5.1
Profiling Tools: SystemTapTechnology: Kprobes:●●●In current 2.6 kernels●Upstream 2.6.12, backported to <strong>RHEL</strong>4 kernel<strong>Kernel</strong> instrumentation without recompile/rebootUses software int and trap handler for instrumentationDebug information:●●●Provides map between executable and source codeGenerated as part of RPM buildsAvailable at: ftp://ftp.redhat.comSafety: Instrumentation scripting language:●●●No dynamic memory allocation or assembly/C codeTypes and type conversions limitedRestrict access through pointersScript compiler checks:●Infinite loops and recursion – Invalid variable access
New Tuning Tools w/ RH MRGMRG Tuning – using the TUNA – dynamically controlDevice IRQ propertiesCPU affinity / parent and threadsScheduling policy
New Tuning Tools w/ RH MRGMRG Tuning – using the TUNA – dynamically controlProcess affinity / parent and threadsScheduling policy
Section 3: TuningHow to tune LinuxCapacity tuning●Fix problems by adding resources<strong>Performance</strong> TuningMethodology1) Document config2) Baseline results3) While results nonoptimala) Monitor/Instrument system/workloadb) Apply tuning 1 change at a timec) Analyze results, exit or loop4) Document final config
Tuning how to set kernel parameters/proc[root@foobar fs]# cat /proc/sys/kernel/sysrq (see “0”)[root@foobar fs]# echo 1 > /proc/sys/kernel/sysrq[root@foobar fs]# cat /proc/sys/kernel/sysrq (see “1”)Sysctl command[root@foobar fs]# sysctl kernel.sysrqkernel.sysrq = 0[root@foobar fs]# sysctl w kernel.sysrq=1kernel.sysrq = 1[root@foobar fs]# sysctl kernel.sysrqkernel.sysrq = 1Edit the /etc/sysctl.conf file# <strong>Kernel</strong> sysctl configuration file for <strong>Red</strong> <strong>Hat</strong> Linux# Controls the System Request debugging functionality of the kernelkernel.sysrq = 1
Capacity TuningMemory●●●●/proc/sys/vm/overcommit_memory/proc/sys/vm/overcommit_ratio/proc/sys/vm/max_map_count/proc/sys/vm/nr_hugepages<strong>Kernel</strong>●●●●●●●/proc/sys/kernel/msgmax/proc/sys/kernel/msgmnb/proc/sys/kernel/msgmni/proc/sys/kernel/shmall/proc/sys/kernel/shmmax/proc/sys/kernel/shmmni/proc/sys/kernel/threadsmaxFilesystems●●/proc/sys/fs/aio_max_nr/proc/sys/fs/file_maxOOM kills
OOM kills – swap space exhaustion(<strong>RHEL</strong>3)Meminfo:Zone:DMA freepages: 975 min: 1039 low: 1071 high: 1103Zone:Normal freepages: 126 min: 255 low: 1950 high: 2925Zone:HighMem freepages: 0 min: 0 low: 0 high: 0Free pages: 1101 ( 0 HighMem)( Active: 118821/401, inactive_laundry: 0, inactive_clean: 0, free: 1101 )aa:1938 ac:18 id:44 il:0 ic:0 fr:974aa:115717 ac:1148 id:357 il:0 ic:0 fr:126aa:0 ac:0 id:0 il:0 ic:0 fr:06*4kB 0*8kB 0*16kB 1*32kB 0*64kB 0*128kB 1*256kB 1*512kB 1*1024kB 1*2048kB 0*4096kB = 3896kB)0*4kB 1*8kB 1*16kB 1*32kB 1*64kB 1*128kB 1*256kB 0*512kB 0*1024kB 0*2048kB 0*4096kB = 504kB)Swap cache: add 620870, delete 620870, find 762437/910181, race 0+2002454 pages of slabcache484 pages of kernel stacks2008 lowmem pagetables, 0 highmem pagetablesFree swap:129008 pages of RAM0 pages of HIGHMEM3045 reserved pages4009 pages shared0 pages swap cached0kB
OOM kills – lowmem consumption(<strong>RHEL</strong>3/x86)Meminfo:zone:DMA freepages: 2029 min: 0 low: 0 high: 0Zone:Normal freepages: 1249 min: 1279 low: 4544 high: 6304Zone:HighMem freepages: 746 min: 255 low: 29184 high: 43776Free pages: 4024 ( 746 HighMem)( Active: 703448/665000, inactive_laundry: 99878, inactive_clean: 99730, free: 4024 )aa:0 ac:0 id:0 il:0 ic:0 fr:2029aa:128 ac:3346 id:113 il:240 ic:0 fr:1249aa:545577 ac:154397 id:664813 il:99713 ic:99730 fr:7461*4kB 0*8kB 1*16kB 1*32kB 0*64kB 1*128kB 1*256kB 1*512kB 1*1024kB 1*2048kB 1*4096kB = 8116 kB)543*4kB 35*8kB 77*16kB 1*32kB 0*64kB 0*128kB 1*256kB 0*512kB 1*1024kB 0*2048kB 0*4096kB = 4996kB)490*4kB 2*8kB 1*16kB 1*32kB 1*64kB 1*128kB 1*256kB 1*512kB 0*1024kB 0*2048kB 0*4096kB = 29 84kB)Swap cache: add 4327, delete 4173, find 190/1057, race 0+0178558 pages of slabcache1078 pages of kernel stacks0 lowmem pagetables, 233961 highmem pagetablesFree swap:8189016kB2097152 pages of RAM1801952 pages of HIGHMEM103982 reserved pages115582774 pages shared154 pages swap cachedOut of Memory: Killed process 27100 (oracle).
OOM kills – lowmem consumption(<strong>RHEL</strong>4&5/x86)Free pages: 9003696kB (8990400kB HighMem)Active:323264 inactive:346882 dirty:327575 writeback:3686 unstable:0 free:2250924 slab:177094mapped:15855 pagetables:987DMA free:12640kB min:16kB low:32kB high:48kB active:0kB inactive:0kB present:16384kBpages_scanned:149 all_unreclaimable? yesprotections[]: 0 0 0Normal free:656kB min:928kB low:1856kB high:2784kB active:6976kB inactive:9976kB present:901120kBpages_scanned:28281 all_unreclaimable? yesprotections[]: 0 0 0HighMem free:8990400kB min:512kB low:1024kB high:1536kB active:1286080kB inactive:1377552kBpresent:12451840kB pages_scanned:0 all_unreclaimable? noprotections[]: 0 0 0DMA: 4*4kB 4*8kB 3*16kB 4*32kB 4*64kB 1*128kB 1*256kB 1*512kB 1*1024kB 1*2048kB 2*4096kB = 12640kBNormal: 0*4kB 2*8kB 0*16kB 0*32kB 0*64kB 1*128kB 0*256kB 1*512kB 0*1024kB 0*2048kB 0*4096kB = 656kBHighMem: 15994*4kB 17663*8kB 11584*16kB 8561*32kB 8193*64kB 1543*128kB 69*256kB 2101*512kB1328*1024kB 765*2048kB 875*4096kB = 8990400kBSwap cache: add 0, delete 0, find 0/0, race 0+0Free swap: 8385912kB3342336 pages of RAM2916288 pages of HIGHMEM224303 reserved pages666061 pages shared0 pages swap cachedOut of Memory: Killed process 22248 (httpd).oomkiller: gfp_mask=0xd0
OOM kills – IO system stall(<strong>RHEL</strong>4&5/x86)Free pages: 15096kB (1664kB HighMem) Active:34146 inactive:1995536 dirty:255writeback:314829 unstable:0 free:3774 slab:39266 mapped:31803 pagetables:820DMA free:12552kB min:16kB low:32kB high:48kB active:0kB inactive:0kB present:16384kBpages_scanned:2023 all_unreclaimable? yesprotections[]: 0 0 0Normal free:880kB min:928kB low:1856kB high:2784kB active:744kB inactive:660296kBpresent:901120kB pages_scanned:726099 all_unreclaimable? yesprotections[]: 0 0 0HighMem free:1664kB min:512kB low:1024kB high:1536kB active:135840kB inactive:7321848kBpresent:7995388kB pages_scanned:0 all_unreclaimable? noprotections[]: 0 0 0DMA: 2*4kB 4*8kB 2*16kB 4*32kB 3*64kB 1*128kB 1*256kB 1*512kB 1*1024kB 1*2048kB 2*4096kB =12552kBNormal: 0*4kB 18*8kB 14*16kB 0*32kB 0*64kB 0*128kB 0*256kB 1*512kB 0*1024kB 0*2048kB 0*4096kB= 880kBHighMem: 6*4kB 9*8kB 66*16kB 0*32kB 0*64kB 0*128kB 0*256kB 1*512kB 0*1024kB 0*2048kB 0*4096kB= 1664kBSwap cache: add 856, delete 599, find 341/403, race 0+00 bounce buffer pagesFree swap: 4193264kB2228223 pages of RAM1867481 pages of HIGHMEM150341 reserved pages343042 pages shared257 pages swap cachedkernel: Out of Memory: Killed process 3450 (hpsmhd).
Eliminating OOMkills<strong>RHEL</strong>3●/proc/sys/vm/oomkill – number of processes that can be in anOOM kill state at any one time(default 1).<strong>RHEL</strong>4●/proc/sys/vm/oomkill – oom kill enable/disable flag(default 1).<strong>RHEL</strong>5●/proc//oom_adj – perprocess OOM adjustment(17 to +15)●●●Set to 17 to disable that process from being OOM killedDecrease to decrease OOM kill likelyhood.Increase to increase OOM kill likelyhood.●/proc//oom_score – current OOM kill priority.
General <strong>Performance</strong> Tuning Considerations Over Committing RAM Swap device location Storage device and limits limits <strong>Kernel</strong> selection
<strong>Performance</strong> Tuning – (<strong>RHEL</strong>3) /proc/sys/vm/bdflush /proc/sys/vm/pagecache /proc/sys/vm/numa_memory_allocator
<strong>RHEL</strong>3 /proc/sys/vm/bdflushint nfract; /* Percentage of buffer cache dirty to activate bdflush */int ndirty; /* Maximum number of dirty blocks to write out per wakecycle */int dummy2; /* old "nrefill" */int dummy3; /* unused */int interval; /* jiffies delay between kupdate flushes */int age_buffer; /* Time for normal buffer to age before we flush it */int nfract_sync;/* Percentage of buffer cache dirty to activate bdflush synchronouslyint nfract_stop_bdflush; /* Percetange of buffer cache dirty to stop bdflush */int dummy5; /* unused */Example:Settings for Server with ample IO config (default r3 geared for ws)sysctl w vm.bdflush=”50 5000 0 0 200 5000 3000 60 20 0”
<strong>RHEL</strong>3 /proc/sys/vm/pagecachepagecache.minpercent●●Lower limit for pagecache page reclaiming.Kswapd will stop reclaiming pagecache pages below this percent ofRAM.pagecache.borrowpercnet●Kswapd attempts to keep the pagecache at this percent or RAMpagecache.maxpercent●●●●Upper limit for pagecache page reclaiming.<strong>RHEL</strong>2.1 – hardlimit, pagecache will not grow above this percent of RAM.<strong>RHEL</strong>3 – kswapd only reclaims pagecache pages above this percent ofRAM.Increasing maxpercent will increase swappingExample: echo “1 10 50” > /proc/sys/vm/pagecache
<strong>RHEL</strong>3 /proc/sys/vm/numa_memory_allocator>numa=on(default)Zone:Normal freepages: 10539 min: 1279 low: 17406 high: 25597Zone:Normal freepages: 10178 min: 1279 low: 17406 high: 25597Zone:Normal freepages: 10445 min: 1279 low: 17406 high: 25597Zone:Normal freepages:856165 min: 1279 low: 17342 high: 25501Swap cache: add 2633120, delete 2553093, find 1375365/1891330, race 0+0>numa=offZone:Normal freepages:861136 min: 1279 low: 30950 high: 63065Swap cache: add 0, delete 0 find 0/0, race 0+0>numa=on and /proc/sys/vm/numa_memory_allocator set to 1Zone:Normal freepages: 17406 min: 1279 low: 17406 high: 25597Zone:Normal freepages: 17406 min: 1279 low: 17406 high: 25597Zone:Normal freepages: 17406 min: 1279 low: 17406 high: 25597Zone:Normal freepages:85739 min: 1279 low: 17342 high: 25501Swap cache: add 0, delete 0 find 0/0, race 0+0
<strong>Performance</strong> Tuning – (<strong>RHEL</strong>4 and <strong>RHEL</strong>5) /proc/sys/vm/swappiness /proc/sys/vm/min_free_kbytes /proc/sys/vm/dirty_ratio /proc/sys/vm/dirty_background_ratio /proc/sys/vm/pagecache
<strong>RHEL</strong>4 /proc/sys/vm/swappinessControls how aggressively the system reclaims “mapped” memory:●●●Anonymous memory swappingMapped file pages – writing if dirty and freeingSystem V shared memory swappingDecreasing: more aggressive reclaiming of unmapped pagecache memoryIncreasing: more aggressive swapping of mapped memorySybase server with /proc/sys/vm/swappiness set to 60(default)procs memory swap io system cpurb swpd free buff cache si so bi bo in cs us sy id wa5 1 643644 26788 3544 32341788 880 120 4044 7496 1302 20846 25 34 25 16Sybase server with /proc/sys/vm/swappiness set to 10procs memory swap io system cpurb swpd free buff cache si so bi bo in cs us sy id wa8 3 0 24228 6724 32280696 0 0 23888 63776 1286 20020 24 38 13 26
<strong>RHEL</strong>4&5 /proc/sys/vm/min_free_kbytesDirectly controls the page reclaim watermarks in KB# echo 1024 > /proc/sys/vm/min_free_kbytesNode 0 DMA free:4420kB min:8kB low:8kB high:12kBNode 0 DMA32 free:14456kB min:1012kB low:1264kB high:1516kBecho 2048 > /proc/sys/vm/min_free_kbytesNode 0 DMA free:4420kB min:20kB low:24kB high:28kBNode 0 DMA32 free:14456kB min:2024kB low:2528kB high:3036kB
Memory reclaim Watermarks min_free_kbytesFree ListAll of RAMDo nothingPages High – kswapd sleeps above Highkswapd reclaims memoryPages Low – kswapd wakesup at Lowkswapd reclaims memoryPages Min – all memory allocators reclaim at Minuser processes/kswapd reclaim memory0
<strong>RHEL</strong>4&5 /proc/sys/vm/dirty_ratioAbsolute limit to percentage of dirty pagecache memory●Default is 40%●●Lower means less dirty pagecache and smaller IO streamsHigher means more dirty pagecache and larger IO streams
<strong>RHEL</strong>4&5 /proc/sys/vm/dirty_background_ratioControls when dirty pagecache memory starts getting written.●Default is 10%●●Lower●●Higher●●pdflush starts earlierless dirty pagecache and smaller IO streamspdflush starts latermore dirty pagecache and larger IO streams
dirty_ratio and dirty_background_ratiopagecache100% of pagecache RAM dirtypdflushd and write()'ng processes write dirty buffersdirty_ratio(40% of RAM dirty) – processes start synchronous writespdflushd writes dirty buffers in backgrounddirty_background_ratio(10% of RAM dirty) – wakeup pdflushddo_nothing0% of pagecache RAM dirty
<strong>RHEL</strong>4&5 /proc/sys/vm/pagecacheControls when pagecache memory is deactivated. Default is 100%Lower●Prevents swapping out anonymous memoryHigher●Favors pagecache pages●Disabled at 100%
Pagecache TuningFilesystem/pagecache AllocationAccessed(pagecache under limit)ACTIVEAgingINACTIVE(new > old)reclaimFREEAccessed(pagecache over limit)
(Hint)flushing the pagecache[tmp]# echo 1 > /proc/sys/vm/drop_cachesprocs memory swap io system cpurb swpd free buff cache si so bi bo in cs us sy id wa0 0 224 57184 107808 3350196 0 0 0 56 1136 212 0 0 83 170 0 224 57184 107808 3350196 0 0 0 0 1039 198 0 0 100 00 0 224 57184 107808 3350196 0 0 0 0 1021 188 0 0 100 00 0 224 57184 107808 3350196 0 0 0 0 1035 204 0 0 100 00 0 224 57248 107808 3350196 0 0 0 0 1008 164 0 0 100 03 0 224 2128160 176 1438636 0 0 0 0 1030 197 0 15 85 00 0 224 3610656 204 34408 0 0 28 36 1027 177 0 32 67 20 0 224 3610656 204 34408 0 0 0 0 1026 180 0 0 100 00 0 224 3610720 212 34400 0 0 8 0 1010 183 0 0 99 1
(Hint)flushing the slabcache[tmp]# echo 2 > /proc/sys/vm/drop_caches[tmp]# cat /proc/meminfoMemTotal: 3907444 kBMemFree: 3604576 kBtmp]# cat /proc/meminfoMemTotal: 3907444 kBMemFree: 3604576 kBSlab:115420 kBSlab:115420 kBHugepagesize:2048 kBHugepagesize:2048 kB
x86<strong>RHEL</strong>3 kernel selection●●Standard kernel(no PAE, 3G/1G)●●UP systems with
x86●<strong>RHEL</strong>4 kernel selectionStandard kernel(no PAE, 3G/1G)●UP systems with
x86●<strong>RHEL</strong>5 kernel selectionStandard kernel(no PAE, 3G/1G)●UP and SMP systems with 4GB RAMX86_64●IA64●Standard kernel for all systemsStandard kernel for all systems
Problem 16GB x86 running SMP kernelZone:DMA freepages: 2207 min: 0 low: 0 high: 0Zone:Normal freepages: 484 min: 1279 low: 4544 high: 6304Zone:HighMem freepages: 266 min: 255 low: 61952 high: 92928Free pages: 2957 ( 266 HighMem)( Active: 245828/1297300, inactive_laundry: 194673, inactive_clean: 194668, free: 2957 )aa:0 ac:0 id:0 il:0 ic:0 fr:2207aa:630 ac:1009 id:189 il:233 ic:0 fr:484aa:195237 ac:48952 id:1297057 il:194493 ic:194668 fr:2661*4kB 1*8kB 1*16kB 1*32kB 1*64kB 0*128kB 0*256kB 1*512kB 0*1024kB 0*2048kB 2*4096kB = 8828kB)48*4kB 8*8kB 97*16kB 4*32kB 0*64kB 0*128kB 0*256kB 0*512kB 0*1024kB 0*2048kB 0*4096kB =1936kB)12*4kB 1*8kB 1*16kB 1*32kB 1*64kB 1*128kB 1*256kB 1*512kB 0*1024kB 0*2048kB 0*4096kB =1064kB)Swap cache: add 3838024, delete 3808901, find 107105/1540587, race 0+2138138 pages of slabcache1100 pages of kernel stacks0 lowmem pagetables, 37046 highmem pagetablesFree swap:3986092kB4194304 pages of RAM3833824 pages of HIGHMEM
Tuning File Systems and Disk IO <strong>Kernel</strong> <strong>Optimization</strong>s●CPU Scheduling multithreaded, multicore●NUMA – optimized w/ NUMActl●<strong>Kernel</strong> disk I/O – I/O schedulers, Direct I/O,Async I/O●File systems EXT3, NFS, GFS, OCFS●Database charactistics●Huge Pages – Hugetlbfs, db's java etc <strong>RHEL</strong>5 <strong>Performance</strong> Features
Linux at 16cpus quadcore and beyondRecognizes differences betweenlogical and physical processorsSocket 0Core 0Thread 0 Thread 1●I.E. Multicore, hyperthreaded &chips/socketsOptimizes process schedulingCore 1Thread 0 Thread 1Socket 1Thread 0 Thread 1Socket 2to take advantage of sharedonchip cache, and NUMA memory nodesImplements multilevel run queuesfor sockets and cores (asProcessProcessProcessProcessProcessProcessopposed to one run queueper processor or per system)●Strong CPU affinity avoidstask bouncingProcessProcessProcessProcessProcessProcess●Requires system BIOS to report CPUtopology correctlyScheduler Compute Queues
Asynchronous I/O to File Systems Allows application to continue processing while I/Synchronous I/OO is in progress●●Eliminates Synchronous I/O stallCritical for I/O intensive server applicationsStall forcompletionApp I/ORequestDeviceDriverI/O RequestIssue <strong>Red</strong> <strong>Hat</strong> Enterprise Linux – since 2002I/O●Support for RAW devices onlyApplicationI/O RequestCompletionWith <strong>Red</strong> <strong>Hat</strong> Enterprise Linux 4, significantimprovement:Asynchronous I/O●●Support for Ext3, NFS, GFS file systemaccessSupports Direct I/O (e.g. DatabaseNo stall forcompletionApp I/ORequestDeviceDriverI/O RequestIssueapplications)I/O●Makes benchmark results more appropriatefor realworld comparisonsI/OCompletionI/O RequestCompletionApplication<strong>Red</strong> <strong>Hat</strong> Confidential
Asynchronous I/O CharacteristicsR4 U4 FC AIO ReadR4 U4 FC AIO Write Perf160180140160MB/sec120100806040204k8k16k32k64kMB/sec140120100806040204k8k16k32k64k01 2 4 8 16 32 64aios01 2 4 8 16 32 64aios
<strong>Performance</strong> Tuning – DISK <strong>RHEL</strong>3[root@dhcp8336 sysctl]# /sbin/elvtune /dev/hda/dev/hda elevator ID 0read_latency: 2048write_latency: 8192max_bomb_segments: 6[root@dhcp8336 sysctl]# /sbin/elvtune r 1024 w 2048 /dev/hda/dev/hda elevator ID 0read_latency: 1024write_latency: 2048max_bomb_segments: 6
Disk IO tuning <strong>RHEL</strong>4/5<strong>RHEL</strong>4/5 – 4 tunable I/O Schedulers●●●●CFQ – elevator=cfq. Completely Fair Queuing default, balanced, fair formultiple luns, adaptors, smp serversNOOP – elevator=noop. Nooperation in kernel, simple, low cpuoverhead, leave opt to ramdisk, raid cntrl etc.Deadline – elevator=deadline. Optimize for runtimelike behavior, lowlatency per IO, balance issues with large IO luns/controllers (NOTE:current best for FC5)Anticipatory – elevator=as. Inserts delays to help stack aggregate IO,best on system w/ limited physical IO – SATA<strong>RHEL</strong>4 Set at boot time on command line<strong>RHEL</strong>5 – Change on the fly
File SystemsSeparate swap and busy partitions etc.EXT2/EXT3 – separate talkhttp://www.redhat.com/support/wpapers/redhat/ext3/*.html●Tune2fs or mount options●●data=ordered – only metadata journaleddata=journal – both metadata and data journaled●data=writeback – use with care !●Setup default block size at mkfs b XX<strong>RHEL</strong>4/5 EXT3 improves performance●●●Scalability upto 5 M file/systemSequential write by using block reservationsIncrease file system upto 8TBGFS – global file system – cluster file system
Optimizing File System <strong>Performance</strong>Use OLTP and DSS workloadsResults with various database tuning options●●RAW vs EXT3/GFS/NFS w/ o_direct (ie directIO in iozone)ASYNC IO options●<strong>RHEL</strong>3 – DIO+AIO not optimal (page cache still active)●<strong>RHEL</strong>4●EXT3 supports AIO+DIO out of the box●GFS – U2 full support AIO+DIO / Oracle cert●NFS – U3 full support of both DIO+AIO●HUGHMEM kernels on x86 kernelsHugeTLBS – use larger page sizes (ipcs)
Section 4 Examples General guidelines●Effect of NUMA and NUMCTL●Effect CPUspeed howto control Benchmarking●McCalpin – know max memory BW●IOzone – run your own Database Tuning JVM Tuning
McCalpin Streams Copy Bandwidth (1,2,4,8)1600025140002012000Rate (MB/s)10000800060001510NonNumaNuma%Difference40005200001 2 4 8No. of Streams0
<strong>RHEL</strong>4&5 NUMAstat and NUMActlNUMAstat to display system NUMA characteristics on a numasystem[root@perf5 ~]# numastatnode3 node2 node1 node0numa_hit 72684 82215 157244 325444numa_miss 0 0 0 0numa_foreign 0 0 0 0interleave_hit 2668 2431 2763 2699local_node 67306 77456 152115 324733other_node 5378 4759 5129 711NUMActl to control process and memory”TIPnumactl [ interleave nodes ] [ preferred node ] [ membind nodes ][ cpubind nodes ] [ localalloc ] command {arguments ...}●App < memory single NUMA zone●Numactl use –cpubind cpus within same socket●App > memory of a single NUMA zone●Numactl –interleave XY and –cpubind XY
<strong>RHEL</strong>4&5 NUMAstat and NUMActlEXAMPLESnumactl interleave=all bigdatabase arguments Run big database withits memory interleaved on all CPUs.numactl cpubind=0membind=0,1 process Run process on node 0 withmemory allocated on node 0 and 1.numactl preferred=1 numactl show Set preferred node 1 and show theresulting state.numactl interleave=all shmkeyfile /tmp/shmkey Interleave all of thesysv shared memory regiion specified by /tmp/shmkey over all nodes.numactl offset=1G length=1G membind=1 file /dev/shm/A touchBind the second gigabyte in the tmpfs file /dev/shm/A to node 1.numactl localalloc /dev/shm/file Reset the policy for the shared memoryfile file to the default localalloc policy.
Linux NUMA Evolution<strong>RHEL</strong>3, 4 and 5 Linpack MultistreamAMD64, 8cpu dualcore (1/2 cpus loaded)300000045<strong>Performance</strong> in Kflops2500000200000015000001000000500000403530252015105Default SchedulerTaskset AffinityColumn E0 Limitations :<strong>RHEL</strong>3U8 <strong>RHEL</strong>4U5 <strong>RHEL</strong>5GOLD0●●●Numa “spill” to different numa boundariesProcess migrations – no way backLack of page replication – text, read mostly
<strong>RHEL</strong>5.2 CPUspeed and performance:Enabled = governor set to “ondemand”Looks at cpu usage to regulate power●Within 35% of performance for cpu loads●IO loads can keep cpu stepped down 1530%Supported in <strong>RHEL</strong>5.2 virtualizationTo turn off – else may leave cpu’s in reduced step●If its not using performance, then:●# echo performance > /sys/devices/system/cpu/cpu0/cpufreq/scaling_governor●Then check to see if it stuck:●# cat /sys/devices/system/cpu/cpu0/cpufreq/scaling_governor●Check /proc/cpuinfo to make sure your seeing the expected CPU freq.Proceed to “normal” service disable●●Service cpuspeed stopChkconfig cpuspeed off
Effects of CPUspeed to peak performance:1.2<strong>RHEL</strong>5.2 Effect of CPUspeed on I/O workloadsIntel 4cpu, 16 Gb memory, FC disk1Relative <strong>Performance</strong> to Peak(cpuspeed disabled)0.80.60.40.20Iozone Perf Oracle OLTP IBM DB250% vs Peak99% vs Peak
Effects of CPUspeed with <strong>RHEL</strong>5.2 VirtualizationOracle runs with CPU Freq Xen kernel1.210.80.680 U Run180 U Run20.40.20<strong>RHEL</strong>51 Dom 0 CPU freq on <strong>RHEL</strong>51 Dom 0 CPU freq off <strong>RHEL</strong>51 PV CPU freq on <strong>RHEL</strong>51 PV CPU freq off
Using IOzone w/ o_direct – mimic database Problem :●●●Filesystems use memory for file cacheDatabases use memory for database cacheUsers want filesystem for management outside databaseaccess (copy, backup etc) You DON'T want BOTH to cache. Solution :●●●●Filesystems that support Direct IOOpen files with o_direct optionDatabases which support Direct IO (ORACLE)NO DOUBLE CACHING!
EXT3, GFS, NFS Iozone w/ DirectIO<strong>RHEL</strong>5 Direct_IO IOzone EXT3, GFS, NFS(Geom 1M4GB, 1k1m)<strong>Performance</strong> in MB/sec8070605040302010EXT_DIOGFS1_DIONFS_DIO0ALLInitialReWrite Read ReRead RandomRandomBackRecReStrideI/O'sWriteReadWritewardWriteReadRead<strong>Red</strong> <strong>Hat</strong> Confidential
The Translation Lookaside Buffer (TLB) is asmall CPU cache of recently used virtual tophysical address mappingsTLB misses are extremely expensive ontoday's very fast, pipelined CPUsLarge memory applicationscan incur high TLB miss ratesHugeTLBs permit memory to bemanaged in very large segments●E.G. Itanium ® :HugeTLBFSTLB●Standard page: 16KB●●Default huge page: 256MB16000:1 difference128 data128 instructionPhysical MemoryFile system mapping interfaceIdeal for databasesVirtual AddressSpace●E.G. TLB can fully map a 32GBOracle SGA<strong>Red</strong> <strong>Hat</strong> Confidential
Using HugeTLBfs w/ Databases<strong>RHEL</strong>4+5 Effect of HugeTLBfsOracle 10G OLTP <strong>Performance</strong>Intel 4cpu, 8GB memory, FC SanTransactions/min (k)60504030201016.0%14.0%12.0%10.0%8.0%6.0%4.0%2.0%Base (4k)HugeTLBfs (2MB)%Diff0<strong>RHEL</strong>4 U5<strong>RHEL</strong>5 GA0.0%
JVM Tuning Eliminate swapping●Lower swappiness to 10%(orlower if necessary). Promote pagecache reclaiming●Lower dirty_background_ratio to10%●Lower dirty_ratio if necessary Promote inode cache reclaiming●Lower vfs_cache_pressure
Tuning Network Apps Messages/sec Disable cpuspeed, selinux, auditd, irqbalanceManual binding IRQs w/ multiple nics●echo values > /proc/irq/XXX or use “TUNA”●Intel ixgb IRQs send/recv to cpu socket w/ shared cacheUse Taskset c to start applications on●1 cpu per socket – good for BW intensive app Shield cpus for critical apps●Move all existing processes off of the core(s) to cpu0 Pairs of cpus on the same socket – shared 2nd level cache Keep user apps on cpus separate from Network apps
RT Tuning Network Apps Messages/sec10 Gbit Nics Stoakley 2.67 to Bensley 3.0 GhzTuning enet gains +25% in Ave Latency,RT kernel reduced peak latency but smoother – how much?<strong>Red</strong> <strong>Hat</strong> MRG <strong>Performance</strong> AMQP Mess/sIntel 8cpu/16gb, 10Gb enet600000Messages/sec (32 byte size)50000040000030000020000010000001 2 3 4 5 6 7 8 9 10 11 12 13 14 15 16 17 18 19 20 21 22 23 24 25 26 27 28 29 30 31 32 33 34 35 36 37 38 39 40 41 42 43 44 45 46 47 48 49 50 51 52 53 54Samples (Million Message/sample)rhel52_base rhel52_tuned rhelrealtime_tune
RT Peformance of Network Apps Messages/secRH AMQP Latency on Intel 8cpu/10Gbit enet<strong>RHEL</strong>5.2 and <strong>RHEL</strong>RT120.00Milisecond/message100.0080.0060.0040.00AveStd DevMax20.00MaxAve0.00rt32brt64brt128brt256brt512brt1kbr5232br5264br52128br52256br52512br521kb
Numa Network Apps Messages/secWombat Messages/sec <strong>RHEL</strong>5.2Effects with Numa On/Off600003000500002500Messages/Sec400003000020001500Messages/sec Numa OnMessages/sec Numa OffAverage Latency (ms) NumaOnAverage Latency (ms) NumaOff20000100010000500005000 10000 15000 20000 25000 30000 40000 50000Message Rate
General <strong>Performance</strong> Tuning GuidelinesUse hugepages whenever possible.Minimize swapping.Maximize pagecache reclaimingPlace swap partition(s) on quitedevice(s).Direct IO if possible.Beware of turning NUMA off.
Benchmark TuningUse Hugepages.Dont overcommit memoryIf memory must be over committed●●●Eliminate all swapping.Maximize pagecache reclaimingPlace swap partition(s) onseparate device(s).Use Direct IODont turn NUMA off.
Linux <strong>Performance</strong> Tuning ReferencesAlikins, ?System Tuning Info for Linux Servers,http://people.redhat.com/alikins/system_tuning.html Axboe, J., ?Deadline IO Scheduler Tunables, SuSE, EDF R&D, 2003.Braswell, B, Ciliendo, E, ?Tuning <strong>Red</strong> <strong>Hat</strong> Enterprise Linux on IBMeServerxSeries Servers, http://www.ibm.com/redbooksCorbet, J., ?The Continuing Development of IO Scheduling?,http://lwn.net/Articles/21274. Ezolt, P, Optimizing Linux <strong>Performance</strong>, www.hp.com/hpbooks, Mar 2005.Heger, D, Pratt, S, ?Workload Dependent <strong>Performance</strong> Evaluation of the Linux2.6 IO Schedulers?, Linux Symposium, Ottawa, Canada, July 2004.<strong>Red</strong> <strong>Hat</strong> Enterprise Linux “<strong>Performance</strong> Tuning Guide”http://people.redhat.com/dshaks/rhel3_perf_tuning.pdfNetwork, NFS <strong>Performance</strong> covered in separate talkshttp://nfs.sourceforge.net/nfshowto/performance.html
Questions?