an orthotropic continuum model for the analysis of masonry structures
an orthotropic continuum model for the analysis of masonry structures
an orthotropic continuum model for the analysis of masonry structures

You also want an ePaper? Increase the reach of your titles
YUMPU automatically turns print PDFs into web optimized ePapers that Google loves.
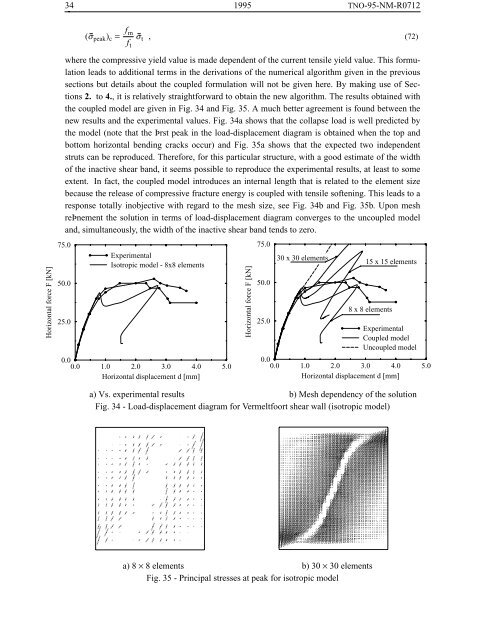
34 1995 TNO-95-NM-R0712(σ peak ) c = f mf tσ t , (72)Horizontal <strong>for</strong>ce F [kN]where <strong>the</strong> compressive yield value is made dependent <strong>of</strong> <strong>the</strong> current tensile yield value. This <strong>for</strong>mulationleads to additional terms in <strong>the</strong> derivations <strong>of</strong> <strong>the</strong> numerical algorithm given in <strong>the</strong> previoussections but details about <strong>the</strong> coupled <strong>for</strong>mulation will not be given here. By making use <strong>of</strong> Sections2. to 4., it is relatively straight<strong>for</strong>ward to obtain <strong>the</strong> new algorithm. The results obtained with<strong>the</strong> coupled <strong>model</strong> are given in Fig. 34 <strong>an</strong>d Fig. 35. A much better agreement is found between <strong>the</strong>new results <strong>an</strong>d <strong>the</strong> experimental values. Fig. 34a shows that <strong>the</strong> collapse load is well predicted by<strong>the</strong> <strong>model</strong> (note that <strong>the</strong> Þrst peak in <strong>the</strong> load-displacement diagram is obtained when <strong>the</strong> top <strong>an</strong>dbottom horizontal bending cracks occur) <strong>an</strong>d Fig. 35a shows that <strong>the</strong> expected two independentstruts c<strong>an</strong> be reproduced. There<strong>for</strong>e, <strong>for</strong> this particular structure, with a good estimate <strong>of</strong> <strong>the</strong> width<strong>of</strong> <strong>the</strong> inactive shear b<strong>an</strong>d, it seems possible to reproduce <strong>the</strong> experimental results, at least to someextent. In fact, <strong>the</strong> coupled <strong>model</strong> introduces <strong>an</strong> internal length that is related to <strong>the</strong> element sizebecause <strong>the</strong> release <strong>of</strong> compressive fracture energy is coupled with tensile s<strong>of</strong>tening. This leads to aresponse totally inobjective with regard to <strong>the</strong> mesh size, see Fig. 34b <strong>an</strong>d Fig. 35b. Upon meshreÞnement <strong>the</strong> solution in terms <strong>of</strong> load-displacement diagram converges to <strong>the</strong> uncoupled <strong>model</strong><strong>an</strong>d, simult<strong>an</strong>eously, <strong>the</strong> width <strong>of</strong> <strong>the</strong> inactive shear b<strong>an</strong>d tends to zero.75.050.025.0ExperimentalIsotropic <strong>model</strong> - 8x8 elements0.00.0 1.0 2.0 3.0 4.0 5.0Horizontal displacement d [mm]Horizontal <strong>for</strong>ce F [kN]75.050.025.030 x 30 elements15 x 15 elements8 x 8 elementsExperimentalCoupled <strong>model</strong>Uncoupled <strong>model</strong>0.00.0 1.0 2.0 3.0 4.0 5.0Horizontal displacement d [mm]a) Vs. experimental results b) Mesh dependency <strong>of</strong> <strong>the</strong> solutionFig. 34 - Load-displacement diagram <strong>for</strong> Vermeltfoort shear wall (isotropic <strong>model</strong>)a) 8 × 8 elements b) 30 × 30 elementsFig. 35 - Principal stresses at peak <strong>for</strong> isotropic <strong>model</strong>
![Weibull [Compatibility Mode]](https://img.yumpu.com/48296360/1/190x134/weibull-compatibility-mode.jpg?quality=85)