an orthotropic continuum model for the analysis of masonry structures
an orthotropic continuum model for the analysis of masonry structures
an orthotropic continuum model for the analysis of masonry structures

You also want an ePaper? Increase the reach of your titles
YUMPU automatically turns print PDFs into web optimized ePapers that Google loves.
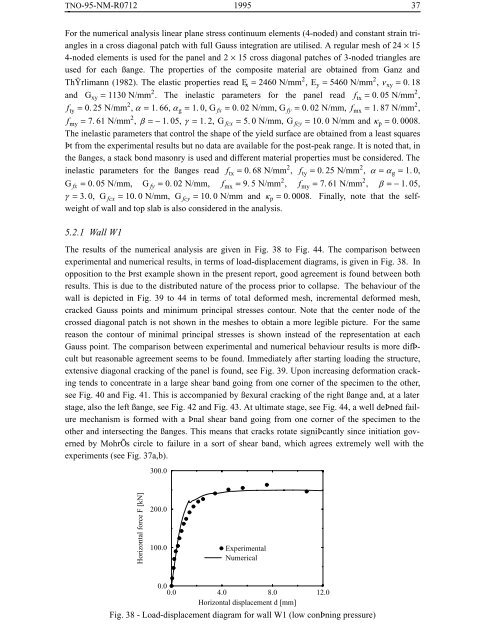
TNO-95-NM-R0712 1995 37For <strong>the</strong> numerical <strong>an</strong>alysis linear pl<strong>an</strong>e stress <strong>continuum</strong> elements (4-noded) <strong>an</strong>d const<strong>an</strong>t strain tri<strong>an</strong>glesin a cross diagonal patch with full Gauss integration are utilised. A regular mesh <strong>of</strong> 24 × 154-noded elements is used <strong>for</strong> <strong>the</strong> p<strong>an</strong>el <strong>an</strong>d 2 × 15 cross diagonal patches <strong>of</strong> 3-noded tri<strong>an</strong>gles areused <strong>for</strong> each ß<strong>an</strong>ge. The properties <strong>of</strong> <strong>the</strong> composite material are obtained from G<strong>an</strong>z <strong>an</strong>dThŸrlim<strong>an</strong>n (1982). The elastic properties read E x = 2460 N/mm 2 ,E y = 5460 N/mm 2 , ν xy = 0. 18<strong>an</strong>d G xy = 1130 N/mm 2 . The inelastic parameters <strong>for</strong> <strong>the</strong> p<strong>an</strong>el read f tx = 0. 05 N/mm 2 ,f ty = 0. 25 N/mm 2 , α = 1. 66, α g = 1. 0, G fx = 0. 02 N/mm, G fy = 0. 02 N/mm, f mx = 1. 87 N/mm 2 ,f my = 7. 61 N/mm 2 , β =−1. 05, γ = 1. 2, G fcx = 5. 0 N/mm, G fcy = 10. 0 N/mm <strong>an</strong>d κ p = 0. 0008.The inelastic parameters that control <strong>the</strong> shape <strong>of</strong> <strong>the</strong> yield surface are obtained from a least squaresÞt from <strong>the</strong> experimental results but no data are available <strong>for</strong> <strong>the</strong> post-peak r<strong>an</strong>ge. It is noted that, in<strong>the</strong> ß<strong>an</strong>ges, a stack bond <strong>masonry</strong> is used <strong>an</strong>d different material properties must be considered. Theinelastic parameters <strong>for</strong> <strong>the</strong> ß<strong>an</strong>ges read f tx = 0. 68 N/mm 2 , f ty = 0. 25 N/mm 2 , α = α g = 1. 0,G fx = 0. 05 N/mm, G fy = 0. 02 N/mm, f mx = 9. 5 N/mm 2 , f my = 7. 61 N/mm 2 , β =−1. 05,γ = 3. 0, G fcx = 10. 0 N/mm, G fcy = 10. 0 N/mm <strong>an</strong>d κ p = 0. 0008. Finally, note that <strong>the</strong> selfweight<strong>of</strong> wall <strong>an</strong>d top slab is also considered in <strong>the</strong> <strong>an</strong>alysis.5.2.1 Wall W1The results <strong>of</strong> <strong>the</strong> numerical <strong>an</strong>alysis are given in Fig. 38 to Fig. 44. The comparison betweenexperimental <strong>an</strong>d numerical results, in terms <strong>of</strong> load-displacement diagrams, is given in Fig. 38. Inopposition to <strong>the</strong> Þrst example shown in <strong>the</strong> present report, good agreement is found between bothresults. This is due to <strong>the</strong> distributed nature <strong>of</strong> <strong>the</strong> process prior to collapse. The behaviour <strong>of</strong> <strong>the</strong>wall is depicted in Fig. 39 to 44 in terms <strong>of</strong> total de<strong>for</strong>med mesh, incremental de<strong>for</strong>med mesh,cracked Gauss points <strong>an</strong>d minimum principal stresses contour. Note that <strong>the</strong> center node <strong>of</strong> <strong>the</strong>crossed diagonal patch is not shown in <strong>the</strong> meshes to obtain a more legible picture. For <strong>the</strong> samereason <strong>the</strong> contour <strong>of</strong> minimal principal stresses is shown instead <strong>of</strong> <strong>the</strong> representation at eachGauss point. The comparison between experimental <strong>an</strong>d numerical behaviour results is more difÞcultbut reasonable agreement seems to be found. Immediately after starting loading <strong>the</strong> structure,extensive diagonal cracking <strong>of</strong> <strong>the</strong> p<strong>an</strong>el is found, see Fig. 39. Upon increasing de<strong>for</strong>mation crackingtends to concentrate in a large shear b<strong>an</strong>d going from one corner <strong>of</strong> <strong>the</strong> specimen to <strong>the</strong> o<strong>the</strong>r,see Fig. 40 <strong>an</strong>d Fig. 41. This is accomp<strong>an</strong>ied by ßexural cracking <strong>of</strong> <strong>the</strong> right ß<strong>an</strong>ge <strong>an</strong>d, at a laterstage, also <strong>the</strong> left ß<strong>an</strong>ge, see Fig. 42 <strong>an</strong>d Fig. 43. At ultimate stage, see Fig. 44, a well deÞned failuremech<strong>an</strong>ism is <strong>for</strong>med with a Þnal shear b<strong>an</strong>d going from one corner <strong>of</strong> <strong>the</strong> specimen to <strong>the</strong>o<strong>the</strong>r <strong>an</strong>d intersecting <strong>the</strong> ß<strong>an</strong>ges. This me<strong>an</strong>s that cracks rotate signiÞc<strong>an</strong>tly since initiation governedby MohrÕs circle to failure in a sort <strong>of</strong> shear b<strong>an</strong>d, which agrees extremely well with <strong>the</strong>experiments (see Fig. 37a,b).300.0Horizontal <strong>for</strong>ce F [kN]200.0100.0ExperimentalNumerical0.00.0 4.0 8.0 12.0Horizontal displacement d [mm]Fig. 38 - Load-displacement diagram <strong>for</strong> wall W1 (low conÞning pressure)
![Weibull [Compatibility Mode]](https://img.yumpu.com/48296360/1/190x134/weibull-compatibility-mode.jpg?quality=85)