Permanent Forest Plot Project (PFPP) - EREN
Permanent Forest Plot Project (PFPP) - EREN
Permanent Forest Plot Project (PFPP) - EREN

Create successful ePaper yourself
Turn your PDF publications into a flip-book with our unique Google optimized e-Paper software.
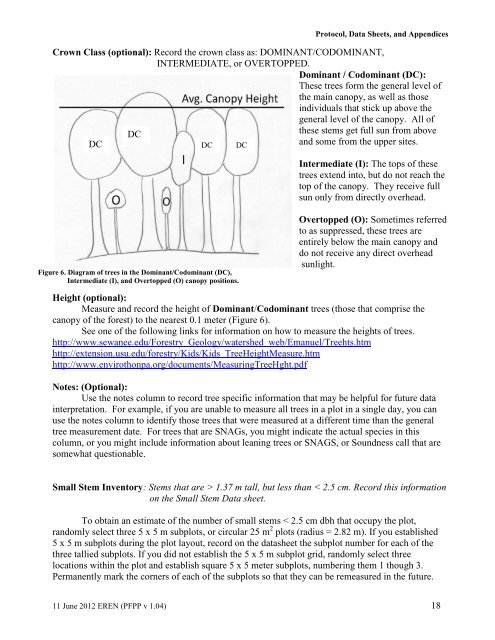
Protocol, Data Sheets, and AppendicesCrown Class (optional): Record the crown class as: DOMINANT/CODOMINANT,INTERMEDIATE, or OVERTOPPED.Dominant / Codominant (DC):These trees form the general level ofthe main canopy, as well as thoseindividuals that stick up above thegeneral level of the canopy. All ofDCDC DC DCthese stems get full sun from aboveand some from the upper sites.Intermediate (I): The tops of thesetrees extend into, but do not reach thetop of the canopy. They receive fullsun only from directly overhead.Figure 6. Diagram of trees in the Dominant/Codominant (DC),Intermediate (I), and Overtopped (O) canopy positions.Overtopped (O): Sometimes referredto as suppressed, these trees areentirely below the main canopy anddo not receive any direct overheadsunlight.Height (optional):Measure and record the height of Dominant/Codominant trees (those that comprise thecanopy of the forest) to the nearest 0.1 meter (Figure 6).See one of the following links for information on how to measure the heights of trees.http://www.sewanee.edu/<strong>Forest</strong>ry_Geology/watershed_web/Emanuel/Treehts.htmhttp://extension.usu.edu/forestry/Kids/Kids_TreeHeightMeasure.htmhttp://www.envirothonpa.org/documents/MeasuringTreeHght.pdfNotes: (Optional):Use the notes column to record tree specific information that may be helpful for future datainterpretation. For example, if you are unable to measure all trees in a plot in a single day, you canuse the notes column to identify those trees that were measured at a different time than the generaltree measurement date. For trees that are SNAGs, you might indicate the actual species in thiscolumn, or you might include information about leaning trees or SNAGS, or Soundness call that aresomewhat questionable.Small Stem Inventory: Stems that are > 1.37 m tall, but less than < 2.5 cm. Record this informationon the Small Stem Data sheet.To obtain an estimate of the number of small stems < 2.5 cm dbh that occupy the plot,randomly select three 5 x 5 m subplots, or circular 25 m 2 plots (radius = 2.82 m). If you established5 x 5 m subplots during the plot layout, record on the datasheet the subplot number for each of thethree tallied subplots. If you did not establish the 5 x 5 m subplot grid, randomly select threelocations within the plot and establish square 5 x 5 meter subplots, numbering them 1 though 3.<strong>Permanent</strong>ly mark the corners of each of the subplots so that they can be remeasured in the future.11 June 2012 <strong>EREN</strong> (<strong>PFPP</strong> v 1.04) 18