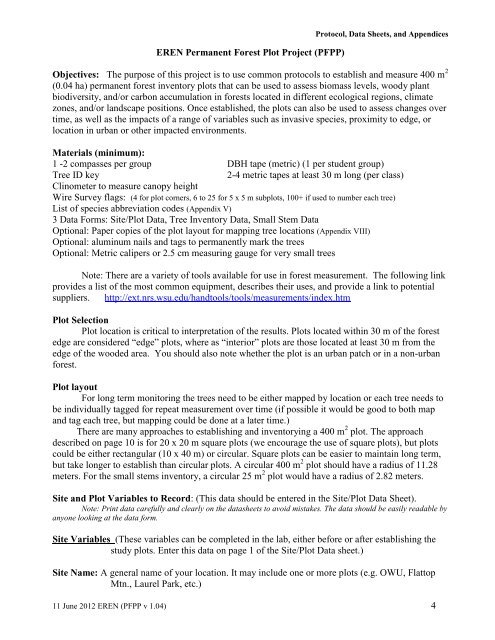
<strong>EREN</strong> <strong>Permanent</strong> <strong>Forest</strong> <strong>Plot</strong> <strong>Project</strong> (<strong>PFPP</strong>)Protocol, Data Sheets, and AppendicesObjectives: The purpose of this project is to use common protocols to establish and measure 400 m 2(0.04 ha) permanent forest inventory plots that can be used to assess biomass levels, woody plantbiodiversity, and/or carbon accumulation in forests located in different ecological regions, climatezones, and/or landscape positions. Once established, the plots can also be used to assess changes overtime, as well as the impacts of a range of variables such as invasive species, proximity to edge, orlocation in urban or other impacted environments.Materials (minimum):1 -2 compasses per group DBH tape (metric) (1 per student group)Tree ID key2-4 metric tapes at least 30 m long (per class)Clinometer to measure canopy heightWire Survey flags: (4 for plot corners, 6 to 25 for 5 x 5 m subplots, 100+ if used to number each tree)List of species abbreviation codes (Appendix V)3 Data Forms: Site/<strong>Plot</strong> Data, Tree Inventory Data, Small Stem DataOptional: Paper copies of the plot layout for mapping tree locations (Appendix VIII)Optional: aluminum nails and tags to permanently mark the treesOptional: Metric calipers or 2.5 cm measuring gauge for very small treesNote: There are a variety of tools available for use in forest measurement. The following linkprovides a list of the most common equipment, describes their uses, and provide a link to potentialsuppliers. http://ext.nrs.wsu.edu/handtools/tools/measurements/index.htm<strong>Plot</strong> Selection<strong>Plot</strong> location is critical to interpretation of the results. <strong>Plot</strong>s located within 30 m of the forestedge are considered “edge” plots, where as “interior” plots are those located at least 30 m from theedge of the wooded area. You should also note whether the plot is an urban patch or in a non-urbanforest.<strong>Plot</strong> layoutFor long term monitoring the trees need to be either mapped by location or each tree needs tobe individually tagged for repeat measurement over time (if possible it would be good to both mapand tag each tree, but mapping could be done at a later time.)There are many approaches to establishing and inventorying a 400 m 2 plot. The approachdescribed on page 10 is for 20 x 20 m square plots (we encourage the use of square plots), but plotscould be either rectangular (10 x 40 m) or circular. Square plots can be easier to maintain long term,but take longer to establish than circular plots. A circular 400 m 2 plot should have a radius of 11.28meters. For the small stems inventory, a circular 25 m 2 plot would have a radius of 2.82 meters.Site and <strong>Plot</strong> Variables to Record: (This data should be entered in the Site/<strong>Plot</strong> Data Sheet).Note: Print data carefully and clearly on the datasheets to avoid mistakes. The data should be easily readable byanyone looking at the data form.Site Variables (These variables can be completed in the lab, either before or after establishing thestudy plots. Enter this data on page 1 of the Site/<strong>Plot</strong> Data sheet.)Site Name: A general name of your location. It may include one or more plots (e.g. OWU, FlattopMtn., Laurel Park, etc.)11 June 2012 <strong>EREN</strong> (<strong>PFPP</strong> v 1.04) 4
Protocol, Data Sheets, and AppendicesSite Date: The date that the site is described. The site will be identified in the database using thisyear.Ecoregion (Bailey’s): Enter the Bailey’s Domain, Division, and Province.A list of Ecoregion Domains, Divisions, and Provinces can be downloaded from the <strong>EREN</strong><strong>PFPP</strong> website. The ecoregion can be visually determined from the following website:http://www.fs.fed.us/land/ecosysmgmt/ Alternately the Province can be determined by entering thezipcode of the location in the following website, http://www.pollinator.org/guides.htm, and theDomain and Division can be found on http://www.fs.fed.us/land/ecosysmgmt/If you live in a region where Bailey’s Ecoregions have not been delineated, record “NoDomain”, “No Division”, and “No Province” in the three blanks.Mean Annual Air Temperature: Record the temperature in degrees Celsius.Mean Temperature data source: Indicate if the source is LOCAL or obtained from the WEB.Air Temperature Source Note: If the source is the WEB, indicate the site used to obtain the data.There are a variety of data sources for obtaining average annual temperatures. If you haveaccess to data from a weather station close to the site, use that data and record the source as LOCAL.If you need to obtain the value, the WEB is a useful source. There are a number of possible sites fromwhich you can obtain your data, some free, some requiring a fee. The following NOAA website(http://www4.ncdc.noaa.gov/cgi-win/wwcgi.dll?WWDI~getstate~USA ) may require a fee for somedata forms.If you use one of the WEB sites, note the actual location for which the data was recorded.Sometime the data for smaller locations are actually reports from the nearest large city. Theinstructions below illustrate how to obtain weather information from two different free sites: WeatherUnderground, and the NOAA Coop site.Weather Underground: http://www.wunderground.com/history/1. Type in location (city name or zip code)2. Type in date and select “submit”3. When data screen opens, select “custom” tab4. Type in any two dates as prompted. Note that they must be < or = one year apart.5. Select “go”.6. Data will appear including:a. Temperature (min, max, mean) d. Precipitationb. Degree days (heating, cooling, growing) e. Windc. Dew point f. Sea level pressure7. Note that you can select any time span up to and including the entire year (12 months) prior to your samplingdate.NOAA Coop Site: http://www7.ncdc.noaa.gov/IPS/coop/coop.htmlThe NOAA COOP site provide free, downloadable pdf files of monthly temperature and precipitation datasubmitted by volunteer COOP stations. The data would need to be converted to spreadsheet format and summarizedto obtain annual totals, a project that could be conducted by students as part of a class activity.To use the COOP site, highlight the correct state, and then select “Next”. Look through the available stations list andsee if there is a COOP station near your forest that has data available for the time period of interest. Note that themost recent month is generally not yet available. If there is an available station, select the station, and “Next”. A listof available months and years will appear. Select the dates of interest. You can download each month as a separatepdf file. Monthly temperature and precipitation data can then be entered in excel and used to compute annualaverages. (Note that the data is reported in degrees Fahrenheit and inches and would need to be converted to degreesCelcius and millimeters.11 June 2012 <strong>EREN</strong> (<strong>PFPP</strong> v 1.04) 5
- Page 1 and 2: Permanent Forest PlotProject (PFPP)
- Page 3: Protocol, Data Sheets, and Appendic
- Page 7 and 8: Protocol, Data Sheets, and Appendic
- Page 9 and 10: Protocol, Data Sheets, and Appendic
- Page 11 and 12: Protocol, Data Sheets, and Appendic
- Page 14 and 15: Protocol, Data Sheets, and Appendic
- Page 16 and 17: Methods for Accurate DBH and DBH In
- Page 18 and 19: Protocol, Data Sheets, and Appendic
- Page 20 and 21: Protocol, Data Sheets, and Appendic
- Page 22 and 23: Site/Plot Data Entry Form (EREN Per
- Page 24 and 25: Tree Data Entry Form (EREN Permanen
- Page 26 and 27: Web Soil Survey Instructions (V
- Page 28 and 29: Web Soil Survey Instructions 7/3
- Page 30 and 31: Web Soil Survey Instructions 7/3
- Page 32 and 33: Web Soil Survey Instructions 7/3
- Page 34 and 35: ContentsPreface....................
- Page 36 and 37: EREN PFPP Appendix II1. Use the soi
- Page 38 and 39: EREN PFPP Appendix IIIFigure 3. The
- Page 41 and 42: 21.37 m1.37 m1.37 m1 m1.37 m1.37 m1
- Page 43 and 44: Estimating Stem Soundness (EREN PFP
- Page 45 and 46: NW51015SW15 10EREN PFPPAppendix VII


