Permanent Forest Plot Project (PFPP) - EREN
Permanent Forest Plot Project (PFPP) - EREN
Permanent Forest Plot Project (PFPP) - EREN

Create successful ePaper yourself
Turn your PDF publications into a flip-book with our unique Google optimized e-Paper software.
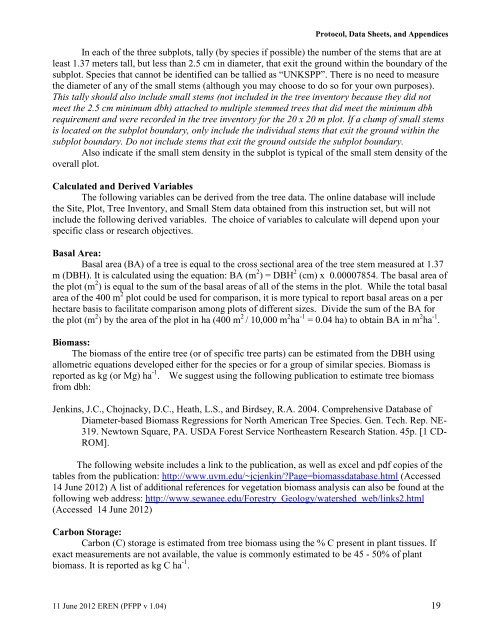
Protocol, Data Sheets, and AppendicesIn each of the three subplots, tally (by species if possible) the number of the stems that are atleast 1.37 meters tall, but less than 2.5 cm in diameter, that exit the ground within the boundary of thesubplot. Species that cannot be identified can be tallied as “UNKSPP”. There is no need to measurethe diameter of any of the small stems (although you may choose to do so for your own purposes).This tally should also include small stems (not included in the tree inventory because they did notmeet the 2.5 cm minimum dbh) attached to multiple stemmed trees that did meet the minimum dbhrequirement and were recorded in the tree inventory for the 20 x 20 m plot. If a clump of small stemsis located on the subplot boundary, only include the individual stems that exit the ground within thesubplot boundary. Do not include stems that exit the ground outside the subplot boundary.Also indicate if the small stem density in the subplot is typical of the small stem density of theoverall plot.Calculated and Derived VariablesThe following variables can be derived from the tree data. The online database will includethe Site, <strong>Plot</strong>, Tree Inventory, and Small Stem data obtained from this instruction set, but will notinclude the following derived variables. The choice of variables to calculate will depend upon yourspecific class or research objectives.Basal Area:Basal area (BA) of a tree is equal to the cross sectional area of the tree stem measured at 1.37m (DBH). It is calculated using the equation: BA (m 2 ) = DBH 2 (cm) x 0.00007854. The basal area ofthe plot (m 2 ) is equal to the sum of the basal areas of all of the stems in the plot. While the total basalarea of the 400 m 2 plot could be used for comparison, it is more typical to report basal areas on a perhectare basis to facilitate comparison among plots of different sizes. Divide the sum of the BA forthe plot (m 2 ) by the area of the plot in ha (400 m 2 / 10,000 m 2 ha -1 = 0.04 ha) to obtain BA in m 2 ha -1 .Biomass:The biomass of the entire tree (or of specific tree parts) can be estimated from the DBH usingallometric equations developed either for the species or for a group of similar species. Biomass isreported as kg (or Mg) ha -1 . We suggest using the following publication to estimate tree biomassfrom dbh:Jenkins, J.C., Chojnacky, D.C., Heath, L.S., and Birdsey, R.A. 2004. Comprehensive Database ofDiameter-based Biomass Regressions for North American Tree Species. Gen. Tech. Rep. NE-319. Newtown Square, PA. USDA <strong>Forest</strong> Service Northeastern Research Station. 45p. [1 CD-ROM].The following website includes a link to the publication, as well as excel and pdf copies of thetables from the publication: http://www.uvm.edu/~jcjenkin/?Page=biomassdatabase.html (Accessed14 June 2012) A list of additional references for vegetation biomass analysis can also be found at thefollowing web address: http://www.sewanee.edu/<strong>Forest</strong>ry_Geology/watershed_web/links2.html(Accessed 14 June 2012)Carbon Storage:Carbon (C) storage is estimated from tree biomass using the % C present in plant tissues. Ifexact measurements are not available, the value is commonly estimated to be 45 - 50% of plantbiomass. It is reported as kg C ha -1 .11 June 2012 <strong>EREN</strong> (<strong>PFPP</strong> v 1.04) 19