Innovation Canada: A Call to Action
Innovation Canada: A Call to Action
Innovation Canada: A Call to Action

You also want an ePaper? Increase the reach of your titles
YUMPU automatically turns print PDFs into web optimized ePapers that Google loves.
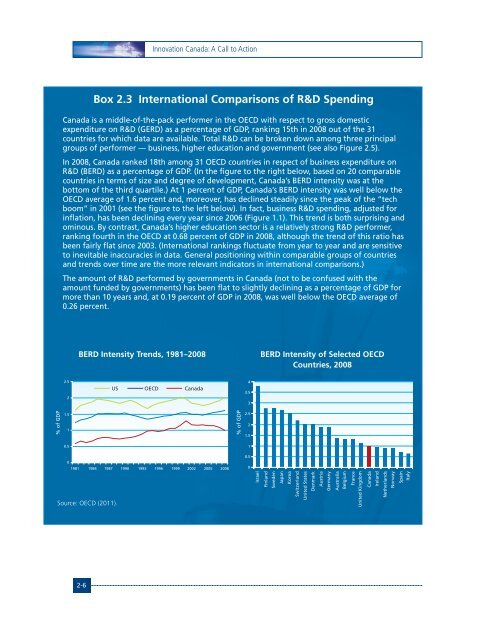
<strong>Innovation</strong> <strong>Canada</strong>: A <strong>Call</strong> <strong>to</strong> <strong>Action</strong>Box 2.3 International Comparisons of R&D Spending<strong>Canada</strong> is a middle-of-the-pack performer in the OECD with respect <strong>to</strong> gross domesticexpenditure on R&D (GERD) as a percentage of GDP, ranking 15th in 2008 out of the 31countries for which data are available. Total R&D can be broken down among three principalgroups of performer — business, higher education and government (see also Figure 2.5).In 2008, <strong>Canada</strong> ranked 18th among 31 OECD countries in respect of business expenditure onR&D (BERD) as a percentage of GDP. (In the figure <strong>to</strong> the right below, based on 20 comparablecountries in terms of size and degree of development, <strong>Canada</strong>’s BERD intensity was at thebot<strong>to</strong>m of the third quartile.) At 1 percent of GDP, <strong>Canada</strong>’s BERD intensity was well below theOECD average of 1.6 percent and, moreover, has declined steadily since the peak of the “techboom” in 2001 (see the figure <strong>to</strong> the left below). In fact, business R&D spending, adjusted forinflation, has been declining every year since 2006 (Figure 1.1). This trend is both surprising andominous. By contrast, <strong>Canada</strong>’s higher education sec<strong>to</strong>r is a relatively strong R&D performer,ranking fourth in the OECD at 0.68 percent of GDP in 2008, although the trend of this ratio hasbeen fairly flat since 2003. (International rankings fluctuate from year <strong>to</strong> year and are sensitive<strong>to</strong> inevitable inaccuracies in data. General positioning within comparable groups of countriesand trends over time are the more relevant indica<strong>to</strong>rs in international comparisons.)The amount of R&D performed by governments in <strong>Canada</strong> (not <strong>to</strong> be confused with theamount funded by governments) has been flat <strong>to</strong> slightly declining as a percentage of GDP formore than 10 years and, at 0.19 percent of GDP in 2008, was well below the OECD average of0.26 percent.BERD Intensity Trends, 1981–2008BERD Intensity of Selected OECDCountries, 20082.52USOECD<strong>Canada</strong>43.53% of GDP1.51% of GDP2.521.50.5101981 1984 1987 1990 1993 1996 1999 2002 2005 20080.50Source: OECD (2011).IsraelFinlandSwedenJapanKoreaSwitzerlandUnited StatesDenmarkAustriaGermanyAustraliaBelgiumFranceUnited Kingdom<strong>Canada</strong>IrelandNetherlandsNorwaySpainItaly2-6