<strong>Indicators</strong> <strong>of</strong> the welcoming society could be usedto facilitate how public opinion and perception <strong>of</strong>discrimination influence integration outcomes - alink which receives growing attention in research.Chapter 4:Migrant integrationand the Europe 2020The Europe 2020 Strategy is the <strong>European</strong> Union’sten-year growth strategy. It sets out overall targetsin the area <strong>of</strong> employment, education, environment,poverty and social exclusion. All MemberStates have committed to achieving Europe 2020targets and have translated them into nationaltargets and policies. The targets are coordinatedthrough monitoring, coordination and reporting inthe framework <strong>of</strong> the <strong>European</strong> Semester, a yearlycycle <strong>of</strong> economic policy coordination. The Europe2020 targets are relevant for immigrant integration,namely employment, early school leaving, tertiaryeducation, poverty or social exclusion.However, migrant integration has so far not sufficientlybeen mainstreamed into main <strong>EU</strong> policyareas despite the fact that there are wellfunctioningpolicy mechanisms in place. Only afew indicators used in these mechanisms havebeen disaggregated for immigrants even whendata allows for such break-downs. The outcomes<strong>of</strong> the Analysis Report can be used to incorporateimmigrant integration into the monitoring andtarget setting <strong>of</strong> established policy frameworks inemployment, education and social inclusion.Closing the gapThis report outlines relevant factors that influencemigrant integration to inform integrationpolicies at various levels <strong>of</strong> governance. <strong>Integration</strong>policy <strong>of</strong>ten aims at closing the gap betweenimmigrants and non-immigrants in the<strong>EU</strong>. Providing equal opportunities for immigrantsand delivering specific support are importantbecause immigrants are a particular vulnerablegroup. Furthermore, society as a whole benefitsfrom closing the gaps between people with andwithout an immigrant background, in particularwhere and when immigrants are or become alarge part <strong>of</strong> the population.Between 10-15 % <strong>of</strong> the total population in <strong>EU</strong>-15 countries were foreign-born in 2010. <strong>Immigrant</strong>sare particularly overrepresented amongyounger age groups in many countries. Accordingto a Eurostat working paper on demographicprojections <strong>of</strong> the foreign-born population in <strong>EU</strong>countries from 2010, the share <strong>of</strong> foreign-bornis likely to more than double by 2061. The mostconservative projection estimates that 26.5 % <strong>of</strong>the <strong>EU</strong> population would have a ‘foreign background’by 2061. By 2061, at least every thirdperson in Austria, Belgium, Cyprus, Germany,Greece, Luxemburg, Portugal, Spain, Sweden,and the United Kingdom is estimated to have aforeign background. As the relative importance<strong>of</strong> immigrants in our society increases, the outcomes<strong>of</strong> migrant integration become more relevantfor where the general society is heading.If policymakers in a Member State want to reducethe number <strong>of</strong> students leaving schoolswithout a degree, they have to take into accountthe particular challenges <strong>of</strong> immigrants as theyrepresent a large share <strong>of</strong> new children in schoolin many countries. They then may wish to comparethis group with their peers without an immigrantbackground and control for gender andsocio-economic background.To illustrate the impact <strong>of</strong> effectively integratingimmigrants into the <strong>EU</strong> agenda, the projecthas calculated a ‘closing the gap-scenario’ usingseveral indicators as examples. The ‘closing thegap- scenario’ assumes equal outcomes <strong>of</strong> themigrant population in comparison with the totalpopulation. Based on this hypothetical scenario,we show the potential impact <strong>of</strong> complete convergence<strong>of</strong> outcomes on overall improvementand on meeting the respective Europe 2020 targets(see annex for full list). 18Currently, the total employment rate in the <strong>EU</strong> is69 %. The employment rate for the foreign-bornis 64 %. The Europe 2020 target is to increase theoverall rate to 75 %. Closing the employment gapfor foreign-born immigrants accounts for 10.7 %<strong>of</strong> meeting the Europe 2020 target across all <strong>EU</strong>countries for which targets and data are available.Given the ‘no gap scenario’, Austria, Germany, theNetherlands, and Sweden would half-way meettheir national Europe 2020 target (see annex).Member States could prevent half a million peoplefrom leaving school early, if they could close30(18) Our calculations are based on Eurostat data which is available online. We take the rates and population sizesfor 2010. The Europe 2020 targets are based on the National Reform Programmes <strong>of</strong> April 2011. Data was notavailable for Romania and Slovakia in most cases. These calculations could be done for a comparison betweenthe native born and foreign –born population.
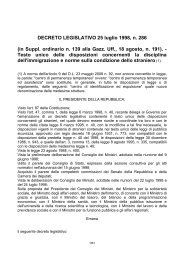
the gap for migrants. This accounts for 8.7 % <strong>of</strong> allearly school leavers in the <strong>EU</strong>. The <strong>EU</strong> as a wholewould be 30 % closer its headline target <strong>of</strong> reducingthe early school leaver rate from 14 to 10 %.The ‘no gap scenario’ accounts for more than 50 %<strong>of</strong> reaching the target in Belgium, Cyprus, Denmark,Germany, Greece, and Italy. In fact, Sweden wouldexceed its national education target (see Annex).23 % <strong>of</strong> the <strong>EU</strong> population is at risk <strong>of</strong> povertyor social exclusion. The rate is 9 % higher for theforeign-born population (32 %). If this gap wereclosed, the <strong>EU</strong> could lift 3.3 million immigrantsout <strong>of</strong> poverty or social exclusion. This number accountsfor 5 % <strong>of</strong> all people at risk <strong>of</strong> poverty orsocial exclusion in the <strong>EU</strong>. This stands for 17 % <strong>of</strong>all people at risk <strong>of</strong> poverty or social exclusion inAustria, 19 % in Belgium, and almost 19 % in Sweden.Closing the gap for immigrants would bringthe whole <strong>of</strong> the <strong>EU</strong> 16.2 % closer to reaching itsheadline poverty target. The migrant gap representsmore than 50 % <strong>of</strong> the national targets inAustria, Belgium, Greece, and the Netherlands.Of course, the ‘no gap scenario’ is unlikely in theshort run. It is based on targets and populationstatistics that are subject to constant changes.However, this exercise is useful to emphasise thatimmigrants play a significant role for Europe inreaching its overall targets. Mainstreaming migrantintegration into established monitoring andtarget setting mechanism at <strong>EU</strong> level is crucial toaccount for the (increasing) relative importance <strong>of</strong>the migrant population in many <strong>EU</strong> countries.The ‘closing the gap – scenario’ for the Europe 2020 headlineRate <strong>of</strong> the totalpopulation, %2010Rates <strong>of</strong> theforeign-born, %2010Europe 2020Target (2011)The number <strong>of</strong>people lifted out<strong>of</strong> poverty riskor social exclusiongiven the'no migrant gapscenario'% <strong>of</strong> all peoplethat would belifted out <strong>of</strong> povertyrisk or socialexclusion giventhe ‘no migrantgap scenario’Share <strong>of</strong> 'nomigrant gap'<strong>of</strong> reaching theEurope 2020targets, in %<strong>EU</strong>25 (w/o RO, SL) 23 32 20000000 3249117 49 16.2Belgium 20 40 380000 225665 19.6 59.4Bulgaria 37 45 260000 3654 1.9 1.4Czech Republic 14 24 Remain the same 34488 3.7Denmark 19 39 22000 low work 76707 12.2intensityGermany 21 28 33000 long-term 598311 5.8unemployedEstonia 22 26 Only risk <strong>of</strong> poverty 57493.2Ireland 29 31 186000 9213 1.2 5.0Greece 28 51 450000 230768 12.0 51.3Spain 25 36 1450000 564851 7.7 39.0France 20 32 Only risk <strong>of</strong> poverty 629175 8.5Italy 24 34 2200000 391679 4.4 17.8Cyprus 20 31 27000 11718 11.4 43.4Latvia 37 40 121000 7972 1.5 6.6Lithuania 34 37 170000 3710 0.5 2.2Luxembourg 18 22 x 5601 10.2Hungary 30 26 450000 -13844 -0.7 -3.1Malta 19 23 6560 928 1.9 14.2Netherlands 16 28 100000 181759 11.2 181.8Austria 16 30 235000 139409 17.0 59.3Poland 28 27 1500000 -409 0.0 0.0Portugal 24 24 200000 -2638 -0.2 -1.3Romania 40 : 580000Slovenia 18 27 40000 17916 7.5 44.8Slovakia 20 27 170000 0Finland 17 40 150000 42716 7.9 28.5Sweden 14 28 x 142747 18.7United Kingdom 21 28 x 379597 4.931