Using EU Indicators of Immigrant Integration - European ...
Using EU Indicators of Immigrant Integration - European ...
Using EU Indicators of Immigrant Integration - European ...
- No tags were found...

You also want an ePaper? Increase the reach of your titles
YUMPU automatically turns print PDFs into web optimized ePapers that Google loves.
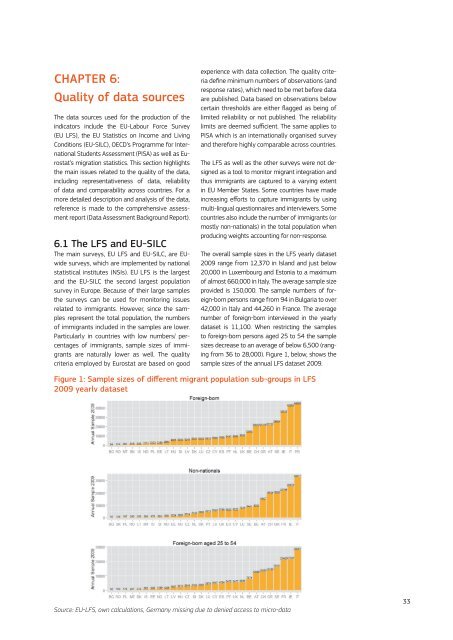
Chapter 6:Quality <strong>of</strong> data sourcesThe data sources used for the production <strong>of</strong> theindicators include the <strong>EU</strong>-Labour Force Survey(<strong>EU</strong> LFS), the <strong>EU</strong> Statistics on Income and LivingConditions (<strong>EU</strong>-SILC), OECD’s Programme for InternationalStudents Assessment (PISA) as well as Eurostat’smigration statistics. This section highlightsthe main issues related to the quality <strong>of</strong> the data,including representativeness <strong>of</strong> data, reliability<strong>of</strong> data and comparability across countries. For amore detailed description and analysis <strong>of</strong> the data,reference is made to the comprehensive assessmentreport (Data Assessment Background Report).6.1 The LFS and <strong>EU</strong>-SILCThe main surveys, <strong>EU</strong> LFS and <strong>EU</strong>-SILC, are <strong>EU</strong>widesurveys, which are implemented by nationalstatistical institutes (NSIs). <strong>EU</strong> LFS is the largestand the <strong>EU</strong>-SILC the second largest populationsurvey in Europe. Because <strong>of</strong> their large samplesthe surveys can be used for monitoring issuesrelated to immigrants. However, since the samplesrepresent the total population, the numbers<strong>of</strong> immigrants included in the samples are lower.Particularly in countries with low numbers/ percentages<strong>of</strong> immigrants, sample sizes <strong>of</strong> immigrantsare naturally lower as well. The qualitycriteria employed by Eurostat are based on goodexperience with data collection. The quality criteriadefine minimum numbers <strong>of</strong> observations (andresponse rates), which need to be met before dataare published. Data based on observations belowcertain thresholds are either flagged as being <strong>of</strong>limited reliability or not published. The reliabilitylimits are deemed sufficient. The same applies toPISA which is an internationally organised surveyand therefore highly comparable across countries.The LFS as well as the other surveys were not designedas a tool to monitor migrant integration andthus immigrants are captured to a varying extentin <strong>EU</strong> Member States. Some countries have madeincreasing efforts to capture immigrants by usingmulti-lingual questionnaires and interviewers. Somecountries also include the number <strong>of</strong> immigrants (ormostly non-nationals) in the total population whenproducing weights accounting for non-response.The overall sample sizes in the LFS yearly dataset2009 range from 12,370 in Island and just below20,000 in Luxembourg and Estonia to a maximum<strong>of</strong> almost 660,000 in Italy. The average sample sizeprovided is 150,000. The sample numbers <strong>of</strong> foreign-bornpersons range from 94 in Bulgaria to over42,000 in Italy and 44,260 in France. The averagenumber <strong>of</strong> foreign-born interviewed in the yearlydataset is 11,100. When restricting the samplesto foreign-born persons aged 25 to 54 the samplesizes decrease to an average <strong>of</strong> below 6,500 (rangingfrom 36 to 28,000). Figure 1, below, shows thesample sizes <strong>of</strong> the annual LFS dataset 2009.Figure 1: Sample sizes <strong>of</strong> different migrant population sub-groups in LFS2009 yearly datasetSource: <strong>EU</strong>-LFS, own calculations, Germany missing due to denied access to micro-data33