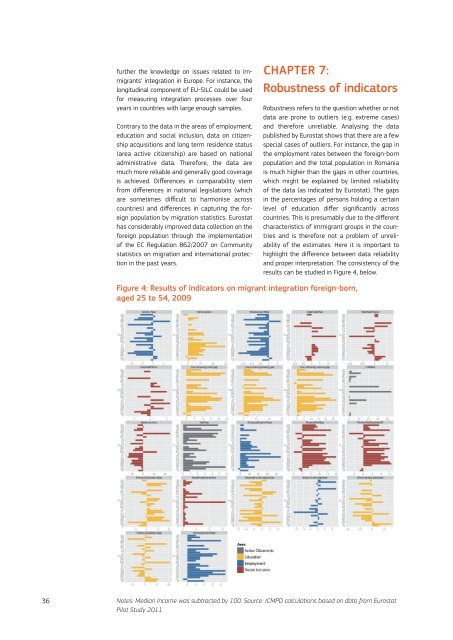
further the knowledge on issues related to immigrants’integration in Europe. For instance, thelongitudinal component <strong>of</strong> <strong>EU</strong>-SILC could be usedfor measuring integration processes over fouryears in countries with large enough samples.Contrary to the data in the areas <strong>of</strong> employment,education and social inclusion, data on citizenshipacquisitions and long term residence status(area active citizenship) are based on nationaladministrative data. Therefore, the data aremuch more reliable and generally good coverageis achieved. Differences in comparability stemfrom differences in national legislations (whichare sometimes difficult to harmonise acrosscountries) and differences in capturing the foreignpopulation by migration statistics. Eurostathas considerably improved data collection on theforeign population through the implementation<strong>of</strong> the EC Regulation 862/2007 on Communitystatistics on migration and international protectionin the past years.Chapter 7:Robustness <strong>of</strong> indicatorsRobustness refers to the question whether or notdata are prone to outliers (e.g. extreme cases)and therefore unreliable. Analysing the datapublished by Eurostat shows that there are a fewspecial cases <strong>of</strong> outliers. For instance, the gap inthe employment rates between the foreign-bornpopulation and the total population in Romaniais much higher than the gaps in other countries,which might be explained by limited reliability<strong>of</strong> the data (as indicated by Eurostat). The gapsin the percentages <strong>of</strong> persons holding a certainlevel <strong>of</strong> education differ significantly acrosscountries. This is presumably due to the differentcharacteristics <strong>of</strong> immigrant groups in the countriesand is therefore not a problem <strong>of</strong> unreliability<strong>of</strong> the estimates. Here it is important tohighlight the difference between data reliabilityand proper interpretation. The consistency <strong>of</strong> theresults can be studied in Figure 4, below.Figure 4: Results <strong>of</strong> indicators on migrant integration foreign-born,aged 25 to 54, 200936Notes: Median Income was subtracted by 100. Source: ICMPD calculations based on data from EurostatPilot Study 2011
Within the four areas, a high degree <strong>of</strong> internalconsistency is observed, which means that withineach <strong>of</strong> the four areas, all indicators are statisticallyrelated to some extent. Among the employmentindicators for men only, there is someinconsistency observable. Some indicators showa few outliers which partly stem from data withlimited reliability. Data are more consistent whenbroken down by gender. The indicators on healthstatus, gaps in educational levels, the gap inself-employed persons as well as the long-termresident status rate show strong variations. Thereasons for the variations can be also explainedby differences in the situations across countriesand must not be a result <strong>of</strong> unreliability in thedata. Explanations for such strong variationacross countries need further investigation.In spite <strong>of</strong> missing data from some countries andmissing data for some indicators the overall situationrelated to data availability and quality is positively.There are enough reliable and robust datafor making international comparisons across theMember States <strong>of</strong> the <strong>European</strong> Union (<strong>EU</strong>). TheLFS and PISA data have been successfully exploredfor the use <strong>of</strong> migrant integration. Current changesto SILC data expect to provide new opportunitiesfor using SILC data to measure migrant integration.Chapter 8:Alternative datasourcesThe data sources used for the indicators onmigrant integration are without doubt the bestavailable sources for the purpose <strong>of</strong> monitoringimmigrant integration throughout the <strong>EU</strong> and forproducing the indicators defined in the ZaragozaDeclaration. There are no other internationallycomparable data sources as good as the <strong>EU</strong> LFSand <strong>EU</strong> SILC for providing annual data coveringmigrants in comparison to the total population.Other international – generally high quality surveys– are, among others, the <strong>European</strong> SocialSurvey (ESS), the Eurobarometer, the World ValuesSurvey, the <strong>European</strong> Values Survey, the <strong>European</strong>Election Study and the International SocialSurvey Programme. Those surveys – in spite <strong>of</strong>their generally good quality – do not provide sufficientlylarge samples <strong>of</strong> immigrants for annualor biennial monitoring <strong>of</strong> migrant integration.It is generally not recommended to use alternativesources from national data sources, as forinstance from existing register data or nationalspecific surveys with larger samples. The use <strong>of</strong>national data sources is not recommended becausethe data are mostly not comparable withthe data from other countries due to deviatingdefinitions and coverage <strong>of</strong> the target population.Since there is no tool to systematicallycheck comparability, there is no better solutionthan to stick to internationally organised andcross-checked data collections (like the onesused). Data from national data sources, <strong>of</strong>tendrawn from national registers, are usually <strong>of</strong>higher quality than from internationally harmoniseddata sources. Although it is obvious thatnational data sources allow for more detailedanalysis, the advantage <strong>of</strong> comparability <strong>of</strong> internationalsurveys is necessary for the purpose<strong>of</strong> <strong>EU</strong>-wide integration monitoring.Chapter 9:Availability <strong>of</strong> datasources for additionalindicatorsThere are various potential additional indicatorsfor monitoring the integration <strong>of</strong> immigrants inthe <strong>European</strong> Union. Eurostat already producedresults for additional indicators on overqualification,self-employment and risk-<strong>of</strong>-povertyand social inclusion. According to the assessment<strong>of</strong> the project coordinator (Migration PolicyGroup), further potential additional indicators inthe area <strong>of</strong> employment were identified: temporaryemployment, part-time employment, longtermunemployment and public sector employment.These indicators are available from the<strong>EU</strong> Labour Force Survey and are thus regularlyproduced in all <strong>EU</strong> Member States. Potentialadditional indicators in the area <strong>of</strong> social inclusioninclude in-work at-risk-<strong>of</strong>-poverty, at-risk<strong>of</strong>-povertyrate before social transfers (exceptpensions), persistent at-risk-<strong>of</strong>-poverty, housingcost overburden rate, as well as other indicatorsrelated to health, such as unmet health needs.All these indicators are available for most <strong>of</strong> <strong>EU</strong>countries from <strong>EU</strong>-SILC data.The potential additional indicators in the areaactive citizenship are related to civic and politicalparticipation, such as membership in organisations,membership in trade unions, membershipin political parties, volunteering or contact withdecision-makers. These indicators are measuredin the <strong>European</strong> Social Survey; however, samplesizes are too small for annual use. Even pooleddata for two or three years may not be enough37