Appendix A - Urban Form Analysis: Canberra's Sustainability ...
Appendix A - Urban Form Analysis: Canberra's Sustainability ...
Appendix A - Urban Form Analysis: Canberra's Sustainability ...

Create successful ePaper yourself
Turn your PDF publications into a flip-book with our unique Google optimized e-Paper software.
<strong>Urban</strong> <strong>Form</strong> <strong>Analysis</strong> - Type D<br />
Canberra Example - Weston, Weston Creek<br />
WESTON is located west of Canberra Central within Weston Creek. Weston<br />
Creek town centre was established in the late 1960s, with the then National<br />
Capital Development Commission describing Weston Creek as ‘one of the most<br />
picturesque parts of the National Capital’.<br />
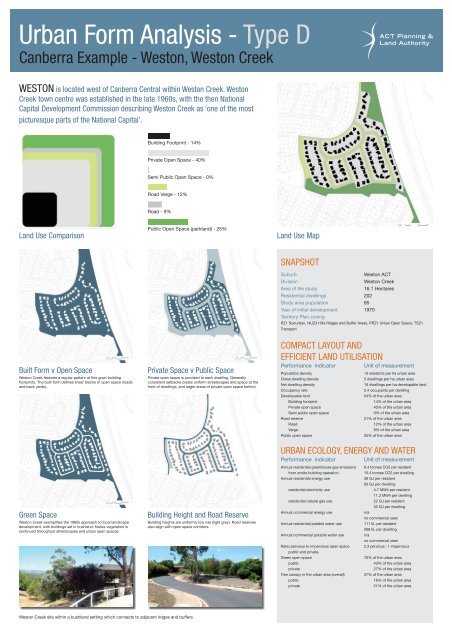
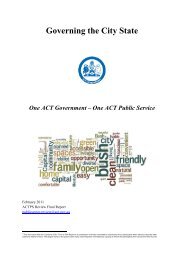
Land Use Comparison Land Use Map<br />
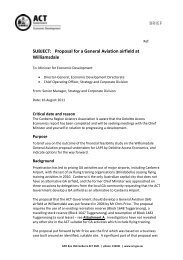
Built <strong>Form</strong> v Open Space<br />
Weston Creek features a regular pattern of fi ne grain building<br />
footprints. The built form defi nes linear blocks of open space (roads<br />
and back yards).<br />
Green Space<br />
Weston Creek exemplifi es the 1960s approach to local landscape<br />
development, with buildings set in bushland. Native vegetation is<br />
continued throughout streetscapes and urban open spaces.<br />
Building Footprint - 14%<br />
Private Open Space - 40%<br />
Semi Public Open Space - 0%<br />
Road Verge - 12%<br />
Road - 9%<br />
Public Open Space (parkland) - 25%<br />
Weston Creek sits within a bushland setting which connects to adjacent ridges and buffers.<br />
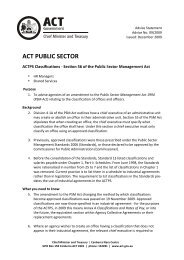
Private Space v Public Space<br />
Private open space is provided to each dwelling. Generally<br />
consistent setbacks create uniform streetscapes and space at the<br />
front of dwellings, and larger areas of private open space behind.<br />
Building Height and Road Reserve<br />
Building heights are uniformly low rise (light grey). Road reserves<br />
also align with open space corridors.<br />
SNAPSHOT<br />
Suburb Weston ACT<br />
Division Weston Creek<br />
Area of tile study 16.1 Hectares<br />
Residential dwellings 202<br />
Study area population 85<br />
Year of initial development 1970<br />
Territory Plan zoning<br />
RZ1 Suburban, NUZ3 Hills Ridges and Buffer Areas, PRZ1 <strong>Urban</strong> Open Space, TSZ1<br />
Transport<br />
COMPACT LAYOUT AND<br />
EFFICIENT LAND UTILISATION<br />
Performance indicator Unit of measurement<br />
Population density 13 residents per ha urban area<br />
Gross dwelling density 5 dwellings per ha urban area<br />
Net dwelling density 10 dwellings per ha developable land<br />
Occupancy rate 2.4 occupants per dwelling<br />
Developable land 54% of the urban area<br />
Building footprint 14% of the urban area<br />
Private open space 40% of the urban area<br />
Semi public open space 0% of the urban area<br />
Road reserve 21% of the urban area<br />
Road 12% of the urban area<br />
Verge 9% of the urban area<br />
Public open space 25% of the urban area<br />
URBAN ECOLOGY, ENERGY AND WATER<br />
Performance indicator Unit of measurement<br />
Annual residential greenhouse gas emissions 6.4 tonnes CO2 per resident<br />
from onsite building operation 15.4 tonnes CO2 per dwelling<br />
Annual residential energy use 39 GJ per resident<br />
93 GJ per dwelling<br />
residential electricity use 4.7 MWh per resident<br />
11.3 MWh per dwelling<br />
residential natural gas use 22 GJ per resident<br />
52 GJ per dwelling<br />
Annual commercial energy use n/a<br />
Annual residential potable water use<br />
no commercial uses<br />
111 kL per resident<br />
268 kL per dwelling<br />
Annual commercial potable water use n/a<br />
no commercial uses<br />
Ratio pervious to impervious open space<br />
public and private<br />
2.3 pervious : 1 impervious<br />
Green open space 70% of the urban area<br />
public 43% of the urban area<br />
private 27% of the urban area<br />
Tree canopy in the urban area (overall) 37% of the urban area<br />
public 16% of the urban area<br />
private 21% of the urban area


![HSR Training Programs Guidelines [ PDF 191KB]](https://img.yumpu.com/51348280/1/190x245/hsr-training-programs-guidelines-pdf-191kb.jpg?quality=85)


![Teachers Technical and Further Education [ PDF 68KB]](https://img.yumpu.com/34230751/1/184x260/teachers-technical-and-further-education-pdf-68kb.jpg?quality=85)