Appendix A - Urban Form Analysis: Canberra's Sustainability ...
Appendix A - Urban Form Analysis: Canberra's Sustainability ...
Appendix A - Urban Form Analysis: Canberra's Sustainability ...

Create successful ePaper yourself
Turn your PDF publications into a flip-book with our unique Google optimized e-Paper software.
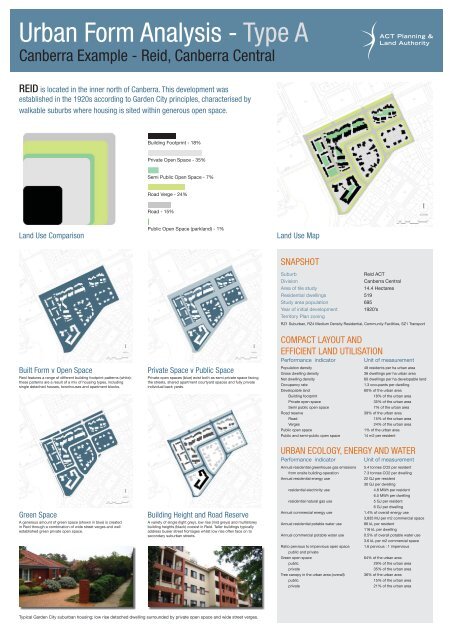
<strong>Urban</strong> <strong>Form</strong> <strong>Analysis</strong> - Type A<br />
Canberra Example - Reid, Canberra Central<br />
REID is located in the inner north of Canberra. This development was<br />
established in the 1920s according to Garden City principles, characterised by<br />
walkable suburbs where housing is sited within generous open space.<br />
Land Use Comparison Land Use Map<br />
Built <strong>Form</strong> v Open Space<br />
Reid features a range of different building footprint patterns (white);<br />
these patterns are a result of a mix of housing types, including<br />
single detached houses, townhouses and apartment blocks.<br />
Green Space<br />
A generous amount of green space (shown in blue) is created<br />
in Reid through a combination of wide street verges and well<br />
established green private open space.<br />
Building Footprint - 18%<br />
Private Open Space - 35%<br />
Semi Public Open Space - 7%<br />
Road Verge - 24%<br />
Road - 15%<br />
Public Open Space (parkland) - 1%<br />
Private Space v Public Space<br />
Private open spaces (blue) exist both as semi private space facing<br />
the streets, shared apartment courtyard spaces and fully private<br />
individual back yards.<br />
Building Height and Road Reserve<br />
A variety of single (light grey), low rise (mid greys) and multistorey<br />
building heights (black) coexist in Reid. Taller buildings typically<br />
address busier street frontages whilst low rise often face on to<br />
secondary suburban streets.<br />
Typical Garden City suburban housing; low rise detached dwelling surrounded by private open space and wide street verges.<br />
SNAPSHOT<br />
Suburb Reid ACT<br />
Division Canberra Central<br />
Area of tile study 14.4 Hectares<br />
Residential dwellings 519<br />
Study area population 695<br />
Year of initial development 1920’s<br />
Territory Plan zoning<br />
RZ1 Suburban, RZ4 Medium Density Residential, Community Facilities, SZ1 Transport<br />
COMPACT LAYOUT AND<br />
EFFICIENT LAND UTILISATION<br />
Performance indicator Unit of measurement<br />
Population density 48 residents per ha urban area<br />
Gross dwelling density 36 dwellings per ha urban area<br />
Net dwelling density 60 dwellings per ha developable land<br />
Occupancy rate 1.3 occupants per dwelling<br />
Developable land 60% of the urban area<br />
Building footprint 18% of the urban area<br />
Private open space 35% of the urban area<br />
Semi public open space 7% of the urban area<br />
Road reserve 39% of the urban area<br />
Road 15% of the urban area<br />
Verges 24% of the urban area<br />
Public open space 1% of the urban area<br />
Public and semi-public open space 14 m2 per resident<br />
URBAN ECOLOGY, ENERGY AND WATER<br />
Performance indicator Unit of measurement<br />
Annual residential greenhouse gas emissions 5.4 tonnes CO2 per resident<br />
from onsite building operation 7.3 tonnes CO2 per dwelling<br />
Annual residential energy use 22 GJ per resident<br />
30 GJ per dwelling<br />
residential electricity use 4.8 MWh per resident<br />
6.5 MWh per dwelling<br />
residential natural gas use 5 GJ per resident<br />
6 GJ per dwelling<br />
Annual commercial energy use 1.4% of overall energy use<br />
3,835 MJ per m2 commercial space<br />
Annual residential potable water use 86 kL per resident<br />
116 kL per dwelling<br />
Annual commercial potable water use 0.5% of overall potable water use<br />
3.6 kL per m2 commercial space<br />
Ratio pervious to impervious open space<br />
public and private<br />
1.6 pervious : 1 impervious<br />
Green open space 64% of the urban area<br />
public 29% of the urban area<br />
private 35% of the urban area<br />
Tree canopy in the urban area (overall) 36% of the urban area<br />
public 15% of the urban area<br />
private 21% of the urban area


![HSR Training Programs Guidelines [ PDF 191KB]](https://img.yumpu.com/51348280/1/190x245/hsr-training-programs-guidelines-pdf-191kb.jpg?quality=85)


![Teachers Technical and Further Education [ PDF 68KB]](https://img.yumpu.com/34230751/1/184x260/teachers-technical-and-further-education-pdf-68kb.jpg?quality=85)